. 2022 Dec 17;23(24):16140.
doi: 10.3390/ijms232416140.

HIF-1α Causes LCMT1/PP2A Deficiency and Mediates Tau Hyperphosphorylation and Cognitive Dysfunction during Chronic Hypoxia

Affiliations

HIF-1α Causes LCMT1/PP2A Deficiency and Mediates Tau Hyperphosphorylation and Cognitive Dysfunction during Chronic Hypoxia

Ling Lei et al. Int J Mol Sci. .

Abstract

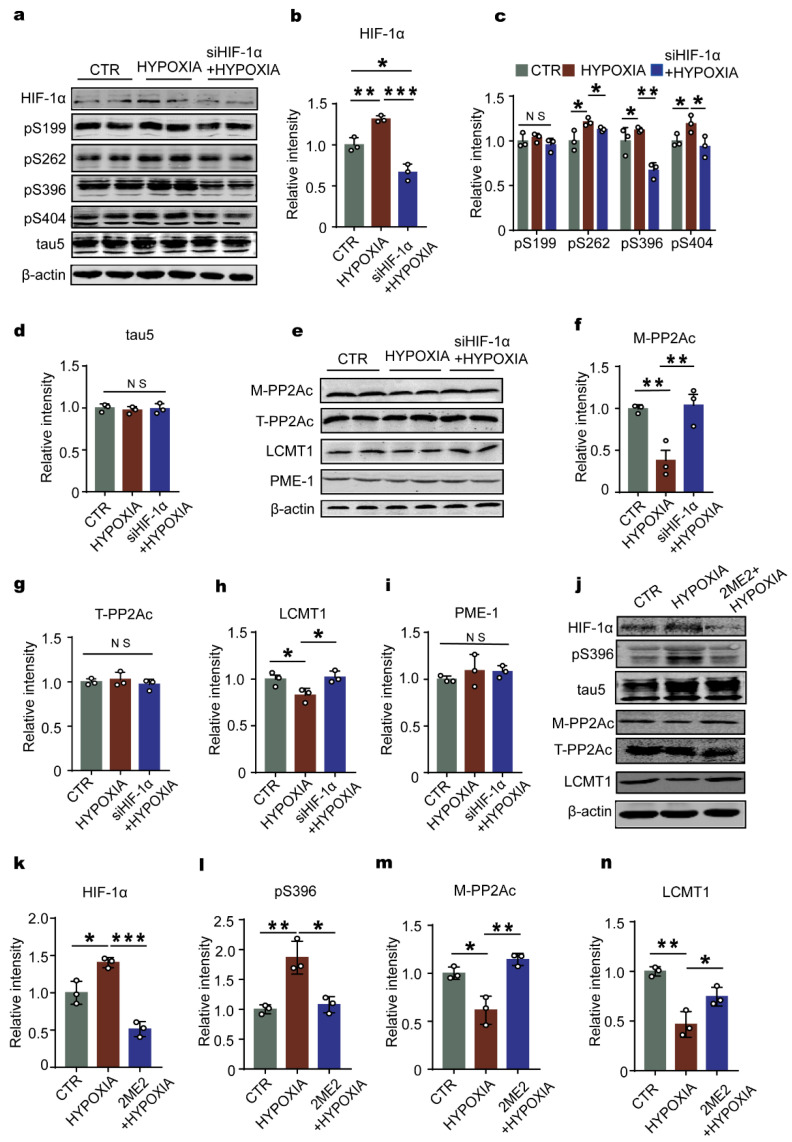
Chronic hypoxia is a risk factor for Alzheimer's disease (AD), and the neurofibrillary tangle (NFT) formed by hyperphosphorylated tau is one of the two major pathological changes in AD. However, the effect of chronic hypoxia on tau phosphorylation and its mechanism remains unclear. In this study, we investigated the role of HIF-1α (the functional subunit of hypoxia-inducible factor 1) in tau pathology. It was found that in Sprague-Dawley (SD) rats, global hypoxia (10% O2, 6 h per day) for one month induced cognitive impairments. Meanwhile it induced HIF-1α increase, tau hyperphosphorylation, and protein phosphatase 2A (PP2A) deficiency with leucine carboxyl methyltransferase 1(LCMT1, increasing PP2A activity) decrease in the rats' hippocampus. The results were replicated by hypoxic treatment in primary hippocampal neurons and C6/tau cells (rat C6 glioma cells stably expressing human full-length tau441). Conversely, HIF-1α silencing impeded the changes induced by hypoxia, both in primary neurons and SD rats. The result of dual luciferase assay proved that HIF-1α acted as a transcription factor of LCMT1. Unexpectedly, HIF-1α decreased the protein level of LCMT1. Further study uncovered that both overexpression of HIF-1α and hypoxia treatment resulted in a sizable degradation of LCMT1 via the autophagy--lysosomal pathway. Together, our data strongly indicated that chronic hypoxia upregulates HIF-1α, which obviously accelerated LCMT1 degradation, thus counteracting its transcriptional expression. The increase in HIF-1α decreases PP2A activity, finally resulting in tau hyperphosphorylation and cognitive dysfunction. Lowering HIF-1α in chronic hypoxia conditions may be useful in AD prevention.

Keywords: HIF-1α; chronic hypoxia; cognitive impairments; leucine carboxyl methyltransferase 1; protein phosphatase 2A; tau.


Conflict of interest statement

The authors declare no conflict of interest.

Figures

Figure 1
Figure 1
Chronic hypoxia impairs cognitive functions in rats. (a) Experimental design. (b) The open field test (OFT) showed no difference in the total distance covered between the two groups. (c) The novel object recognition (NOR) test showed the measured recognition index of the new object within 24 h. (dh) In the Morris water maze (MWM) test, the latency to find the hidden platform from day 1–5 (d); on day 6, spatial memory was tested by removing the platform (e). The time spent in the target quadrant (f), platform crossing times (g), and swimming speed at the day 6 (h) were measured. n = 8–12. All data are presented as mean ± SD. * p < 0.05, ** p < 0.01 vs. control group.
Figure 2
Figure 2
Chronic hypoxia leads to tau hyperphosphorylation, accompanied by loss of LCMT1-related PP2A activity in the hippocampus of rats. (a,b) Immunohistochemistry showed an increase in pS396 positive staining in hypoxic rats compared to control (scale bars = 500 μm and 100 μm). (ce) Hippocampal tissues were homogenized, and phosphor-tau protein levels at pS199, pS262, pS396, and pS404 sites were detected by immunoblotting (c,d). Total tau level was measured (e) with actin as the loading control. (f,g) The levels of the total GSK-3β and the Ser9- phosphorylated GSK-3β (s9-GSK-3β), Leu309-methylated (M-PP2Ac), and total PP2Ac (T-PP2Ac) were measured by Western blotting. (h) PP2A activity assay in different groups in rat hippocampus. (ik) The levels of PP2Ac-specific PME-1 and LCMT1 were measured by Western blotting. All data are presented as mean ± SD. n = 3 (rats per group). * p < 0.05, ** p < 0.01 vs. control.
Figure 3
Figure 3
Hypoxia upregulates HIF-1α and leads to tau hyperphosphorylation in rat primary hippocampal neurons. (a,b) HIF-1α protein level was significantly higher in the hippocampus of hypoxia group compared with that of the control group as evaluated by western blotting, n = 3 rats per group. (c) HIF-1α mRNA expression level of hypoxia group was also increased, n = 3 rats per group. (d) CCK8 assay in primary neurons subjected to hypoxia for different times (0 h, 12 h, 24 h, 36 h, 48 h). (e) Western blots for HIF-1α in primary neurons. (f) Quantification of the HIF-1α protein expression levels after normalization to the β-actin signal. (g) Western blots for tau phosphorylation levels at pS199, pS262, pS396, pS404 sites, and total tau (Tau5) in neurons. (h,i) Quantification of the relative protein expression levels of pS199, pS262, pS396, pS404 tau, and Tau-5 normalization to the β-actin signal. (j,k) Western blots and quantitative analysis of S9-GSK3β, GSK3β, the catalytic subunit of PP2A (m-PP2Ac), and total PP2Ac in neurons. (l) PP2A activity assay in different groups in neurons. (mo) Western blots and quantitative analysis of LCMT1 and PME-1 in neurons. All data represent mean ± SD, n = 3, * p < 0.05, ** p < 0.01 and < 0.001 vs. control group.
Figure 4
Figure 4
Inhibition of HIF-1α expression reduces tau phosphorylation levels and reactivates PP2A in primary neurons. (a) Western blots for HIF-1α and tau phosphorylation levels at pS199, pS262, pS396, pS404 sites, and tau5 in primary neurons. (bd) Quantification of the relative protein expression levels (HIF-1α, pS199, pS262, pS396, pS404, and tau5) after normalization to the β-actin signal. (ei) Western blots and quantitative analysis of T-PP2Ac, M-PP2Ac, LCMT1 and PME-1 in the primary neurons. (j) Western blots for HIF-1α and tau phosphorylation levels at pS396, tau5, M-PP2Ac, T-PP2A and LCMT1 in primary neurons. (kn) Quantification of the relative protein expression levels (HIF-1α, pS396, M-PP2Ac and LCMT1) after normalization to the β-actin signal. Data represent mean ± SD, n = 3, * p < 0.05, ** p < 0.01, *** p < 0.001 vs. control.
Figure 5
Figure 5
Downregulation of HIF-1α rescues chronic hypoxia-induced cognitive impairments in rats. (a) Study design timeline and grouping: control (Group 1), hypoxia (Group 2), siHIF-1α+hypoxia (Group 3), and siHIF-1α+normoxia (Group 4). (b) Western blots for HIF-1α protein level in groups. n = 3 rats per group. (c) Quantification of the relative protein expression levels of HIF-1α after normalization to the β-actin signal. (d) The total distance covered in the OFT. (e) NOR showed the measured recognition index of the new object within 24 h. (fi) The result of MWM test: the latency to find the hidden platform from day 1–5 (f), latency to first cross the position of the platform on test day 6 (g), platform crossing times (h), and swimming speed at day 6 (i). (j) In the fear memory test, the total freezing time was analyzed on test day. n = 7–12. All data are presented as mean ± SD. * p < 0.05, ** p < 0.01, *** p < 0.001 and **** p < 0.0001 vs. control group.
Figure 6
Figure 6
Downregulation of HIF-1α blocks chronic hypoxia-induced LCMT1 deficiency and tau hyperphosphorylation in rats’ hippocampus. (a,b) Hippocampal immunohistochemical staining of pS396 and quantitative analysis in control (Group 1), hypoxia (Group 2), siHIF-1α+hypoxia (Group 3), and siHIF-1α+normoxia (Group 4). (c) Western blots for tau phosphorylation levels at pS199, pS262, pS396, pS404 sites, and total tau (tau5) in the rat hippocampus (d,e). Quantification of the relative protein expression levels of pS199, pS262, pS396, pS404, and tau5 after normalization to the β-actin signal. (fj) Western blots and quantitative analysis of the T-PP2Ac, M-PP2Ac, LCMT1, and PME-1 in the rat hippocampus. (k) PP2A activity assay in different groups of the rat hippocampus. Data represent mean ±SD, n = 3 rats per group, * p < 0.05, ** p < 0.01, *** p < 0.001 vs. Group 1.
Figure 7
Figure 7
HIF-1α promotes the LCMT1 mRNA expression and accelerates its degradation in C6 cells. (a) Dual-luciferase assay. (NC: negative control). (b) LCMT1 mRNA expression levels. (ce) Vector or HIF-1α plasmid was transfected to C6 cells, Western blots, and quantitative analysis of HIF-1α and LCMT1. (f,g) Vector or HIF-1α plasmid was transfected into C6 cells treated with translation inhibitor CHX (100 µg/mL) for 2, 4, 6, and 8 h. The degradation of LCMT1 was evaluated by Western blotting and quantitative analysis. Data are represented as mean ±SD, n = 3, ** p < 0.01 and *** p < 0.001 vs. vector.
Figure 8
Figure 8
CoCl2-induced chemical hypoxia causes degradation of LCMT1 protein through the autophagy lysosomal pathway. (a) CCK8 assay in primary hippocampal neurons treated with increasing doses of CoCl2 (0, 25, 50, 100, 200, 500 µmol/L) for 8 h. (b,c) Western blot for LCMT1 expression from neurons treated with the CQ (10 μmol/L) or MG132 (5 μmol/L) with or without simultaneous 25 μmol/L CoCl2 treatment. (d,e) Quantitative analysis of LCMT1 after being treated with CQ or MG132. (f) Western blot for HIF-1α, LCMT1, and LC3 in the neurons treated with translation inhibitor CHX (100 µg/mL) for another 0, 2, 4, and 6 h. (gi) The protein levels of HIF-1α, LCMT1, and LC3 were quantified. (j) LCMT1 and RAB7 expression were detected by immunofluorescence in cells treated with 25 μmol/L CoCl2. (k) Image J quantification of the average fluorescence values of single cells was used. Data represent mean ±SD, n = 3, * p < 0.05, ** p < 0.01 vs. control.

Similar articles

Cited by

References

    1. Bloom G.S. Amyloid-beta and tau: The trigger and bullet in Alzheimer disease pathogenesis. JAMA Neurol. 2014;71:505–508. doi: 10.1001/jamaneurol.2013.5847. - DOI - PubMed
    1. Tiwari S., Atluri V., Kaushik A., Yndart A., Nair M. Alzheimer’s disease: Pathogenesis, diagnostics, and therapeutics. Int. J. Nanomed. 2019;14:5541–5554. doi: 10.2147/IJN.S200490. - DOI - PMC - PubMed
    1. Busche M.A., Hyman B.T. Synergy between amyloid-beta and tau in Alzheimer’s disease. Nat. Neurosci. 2020;23:1183–1193. doi: 10.1038/s41593-020-0687-6. - DOI - PMC - PubMed
    1. Guo T., Zhang D., Zeng Y., Huang T.Y., Xu H., Zhao Y. Molecular and cellular mechanisms underlying the pathogenesis of Alzheimer’s disease. Mol. Neurodegener. 2020;15:40. doi: 10.1186/s13024-020-00391-7. - DOI - PMC - PubMed
    1. Kowalska A., Pruchnik-Wolinska D., Florczak J., Modestowicz R., Szczech J., Kozubski W., Rossa G., Wender M. Genetic study of familial cases of Alzheimer’s disease. Acta Biochim. Pol. 2004;51:245–252. doi: 10.18388/abp.2004_3617. - DOI - PubMed

LinkOut - more resources