

PS1 Affects the Pathology of Alzheimer's Disease by Regulating BACE1 Distribution in the ER and BACE1 Maturation in the Golgi Apparatus
- PMID: 36555791
- PMCID: PMC9782474
- DOI: 10.3390/ijms232416151
PS1 Affects the Pathology of Alzheimer's Disease by Regulating BACE1 Distribution in the ER and BACE1 Maturation in the Golgi Apparatus
Abstract
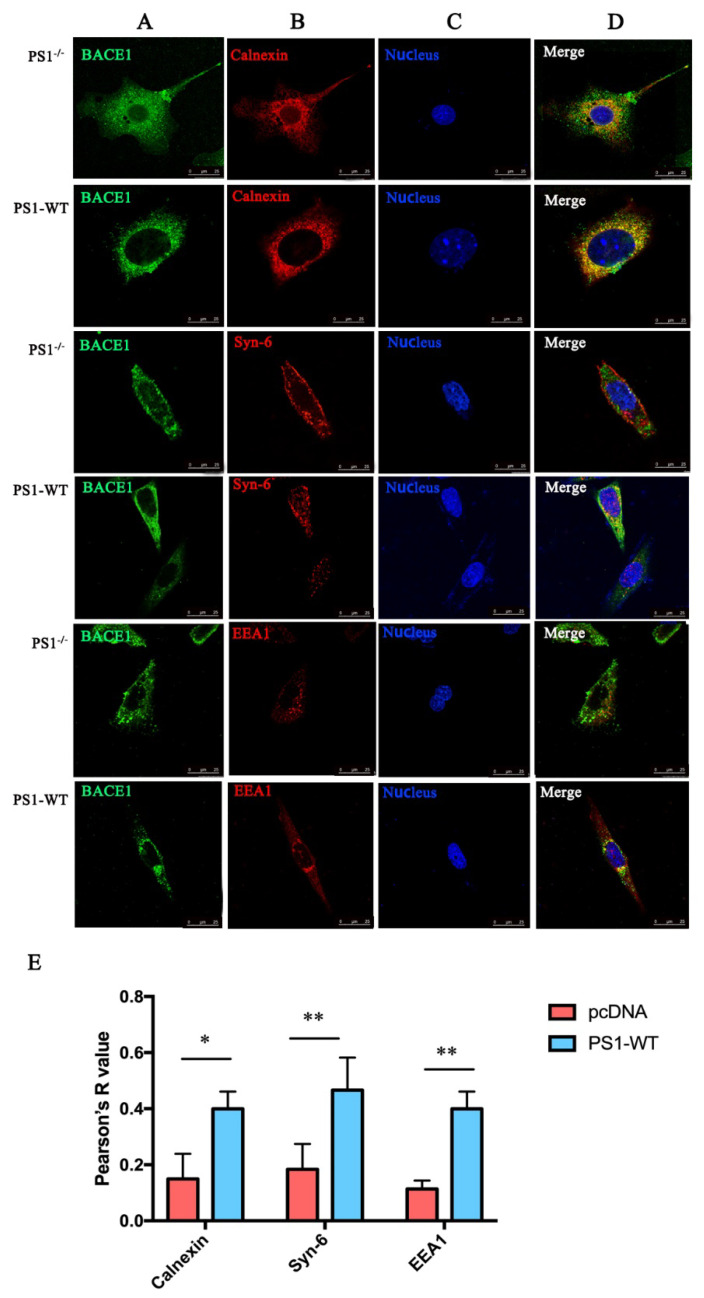
Neuritic plaques are one of the major pathological hallmarks of Alzheimer's disease. They are formed by the aggregation of extracellular amyloid-β protein (Aβ), which is derived from the sequential cleavage of amyloid-β precursor protein (APP) by β- and γ-secretase. BACE1 is the main β-secretase in the pathogenic process of Alzheimer's disease, which is believed to be a rate-limiting step of Aβ production. Presenilin 1 (PS1) is the active center of the γ-secretase that participates in the APP hydrolysis process. Mutations in the PS1 gene (PSEN1) are the most common cause of early onset familial Alzheimer's disease (FAD). The PSEN1 mutations can alter the activity of γ-secretase on the cleavage of APP. Previous studies have shown that PSEN1 mutations increase the expression and activity of BACE1 and that BACE1 expression and activity are elevated in the brains of PSEN1 mutant knock-in mice, compared with wild-type mice, as well as in the cerebral cortex of FAD patients carrying PSEN1 mutations, compared with sporadic AD patients and controls. Here, we used a Psen1 knockout cell line and a PS1 inhibitor to show that PS1 affects the expression of BACE1 in vitro. Furthermore, we used sucrose gradient fractionation combined with western blotting to analyze the distribution of BACE1, combined with a time-lapse technique to show that PS1 upregulates the distribution and trafficking of BACE1 in the endoplasmic reticulum, Golgi, and endosomes. More importantly, we found that the PSEN1 mutant S170F increases the distribution of BACE1 in the endoplasmic reticulum and changes the ratio of mature BACE1 in the trans-Golgi network. The effect of PSEN1 mutations on BACE1 may contribute to determining the phenotype of early onset FAD.
Keywords: BACE1; Golgi; endoplasmic reticulum; mutants; presenilin 1.
Conflict of interest statement
The authors declare no conflict of interest.
Figures


Similar articles
-
Mutant presenilin 1 increases the expression and activity of BACE1.J Biol Chem. 2009 Apr 3;284(14):9027-38. doi: 10.1074/jbc.M805685200. Epub 2009 Feb 5. J Biol Chem. 2009. PMID: 19196715 Free PMC article.
-
Beta-secretase/BACE1 promotes APP endocytosis and processing in the endosomes and on cell membrane.Neurosci Lett. 2018 Oct 15;685:63-67. doi: 10.1016/j.neulet.2018.08.016. Epub 2018 Aug 16. Neurosci Lett. 2018. PMID: 30120949
-
Amyloid-β protein (Aβ) Glu11 is the major β-secretase site of β-site amyloid-β precursor protein-cleaving enzyme 1(BACE1), and shifting the cleavage site to Aβ Asp1 contributes to Alzheimer pathogenesis.Eur J Neurosci. 2013 Jun;37(12):1962-9. doi: 10.1111/ejn.12235. Eur J Neurosci. 2013. PMID: 23773065
-
BACE1: the beta-secretase enzyme in Alzheimer's disease.J Mol Neurosci. 2004;23(1-2):105-14. doi: 10.1385/JMN:23:1-2:105. J Mol Neurosci. 2004. PMID: 15126696 Review.
-
The beta-secretase, BACE: a prime drug target for Alzheimer's disease.J Mol Neurosci. 2001 Oct;17(2):157-70. doi: 10.1385/JMN:17:2:157. J Mol Neurosci. 2001. PMID: 11816789 Review.
Cited by
-
Molecular Mechanism of Alzheimer's Disease.Int J Mol Sci. 2023 Nov 28;24(23):16837. doi: 10.3390/ijms242316837. Int J Mol Sci. 2023. PMID: 38069160 Free PMC article.
-
Advances in the cell biology of the trafficking and processing of amyloid precursor protein: impact of familial Alzheimer's disease mutations.Biochem J. 2024 Oct 2;481(19):1297-1325. doi: 10.1042/BCJ20240056. Biochem J. 2024. PMID: 39302110 Free PMC article. Review.
-
Saponin components in Polygala tenuifolia as potential candidate drugs for treating dementia.Front Pharmacol. 2024 Jul 10;15:1431894. doi: 10.3389/fphar.2024.1431894. eCollection 2024. Front Pharmacol. 2024. PMID: 39050746 Free PMC article. Review.
-
Presenilin 1 Modulates Acetylcholinesterase Trafficking and Maturation.Int J Mol Sci. 2023 Jan 11;24(2):1437. doi: 10.3390/ijms24021437. Int J Mol Sci. 2023. PMID: 36674948 Free PMC article.
References
-
- Vassar R., Bennett B.D., Babu-Khan S., Kahn S., Mendiaz E.A., Denis P., Teplow D.B., Ross S., Amarante P., Loeloff R., et al. Beta-secretase cleavage of Alzheimer’s amyloid precursor protein by the transmembrane aspartic protease BACE. Science. 1999;286:735–741. doi: 10.1126/science.286.5440.735. - DOI - PubMed
MeSH terms
Substances
Grants and funding
LinkOut - more resources
Full Text Sources
Medical
