. 2022 Dec 18;23(24):16158.
doi: 10.3390/ijms232416158.

Effect of Superovulation Treatment on Oocyte's DNA Methylation

Affiliations

Effect of Superovulation Treatment on Oocyte's DNA Methylation

Jordana S Lopes et al. Int J Mol Sci. .

Abstract

Controlled ovarian stimulation is a necessary step in some assisted reproductive procedures allowing a higher collection of female gametes. However, consequences of this stimulation for the gamete or the offspring have been shown in several mammals. Most studies used comparisons between oocytes from different donors, which may contribute to different responses. In this work, we use the bovine model in which each animal serves as its own control. DNA methylation profiles were obtained by single-cell whole-genome bisulfite sequencing of oocytes from pre-ovulatory unstimulated follicles compared to oocytes from stimulated follicles. Results show that the global percentage of methylation was similar between groups, but the percentage of methylation was lower for non-stimulated oocytes in the imprinted genes APEG3, MEG3, and MEG9 and higher in TSSC4 when compared to stimulated oocytes. Differences were also found in CGI of imprinted genes: higher methylation was found among non-stimulated oocytes in MEST (PEG1), IGF2R, GNAS (SCG6), KvDMR1 ICR UMD, and IGF2. In another region around IGF2, the methylation percentage was lower for non-stimulated oocytes when compared to stimulated oocytes. Data drawn from this study might help to understand the molecular reasons for the appearance of certain syndromes in assisted reproductive technologies-derived offspring.

Keywords: ART; DNA methylation; epigenetics; oocyte; ovarian stimulation.


Conflict of interest statement

The authors declare no conflict of interest. The funders had no role in the design of the study; in the collection, analyses, or interpretation of data; in the writing of the manuscript; or in the decision to publish the results.

Figures

Figure 1
Figure 1
Proportions of different genomic features overlapping DNA hypermethylated (colour green) and hypomethylated (colour blue) tiles in cow oocytes compared to the whole genome (global, colour grey).
Figure 2
Figure 2
Venn diagram of hypermethylated (a) and hypomethylated (b) tiles from stimulated (S) and non-stimulated (NS) oocytes, exhibiting the number of exclusive tiles hyper (a) or hypo (b) methylated in each group and the common tiles hyper (a) or hypo (b) methylated between the groups. Within each group, the number preceded by an asterisk represents the number of tiles with a minimum of 10% absolute change in methylation percentage between groups (p < 0.05).
Figure 3
Figure 3
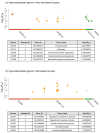
Manhattan plot of g:Profiler enrichment results of hypomethylated DMRs obtained in non-stimulated (a) and stimulated oocytes (b). GO (BP = biological process (orange colour); MF = molecular function (red colour); and CC = cellular component (green colour)) and KEGG database (pink colour) were used for the analysis. Only terms with a p value < 0.05 are shown. The table below shows the top five enriched representative terms, and the statistical value for each term is indicated by the -Log10 (p value).
Figure 4
Figure 4
Manhattan plot of g:Profiler enrichment results of hypermethylated DMRs obtained in non-stimulated (a) and stimulated oocytes (b). GO (Molecular Function – MF, red colour; Biological Process – BP, orange colour; and Cellular Component – CC, green colour) and KEGG database (pink colour) were used for the analysis. Only terms with a p value < 0.05 are shown. The table below shows the top five enriched representative terms, and the statistical value for each term is indicated by the −Log10 (p value).
Figure 5
Figure 5
(a) Heatmap for oocyte 256 DMRs between oocytes from non-stimulated and stimulated cows using the 21 best-covered libraries and considering the animals as biological replicates after segmenting the genome in methylated and unmethylated domains; (b) Heatmap for oocyte 5220 DMRs between non-stimulated and stimulated cows using the merged data sets from the three animals in one single biological replicate after segmenting the genome in methylated and unmethylated domains. On the right side of each heatmap, the scale represents the methylation status, where green corresponds to a lower methylation and red to a higher methylation.
Figure 6
Figure 6
Scatter plot for oocyte 5220 DMRs between non-stimulated and stimulated cows.
Figure 7
Figure 7
Principal component analysis for the 256 oocyte DMRs between a selected number of samples with higher coverage of non-stimulated and stimulated animals.
Figure 8
Figure 8
Functional enrichment analysis with g:Profiler of DMRs obtained by segmenting the genome in hypermethylated and hypomethylated domains for two treatments (stimulated and non-stimulated animals). Manhattan plot of g:Profiler enrichment results obtained for unmerged (a) and merged (b) conditions. GO (Molecular Function – MF, red colour; Biological Process – BP, orange colour; and Cellular Component – CC, green colour), KEGG (pink colour), Reactome (navy blue colour), and WikiPathways (light blue colour) databases were used for the analysis. Only terms with a p value < 0.05 are shown in the graph. The table below shows the most representative terms for each analysis group (where applicable), and the statistical value for each term is indicated by the −Log10 (p value).
Figure 8
Figure 8
Functional enrichment analysis with g:Profiler of DMRs obtained by segmenting the genome in hypermethylated and hypomethylated domains for two treatments (stimulated and non-stimulated animals). Manhattan plot of g:Profiler enrichment results obtained for unmerged (a) and merged (b) conditions. GO (Molecular Function – MF, red colour; Biological Process – BP, orange colour; and Cellular Component – CC, green colour), KEGG (pink colour), Reactome (navy blue colour), and WikiPathways (light blue colour) databases were used for the analysis. Only terms with a p value < 0.05 are shown in the graph. The table below shows the most representative terms for each analysis group (where applicable), and the statistical value for each term is indicated by the −Log10 (p value).
Figure 9
Figure 9
Schematic representation of the experimental design.

References

    1. Santos M.A., Kuijk E.W., Macklon N.S. The impact of ovarian stimulation for IVF on the developing embryo. Reproduction. 2010;139:23–34. doi: 10.1530/REP-09-0187. - DOI - PubMed
    1. Bloise E., Feuer S.K., Rinaudo P.F. Comparative intrauterine development and placental function of ART concepti: Implications for human reproductive medicine and animal breeding. Hum. Reprod. Update. 2014;20:822–839. doi: 10.1093/humupd/dmu032. - DOI - PMC - PubMed
    1. Canovas S., Ross P.J., Kelsey G., Coy P. DNA Methylation in Embryo Development: Epigenetic Impact of ART (Assisted Reproductive Technologies) BioEssays. 2017;39:1–11. doi: 10.1002/bies.201700106. - DOI - PubMed
    1. Keck C., Bassett R., Ludwig M. Factors influencing response to ovarian stimulation. Reprod. Biomed. Online. 2005;11:562–569. doi: 10.1016/S1472-6483(10)61164-9. - DOI - PubMed
    1. La Marca A., Sunkara S.K. Individualization of controlled ovarian stimulation in IVF using ovarian reserve markers: From theory to practice. Hum. Reprod. Update. 2014;20:124–140. doi: 10.1093/humupd/dmt037. - DOI - PubMed