

Analysis of the Impact of the Presence of Phylum Cyanobacteria in the Microbiome of Patients with Breast Cancer on Their Prognosis
- PMID: 36555890
- PMCID: PMC9787457
- DOI: 10.3390/jcm11247272
Analysis of the Impact of the Presence of Phylum Cyanobacteria in the Microbiome of Patients with Breast Cancer on Their Prognosis
Abstract
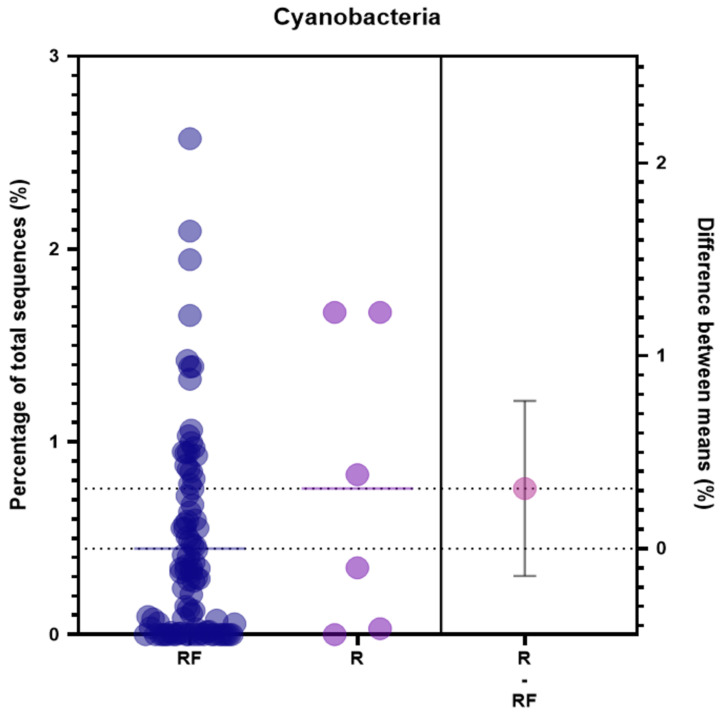
Cyanobacterial blooms caused by Cyanobacteria adversely affect the health of the people living in their vicinity. We elucidated the effect of Cyanobacteria in patients with breast cancer. The serum microbiome of the patients with breast cancer was analyzed using NGS. Serologic tests were performed to analyze the association between the factors affecting the liver function of patients with breast cancer and the amount of Cyanobacteria. In addition, the recurrent-free survival of patients with breast cancer according to the abundance of Cyanobacteria was analyzed. The abundance of Cyanobacteria tended to be correlated with the serological results related to liver function. A high abundance of Cyanobacteria seemed to be more related to late-stage breast cancer. A high recurrent-free survival was related to a low abundance of Cyanobacteria. Even though no toxicity study was conducted, this study demonstrates the impact of phylum Cyanobacteria on the prognosis of patients with breast cancer. Thus, the abundance of Cyanobacteria in the microbiome can help predict the prognosis of patients with breast cancer.
Keywords: Cyanobacteria; breast cancer; microbiome; prognostic factor.
Conflict of interest statement
The authors declare no conflict of interest.
Figures


Similar articles
-
Predicting cyanobacteria bloom occurrence in lakes and reservoirs before blooms occur.Sci Total Environ. 2019 Jun 20;670:837-848. doi: 10.1016/j.scitotenv.2019.03.161. Epub 2019 Mar 12. Sci Total Environ. 2019. PMID: 30921717
-
Influence of cyanobacterial blooms and environmental variation on zooplankton and eukaryotic phytoplankton in a large, shallow, eutrophic lake in China.Sci Total Environ. 2021 Jun 15;773:145421. doi: 10.1016/j.scitotenv.2021.145421. Epub 2021 Jan 26. Sci Total Environ. 2021. PMID: 33582356
-
New insights into cyanobacterial blooms and the response of associated microbial communities in freshwater ecosystems.Environ Pollut. 2022 Sep 15;309:119781. doi: 10.1016/j.envpol.2022.119781. Epub 2022 Jul 13. Environ Pollut. 2022. PMID: 35841988
-
The Impact of Cyanobacteria Blooms on the Aquatic Environment and Human Health.Toxins (Basel). 2022 Sep 23;14(10):658. doi: 10.3390/toxins14100658. Toxins (Basel). 2022. PMID: 36287927 Free PMC article. Review.
-
Harmful freshwater algal blooms, with an emphasis on cyanobacteria.ScientificWorldJournal. 2001 Apr 4;1:76-113. doi: 10.1100/tsw.2001.16. ScientificWorldJournal. 2001. PMID: 12805693 Free PMC article. Review.
Cited by
-
Blood Microbiota and Its Products: Mechanisms of Interference with Host Cells and Clinical Outcomes.Hematol Rep. 2024 Jul 6;16(3):440-453. doi: 10.3390/hematolrep16030043. Hematol Rep. 2024. PMID: 39051416 Free PMC article. Review.
-
Guideline for designing microbiome studies in neoplastic diseases.Geroscience. 2024 Oct;46(5):4037-4057. doi: 10.1007/s11357-024-01255-4. Epub 2024 Jun 26. Geroscience. 2024. PMID: 38922379 Free PMC article. Review.
-
Association between breast cancer risk factors and blood microbiome in patients with breast cancer.Sci Rep. 2025 Feb 19;15(1):6115. doi: 10.1038/s41598-025-90180-3. Sci Rep. 2025. PMID: 39972005 Free PMC article.
References
-
- Joseph T.A., Pe’er I. An introduction to whole-metagenome shotgun sequencing studies. Methods Mol. Biol. 2021;2243:107–122. - PubMed
Grants and funding
LinkOut - more resources
Full Text Sources
