. 2022 Dec 7;12(12):2023.
doi: 10.3390/jpm12122023.

Prognostic Impact of Different Types of Ventricular Tachyarrhythmias Stratified by Underlying Cardiac Disease

Affiliations

Prognostic Impact of Different Types of Ventricular Tachyarrhythmias Stratified by Underlying Cardiac Disease

Tobias Schupp et al. J Pers Med. .

Abstract

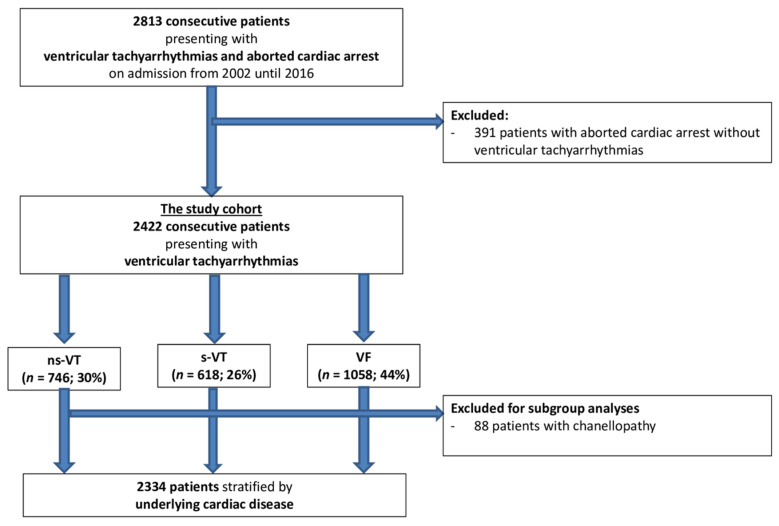
Limited data regarding the outcome of patients with different types of ventricular tachyarrhythmias is available. This study sought to assess the prognostic impact of different types of ventricular tachyarrhythmias stratified by underlying cardiac disease. A large retrospective registry was used including all consecutive patients presenting with ventricular tachycardia (VT) and fibrillation (VF) on admission from 2002 to 2016. Patients with non-sustained VT (ns-VT), sustained VT (s-VT) and VF were compared using uni- and multivariable Cox regression models. Risk stratification was performed after stratification by underlying cardiac disease (i.e., acute myocardial infarction (AMI), ischemic heart disease (IHD), non-ischemic cardiomyopathy (NICM) and patients considered as lower-risk for ventricular tachyarrhythmias). The primary endpoint was defined as all-cause mortality at 2.5 years. Secondary endpoints were cardiac death at 24 h, all-cause mortality at 5 years, cardiac rehospitalization and a composite arrhythmic endpoint at 2.5 years. In 2422 consecutive patients with ventricular tachyarrhythmias, most patients were admitted with VF (44%), followed by ns-VT (30%) and s-VT (26%). Patients with VF suffered most commonly from AMI (42%), whereas heart failure was more common in s-VT patients (32%). In patients with AMI (HR = 1.146; 95% CI 0.751-1.750; p = 0.527) and in the lower-risk group (HR = 1.357; 95% CI 0.702-2.625; p = 0.364), the risk of all-cause mortality did not differ in VF and s-VT patients. In IHD patients, VF was associated with impaired prognosis compared to s-VT (HR = 2.502; 95% CI 1.936-3.235; p = 0.001). In conclusion, VF was associated with worse long-term prognosis compared to s-VT in IHD patients, whereas the risk of all-cause mortality among VF and s-VT patients did not differ in patients with AMI, NICM and in patients considered at lower risk for ventricular tachyarrhythmias.

Keywords: mortality; sudden cardiac death; ventricular fibrillation; ventricular tachyarrhythmia; ventricular tachycardia.


Conflict of interest statement

The authors declare no conflict of interest.

Figures

Figure 1
Figure 1
Study population.
Figure 2
Figure 2
Distribution of different types of ventricular tachyarrhythmias within the entire study cohort, as well as separated by AMI, IHD, NICM and in patients considered at lower risk for ventricular tachyarrhythmias.
Figure 3
Figure 3
Forest plots demonstrating the uni- and multivariable hazard ratios (HR) with 95% confidence intervals (CI) for the primary endpoint all-cause mortality at 2.5 years, as well as for secondary endpoints all-cause mortality at 24 h, all-cause mortality at 5 years, the composite arrhythmic endpoint (i.e., recurrent ventricular tachyarrhythmias, appropriate ICD therapies) at 2.5 years and cardiac rehospitalization at 2.5 years in AMI patients. Multivariable models were adjusted for age, sex, diabetes, chronic kidney disease, LVEF < 35%, COPD, the presence of a prior AMI, CABG and the presence of a CTO. HRs with corresponding 95% CI were calculated for the comparisons of patients with VF compared to s-VT, s-VT versus ns-VT and ns-VT versus s-VT and VF.
Figure 4
Figure 4
Forest plots demonstrating the uni- and multivariable hazard ratios (HR) with 95% confidence intervals (CI) for the primary endpoint all-cause mortality at 2.5 years, as well as for secondary endpoints all-cause mortality at 24 h, all-cause mortality at 5 years, the composite arrhythmic endpoint (i.e., recurrent ventricular tachyarrhythmias, appropriate ICD therapies) at 2.5 years and cardiac rehospitalization at 2.5 years in IHD patients. Multivariable models were adjusted for age, sex, diabetes, chronic kidney disease, LVEF < 35%, COPD, the presence of a prior AMI, CABG and the presence of a CTO. HRs with corresponding 95% CI were calculated for the comparisons of patients with VF compared to s-VT, s-VT versus ns-VT and ns-VT versus s-VT and VF.
Figure 5
Figure 5
Forest plots demonstrating the uni- and multivariable hazard ratios (HR) with 95% confidence intervals (CI) for the primary endpoint all-cause mortality at 2.5 years, as well as for secondary endpoints all-cause mortality at 24 h, all-cause mortality at 5 years, the composite arrhythmic endpoint (i.e., recurrent ventricular tachyarrhythmias, appropriate ICD therapies) at 2.5 years and cardiac rehospitalization at 2.5 years in NICM patients. Multivariable models were adjusted for age, sex, diabetes, chronic kidney disease, LVEF < 35% and COPD. HRs with corresponding 95% CI were calculated for the comparisons of patients with VF compared to s-VT, s-VT versus ns-VT and ns-VT versus s-VT and VF.
Figure 6
Figure 6
Forest plots demonstrating the uni- and multivariable hazard ratios (HR) with 95% confidence intervals (CI) for the primary endpoint all-cause mortality at 2.5 years, as well as for secondary endpoints all-cause mortality at 24 h, all-cause mortality at 5 years, the composite arrhythmic endpoint (i.e., recurrent ventricular tachyarrhythmias, appropriate ICD therapies) at 2.5 years and cardiac rehospitalization at 2.5 years in patients considered at lower risk. Multivariable models were adjusted for age, sex, diabetes, chronic kidney disease and COPD. HRs with corresponding 95% CI were calculated for the comparisons of patients with VF compared to s-VT, s-VT versus ns-VT and ns-VT versus s-VT and VF.

References

    1. Zeppenfeld K., Tfelt-Hansen J., de Riva M., Winkel B.G., Behr E.R., Blom N.A., Charron P., Corrado D., Dagres N., de Chillou C., et al. 2022 ESC Guidelines for the management of patients with ventricular arrhythmias and the prevention of sudden cardiac death. Eur. Heart J. 2022;43:3997–4126. doi: 10.1093/eurheartj/ehac262. - DOI - PubMed
    1. Zheng Z.-J., Croft J.B., Giles W.H., Mensah G. Sudden cardiac death in the United States, 1989 to 1998. Circulation. 2001;104:2158–2163. doi: 10.1161/hc4301.098254. - DOI - PubMed
    1. Shuvy M., Qiu F., Lau G., Koh M., Dorian P., Geri G., Lin S., Ko D.T. Temporal trends in sudden cardiac death in Ontario, Canada. Resuscitation. 2019;136:1–7. doi: 10.1016/j.resuscitation.2019.01.010. - DOI - PubMed
    1. Wong C.X., Brown A., Lau D.H., Chugh S.S., Albert C.M., Kalman J.M., Sanders P. Epidemiology of sudden cardiac death: Global and regional perspectives. Heart Lung Circ. 2019;28:6–14. doi: 10.1016/j.hlc.2018.08.026. - DOI - PubMed
    1. Everett B.M., Moorthy M.V., Tikkanen J.T., Cook N.R., Albert C.M. Markers of myocardial stress, myocardial injury, and sub-clinical inflammation and the risk of sudden death. Circulation. 2020;142:1148–1158. doi: 10.1161/CIRCULATIONAHA.120.046947. - DOI - PMC - PubMed

LinkOut - more resources