. 2022 Dec 7;58(12):1803.
doi: 10.3390/medicina58121803.

Comparative RNA-Sequencing Analysis Reveals High Complexity and Heterogeneity of Transcriptomic and Immune Profiles in Hepatocellular Carcinoma Tumors of Viral (HBV, HCV) and Non-Viral Etiology

Affiliations

Comparative RNA-Sequencing Analysis Reveals High Complexity and Heterogeneity of Transcriptomic and Immune Profiles in Hepatocellular Carcinoma Tumors of Viral (HBV, HCV) and Non-Viral Etiology

Liliana Paslaru et al. Medicina (Kaunas). .

Abstract

Background and Objectives: Hepatocellular carcinoma (HCC), the most common type of primary liver cancer, is the leading cause of cancer-related mortality. It arises and progresses against fibrotic or cirrhotic backgrounds mainly due to infection with hepatitis viruses B (HBV) or C (HCV) or non-viral causes that lead to chronic inflammation and genomic changes. A better understanding of molecular and immune mechanisms in HCC subtypes is needed. Materials and Methods: To identify transcriptional changes in primary HCC tumors with or without hepatitis viral etiology, we analyzed the transcriptomes of 24 patients by next-generation sequencing. Results: We identified common and unique differentially expressed genes for each etiological tumor group and analyzed the expression of SLC, ATP binding cassette, cytochrome 450, cancer testis, and heat shock protein genes. Metascape functional enrichment analysis showed mainly upregulated cell-cycle pathways in HBV and HCV and upregulated cell response to stress in non-viral infection. GeneWalk analysis identified regulator, hub, and moonlighting genes and highlighted CCNB1, ACTN2, BRCA1, IGF1, CDK1, AURKA, AURKB, and TOP2A in the HCV group and HSF1, HSPA1A, HSP90AA1, HSPB1, HSPA5, PTK2, and AURKB in the group without viral infection as hub genes. Immune infiltrate analysis showed that T cell, cytotoxic, and natural killer cell markers were significantly more highly expressed in HCV than in non-viral tumors. Genes associated with monocyte activation had the highest expression levels in HBV, while high expression of genes involved in primary adaptive immune response and complement receptor activity characterized tumors without viral infection. Conclusions: Our comprehensive study underlines the high degree of complexity of immune profiles in the analyzed groups, which adds to the heterogeneous HCC genomic landscape. The biomarkers identified in each HCC group might serve as therapeutic targets.

Keywords: HBV; HCV; RNA-seq; biomarkers; hepatocellular carcinoma; immune infiltrate.


Conflict of interest statement

The authors declare no conflict of interest.

Figures

Figure 1
Figure 1
Functional enrichment gene ontology (STRING) local network clusters, color-coded. (A) 3 tumor groups with common upregulated DEGs. Blue: mitotic cytokinesis and gastric cancer network 1; red: mitotic spindle checkpoint and mitotic nuclear division; green: G2/M DNA replication checkpoint and gastric cancer network 1; yellow: G2/M DNA replication checkpoint and DNA topoisomerases; purple: Wiki Pathways—gastric cancer network 2. (B) 3 tumor groups with common downregulated DEGs. Red: integral component of plasma membrane; blue: signal; green: complement system; yellow: mannose binding; purple: glycoproteins.
Figure 2
Figure 2
Venn diagrams for (A) the upregulated genes in the analyzed etiologies and (B) the downregulated genes in the analyzed etiologies. Blue circles: HBV patients; red circles: HCV patients; green circles: non-B, non-C patients).
Figure 3
Figure 3
Heatmaps of DEGs in non-tumoral and tumoral tissues and volcano plots showing statistically significant up- (blue) and downregulated genes (red) for: (A,B) HBV-related tumors, (C,D) HCV-related tumors, and (E,F) non-viral-infected tumors. In all volcano plots, genes that did not pass the statistical threshold are shown in green.
Figure 3
Figure 3
Heatmaps of DEGs in non-tumoral and tumoral tissues and volcano plots showing statistically significant up- (blue) and downregulated genes (red) for: (A,B) HBV-related tumors, (C,D) HCV-related tumors, and (E,F) non-viral-infected tumors. In all volcano plots, genes that did not pass the statistical threshold are shown in green.
Figure 4
Figure 4
Expression levels for (A) BIRC5 (logFC = 5.02) and SLC22A1 (logFC = −3.74) in the group of patients with HCV infection; (B) FGFR4, HSF1, RNF187, HSP90AB1, and HSPB1 specific to the group of patients without viral infection; (C) CLEC1B (logFC = −5.12) specific to the group of patients with HBV infection; and (D) the common genes HGF (log FC = −2.26), COLEC10 (logFC = −4.13), and CYP17A (logFC = 6.42) among all 3 groups. Gene expression values were normalized to b-actin and paired non-tumoral tissues. The relative levels of expression were calculated by the 2−ΔΔCT method (bars indicate standard errors of the means (±SEMs)).
Figure 5
Figure 5
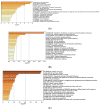
Enrichment heat maps for selected GO DEGs: (A) upregulated in the HBV tumor group; (B) downregulated in the HBV tumor group; (C) upregulated in the HCV tumor group; (D) downregulated in the HCV tumor group; (E) upregulated in the non-B, non-C (non-viral) tumor group; and (F) downregulated in the non-B, non-C (non-viral) tumor group. Bar graphs of enriched terms across input gene lists colored according to p-values. The terms shown in each plot are enumerated in the text below. (A) Selected GO processes and pathways enriched with DEGs upregulated in the HBV-related tumor group: R-HSA-69278: Cell cycle, Mitotic; M129: PID PLK1 PATHWAY; GO:0140014: Mitotic nuclear division; WP2361: Gastric cancer network 1; R-HSA-2299718: Condensation of prophase chromosomes; GO:0007276: Gamete generation; GO:0060828: Regulation of canonical Wnt signaling pathway; R-HSA-381426: Regulation of insulin-like growth factor (IGF) transport and uptake by insulin-like growth factor binding proteins (IGFBPs); GO:0030261: Chromosome condensation; GO:0051302: Regulation of cell division; GO:0045471: Response to ethanol; GO: WP2858: Ectoderm differentiation; GO: 0000281: Mitotic cytokinesis; GO:0008202: Steroid metabolic process. (B) Selected GO processes and pathways enriched with DEGs downregulated in the HBV-related tumor group: GO:0007156: Homophilic cell adhesion via plasma membrane adhesion molecules; GO:0071345: Cellular response to cytokine stimulus; M5885: NABA MATRISOME ASSOCIATED; R-HSA-166662: Lectin pathway of complement activation; hsa04662: B cell receptor signaling pathway; WP5115: Network map of SARS-CoV-2 signaling pathway; GO:0009988: Cell–cell recognition; GO:0007626: Locomotory behavior; GO:0008285: Negative regulation of cell population proliferation; WP297: Endothelin pathways; GO:0009725: Response to hormone and others. (C) Selected GO processes and pathways enriched with DEGs upregulated in the HCV-related tumor group: GO:0000278: Mitotic cell cycle; WP2446: Retinoblastoma gene in cancer; R-HSA-2500257: Resolution of sister chromatid cohesion; GO:0007156: Homophilic cell adhesion via plasma membrane adhesion molecules; M129: PID PLK1 PATHWAY; R-HSA-983231: Factors involved in megakaryocyte development and platelet production; M14: PID AURORA B PATHWAY; WP2361: Gastric cancer network 1; GO:0051321: Meiotic cell cycle; GO:0010389: Regulation of G2/M transition of mitotic cell cycle; R-HSA-69275: G2/M Transition; R-HSA-1474244: Extracellular matrix organization; GO:0051785: Positive regulation of nuclear division; CORUM:7439: ECT2-KIF23-RACGAP1 complex; GO:0051299: Centrosome separation; GO:1901992: Positive regulation of mitotic cell cycle phase transition; WP2363: Gastric cancer network 2; WP3888: VGFA-VGFR signaling pathway and others. (D) Selected GO processes and pathways enriched with DEGs downregulated in the HCV-related tumor group: hsa05204: Chemical carcinogenesis DNA adducts; GO:0032787: Monocarboxylic acid metabolic process; GO:0008202: Steroid metabolic process; WP2806: Complement system; WP2882: Nuclear receptors meta-pathway; GO:0046395: Carboxylic acid catabolic process; GO:0010876: Lipid localization; GO:0006641: Triglyceride metabolic process; GO:0032102: Negative regulation of response to external stimulus; R-HSA-1474244: Extracellular matrix organization; GO:0003013: Circulatory system process; GO:0006790: Sulfur compound metabolic process; GO:0009725: Response to hormone; hsa04976: Bile secretion; WP5115: Network map of SARS-CoV-2 signaling pathway; GO:0006536: Glutamate metabolic process; GO:0051384: Response to glucocorticoid; GO:0038172: Interleukin-33-mediate signaling pathway; GO:0043549: Regulation of kinase activity; Hsa00650: Butanoat metabolism; HSA9006934: Signaling by tyrosine kinases; GO:0031638: Zymogen activation; Hsa00232: Caffeine metabolism; Hsa05200: Pathways in cancer; GO:0098609: Cell–cell adhesion; GO:0015909: Long-chain fatty acid transport; WP1533: Vitamin B12 metabolism; GO:0015849: Organic acid transport; GO:0016042: Lipid catabolism process; GO:0008285: Negative regulation of cell population proliferation; GO:0002697: Regulation of immune effector process and others. (E) Selected GO processes and pathways enriched with DEGs upregulated in the non-viral-infected (non-B, non-C) tumor group: R-HSA-2262752: Cellular responses to stress; GO:0007156: Homophilic cell adhesion via plasma membrane adhesion molecules; WP2882: Nuclear receptors meta-pathway; R-HSA-324858: RMTs methylate histone arginine; GO:0032200: Telomere organization; WP3888: VEGFA-VEGFR2 signaling pathway; CORUM:3055: Nop56p-associated pre-rRNA complex; GO:0040008: Regulation of growth; R-HSA-3371571: HSF1-dependent transactivation; GO:0031647: Regulation of protein stability; GO:0006974: Cellular response to DNA damage stimulus; WP4016: DNA IR damage and cellular response via ATR; R-HSA-9006934: Signaling by receptor tyrosine kinases; GO:0051235: Maintenance of location; GO:0042176: Regulation of protein catabolic process; GO:0033365: Protein localization to organelle; WP1946: Cori cycle; WP314: Fas ligand pathway and stress induction of heat shock proteins; GO:0010506: Regulation of autophagy; R-HSA-1428517: TCA cycle and respiratory electron transport; R-HSA-1428517: TCA cycle and respiratory electron transport; GO:0010506: Regulation of autophagy; R-HSA-2426168: Activation of gene expression by SREBF (SREBP); GO:0000278: Mitotic cell cycle; R-HSA-382551: Transport of small molecules; R-HSA-5653656: Vesicle-mediated transport; GO:0042176: Regulation of protein catabolic process and others. (F) Selected GO processes and pathways enriched with DEGs downregulated in the non-viral-infected (non-B, non-C) tumor group: GO:0098609: Cell–cell adhesion; hsa04610: Complement and coagulation cascades; R-HSA-114608: Platelet degranulation; WP702: Meta-pathway biotransformation Phase I and II; WP5115: Network map of SARS-CoV-2 signaling pathway; GO:0002526: Acute inflammatory response; GO:0001819: Positive regulation of cytokine production; GO:0060191: Regulation of lipase activity; M5885: NABA MATRISOME ASSOCIATED; GO:0030155: Regulation of cell adhesion; GO:0008202: Steroid metabolic process; GO:0006826: Iron ion transport; R-HSA-381426: Regulation of insulin-like growth factor (IGF) transport and uptake by insulin-like growth factor binding proteins (IGFBPs); GO:0072593: Reactive oxygen species metabolic process; GO:002920: Regulation of humoral immune response; Hsa05200: Pathways in cancer; WP4538: Regulatory circuits of the STAT3 signaling pathway; WP5089: Kinin–kallikrein pathway and others.
Figure 5
Figure 5
Enrichment heat maps for selected GO DEGs: (A) upregulated in the HBV tumor group; (B) downregulated in the HBV tumor group; (C) upregulated in the HCV tumor group; (D) downregulated in the HCV tumor group; (E) upregulated in the non-B, non-C (non-viral) tumor group; and (F) downregulated in the non-B, non-C (non-viral) tumor group. Bar graphs of enriched terms across input gene lists colored according to p-values. The terms shown in each plot are enumerated in the text below. (A) Selected GO processes and pathways enriched with DEGs upregulated in the HBV-related tumor group: R-HSA-69278: Cell cycle, Mitotic; M129: PID PLK1 PATHWAY; GO:0140014: Mitotic nuclear division; WP2361: Gastric cancer network 1; R-HSA-2299718: Condensation of prophase chromosomes; GO:0007276: Gamete generation; GO:0060828: Regulation of canonical Wnt signaling pathway; R-HSA-381426: Regulation of insulin-like growth factor (IGF) transport and uptake by insulin-like growth factor binding proteins (IGFBPs); GO:0030261: Chromosome condensation; GO:0051302: Regulation of cell division; GO:0045471: Response to ethanol; GO: WP2858: Ectoderm differentiation; GO: 0000281: Mitotic cytokinesis; GO:0008202: Steroid metabolic process. (B) Selected GO processes and pathways enriched with DEGs downregulated in the HBV-related tumor group: GO:0007156: Homophilic cell adhesion via plasma membrane adhesion molecules; GO:0071345: Cellular response to cytokine stimulus; M5885: NABA MATRISOME ASSOCIATED; R-HSA-166662: Lectin pathway of complement activation; hsa04662: B cell receptor signaling pathway; WP5115: Network map of SARS-CoV-2 signaling pathway; GO:0009988: Cell–cell recognition; GO:0007626: Locomotory behavior; GO:0008285: Negative regulation of cell population proliferation; WP297: Endothelin pathways; GO:0009725: Response to hormone and others. (C) Selected GO processes and pathways enriched with DEGs upregulated in the HCV-related tumor group: GO:0000278: Mitotic cell cycle; WP2446: Retinoblastoma gene in cancer; R-HSA-2500257: Resolution of sister chromatid cohesion; GO:0007156: Homophilic cell adhesion via plasma membrane adhesion molecules; M129: PID PLK1 PATHWAY; R-HSA-983231: Factors involved in megakaryocyte development and platelet production; M14: PID AURORA B PATHWAY; WP2361: Gastric cancer network 1; GO:0051321: Meiotic cell cycle; GO:0010389: Regulation of G2/M transition of mitotic cell cycle; R-HSA-69275: G2/M Transition; R-HSA-1474244: Extracellular matrix organization; GO:0051785: Positive regulation of nuclear division; CORUM:7439: ECT2-KIF23-RACGAP1 complex; GO:0051299: Centrosome separation; GO:1901992: Positive regulation of mitotic cell cycle phase transition; WP2363: Gastric cancer network 2; WP3888: VGFA-VGFR signaling pathway and others. (D) Selected GO processes and pathways enriched with DEGs downregulated in the HCV-related tumor group: hsa05204: Chemical carcinogenesis DNA adducts; GO:0032787: Monocarboxylic acid metabolic process; GO:0008202: Steroid metabolic process; WP2806: Complement system; WP2882: Nuclear receptors meta-pathway; GO:0046395: Carboxylic acid catabolic process; GO:0010876: Lipid localization; GO:0006641: Triglyceride metabolic process; GO:0032102: Negative regulation of response to external stimulus; R-HSA-1474244: Extracellular matrix organization; GO:0003013: Circulatory system process; GO:0006790: Sulfur compound metabolic process; GO:0009725: Response to hormone; hsa04976: Bile secretion; WP5115: Network map of SARS-CoV-2 signaling pathway; GO:0006536: Glutamate metabolic process; GO:0051384: Response to glucocorticoid; GO:0038172: Interleukin-33-mediate signaling pathway; GO:0043549: Regulation of kinase activity; Hsa00650: Butanoat metabolism; HSA9006934: Signaling by tyrosine kinases; GO:0031638: Zymogen activation; Hsa00232: Caffeine metabolism; Hsa05200: Pathways in cancer; GO:0098609: Cell–cell adhesion; GO:0015909: Long-chain fatty acid transport; WP1533: Vitamin B12 metabolism; GO:0015849: Organic acid transport; GO:0016042: Lipid catabolism process; GO:0008285: Negative regulation of cell population proliferation; GO:0002697: Regulation of immune effector process and others. (E) Selected GO processes and pathways enriched with DEGs upregulated in the non-viral-infected (non-B, non-C) tumor group: R-HSA-2262752: Cellular responses to stress; GO:0007156: Homophilic cell adhesion via plasma membrane adhesion molecules; WP2882: Nuclear receptors meta-pathway; R-HSA-324858: RMTs methylate histone arginine; GO:0032200: Telomere organization; WP3888: VEGFA-VEGFR2 signaling pathway; CORUM:3055: Nop56p-associated pre-rRNA complex; GO:0040008: Regulation of growth; R-HSA-3371571: HSF1-dependent transactivation; GO:0031647: Regulation of protein stability; GO:0006974: Cellular response to DNA damage stimulus; WP4016: DNA IR damage and cellular response via ATR; R-HSA-9006934: Signaling by receptor tyrosine kinases; GO:0051235: Maintenance of location; GO:0042176: Regulation of protein catabolic process; GO:0033365: Protein localization to organelle; WP1946: Cori cycle; WP314: Fas ligand pathway and stress induction of heat shock proteins; GO:0010506: Regulation of autophagy; R-HSA-1428517: TCA cycle and respiratory electron transport; R-HSA-1428517: TCA cycle and respiratory electron transport; GO:0010506: Regulation of autophagy; R-HSA-2426168: Activation of gene expression by SREBF (SREBP); GO:0000278: Mitotic cell cycle; R-HSA-382551: Transport of small molecules; R-HSA-5653656: Vesicle-mediated transport; GO:0042176: Regulation of protein catabolic process and others. (F) Selected GO processes and pathways enriched with DEGs downregulated in the non-viral-infected (non-B, non-C) tumor group: GO:0098609: Cell–cell adhesion; hsa04610: Complement and coagulation cascades; R-HSA-114608: Platelet degranulation; WP702: Meta-pathway biotransformation Phase I and II; WP5115: Network map of SARS-CoV-2 signaling pathway; GO:0002526: Acute inflammatory response; GO:0001819: Positive regulation of cytokine production; GO:0060191: Regulation of lipase activity; M5885: NABA MATRISOME ASSOCIATED; GO:0030155: Regulation of cell adhesion; GO:0008202: Steroid metabolic process; GO:0006826: Iron ion transport; R-HSA-381426: Regulation of insulin-like growth factor (IGF) transport and uptake by insulin-like growth factor binding proteins (IGFBPs); GO:0072593: Reactive oxygen species metabolic process; GO:002920: Regulation of humoral immune response; Hsa05200: Pathways in cancer; WP4538: Regulatory circuits of the STAT3 signaling pathway; WP5089: Kinin–kallikrein pathway and others.
Figure 6
Figure 6
Non-viral regulator genes. (A) Scatter plot with DE genes as data points showing the GeneWalk fraction of relevant GO terms over the total number of connected GO terms. These have a large gene connectivity and a high fraction of relevant GO annotations. Circle size indicates differential expression significance strength; [−log10 (p-adjust)] and color hue with min_f. (B) Print-screen of GeneWalk (C) Magnification of upper-right corner of image B. (The complete gene list is given in Supplementary Table S10).
Figure 6
Figure 6
Non-viral regulator genes. (A) Scatter plot with DE genes as data points showing the GeneWalk fraction of relevant GO terms over the total number of connected GO terms. These have a large gene connectivity and a high fraction of relevant GO annotations. Circle size indicates differential expression significance strength; [−log10 (p-adjust)] and color hue with min_f. (B) Print-screen of GeneWalk (C) Magnification of upper-right corner of image B. (The complete gene list is given in Supplementary Table S10).
Figure 7
Figure 7
Non-viral moonlighting genes. (A) Scatter plot. (B) Scatter plot of genes located in the bottom-right area. (C) Magnification of lower-right corner of image B.
Figure 7
Figure 7
Non-viral moonlighting genes. (A) Scatter plot. (B) Scatter plot of genes located in the bottom-right area. (C) Magnification of lower-right corner of image B.
Figure 7
Figure 7
Non-viral moonlighting genes. (A) Scatter plot. (B) Scatter plot of genes located in the bottom-right area. (C) Magnification of lower-right corner of image B.
Figure 8
Figure 8
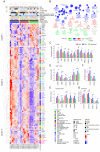
Immune profile analysis. (A) Immunome of HBV (red), HCV (blue), and non-B, non-C (green) tumors. Genes with a fold change >1 and adjusted p-value < 0.05 are shown. Data were Z-score-normalized and hierarchically clustered (Euclidean distance). Z-score spans between −4 (blue) and 4 (red). A color code was used to mark genes preferentially expressed according to immune cell types. Clinical parameters: Age, DEAD, OS (Months), Fibrosis, Macrovascular invasion, Microvascular invasion, Nodules, Grade ES, Gender, Tumor type are indicated at the top. (B) ClueGO functional analysis of gene clusters from (A): Cluster 1 with high expression in non-B, non-C tumors (green), Cluster 2 (HCV, blue), and Cluster 3 (HBV, red). GO terms from levels 3-8 were included (Cluster 2: 1 gene, 6%; Cluster 1 and Cluster 3: 1 gene, 4%). Fusion was applied. Network shows GO terms after multiple testing correction. The size of the nodes shows the significance of the terms. Nodes are colored based on the proportions of associated genes from Cluster 1, Cluster 2, or Cluster 3. Equal proportions of genes from the three clusters are shown in gray. Bar charts showing the expression levels of (C) T cells (D) CD8 T cells (E) cytotoxic cells, (F) immune checkpoint markers, and (G) cytokine markers in HBV (red), HCV (blue), and non-B, non-C (green) tumors. Differential expression analysis was performed with Limma-Voom. Significance levels are shown as: * p < 0.05, ** p < 0.01, *** p < 0.005.

Similar articles

Cited by

References

    1. Globocan. [(accessed on 1 May 2021)]. Available online: https://gco.iarc.fr/today.
    1. McGlynn K.A., Petrick J.L., El-Serag H.B. Epidemiology of Hepatocellular Carcinoma. Hepatology. 2021;73((Suppl. 1)):4–13. doi: 10.1002/hep.31288. - DOI - PMC - PubMed
    1. Llovet J.M., Ricci S., Mazzaferro V., Hilgard P., Gane E., Blanc J.F., de Oliveira A.C., Santoro A., Raoul J.L., Forner A., et al. Sorafenib in advanced hepatocellular carcinoma. N. Engl. J. Med. 2008;359:378–390. doi: 10.1056/NEJMoa0708857. - DOI - PubMed
    1. Bruix J., Qin S., Merle P., Granito A., Huang Y.H., Bodoky G., Pracht M., Yokosuka O., Rosmorduc O., Breder V., et al. Regorafenib for patients with hepatocellular carcinoma who progressed on sorafenib treatment (RESORCE): A randomised, double-blind, placebo-controlled, phase 3 trial. Lancet. 2017;389:56–66. doi: 10.1016/S0140-6736(16)32453-9. - DOI - PubMed
    1. Zhu A.X., Park J.O., Ryoo B.Y., Yen C.J., Poon R., Pastorelli D., Blanc J.F., Chung H.C., Baron A.D., Pfiffer T.E., et al. Ramucirumab versus placebo as second-line treatment in patients with advanced hepatocellular carcinoma following first-line therapy with sorafenib (REACH): A randomised, double-blind, multicentre, phase 3 trial. Lancet Oncol. 2015;16:859–870. doi: 10.1016/S1470-2045(15)00050-9. - DOI - PubMed