. 2022 Dec 6;12(12):1224.
doi: 10.3390/metabo12121224.

Urinary Metabolic Profiling in Volunteers Undergoing Malaria Challenge in Gabon

Affiliations

Urinary Metabolic Profiling in Volunteers Undergoing Malaria Challenge in Gabon

Madeleine Eunice Betouke Ongwe et al. Metabolites. .

Abstract

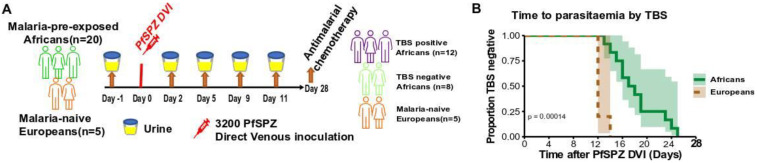
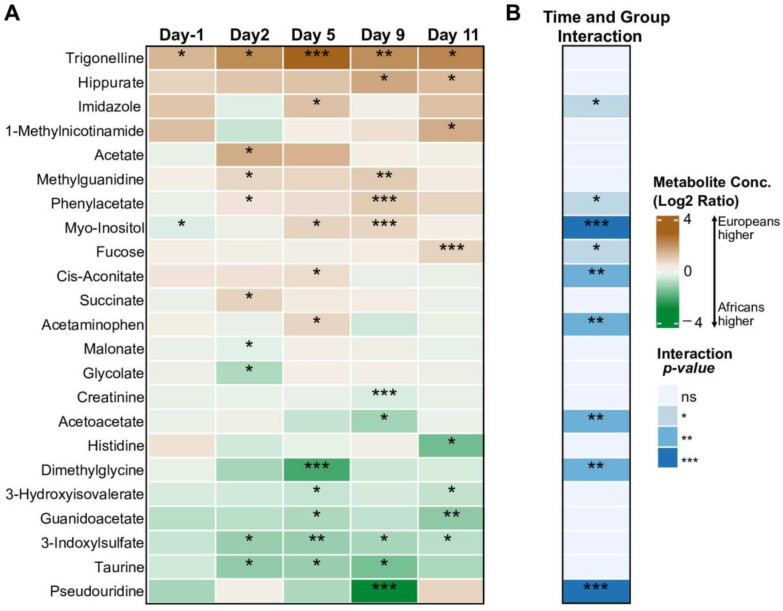
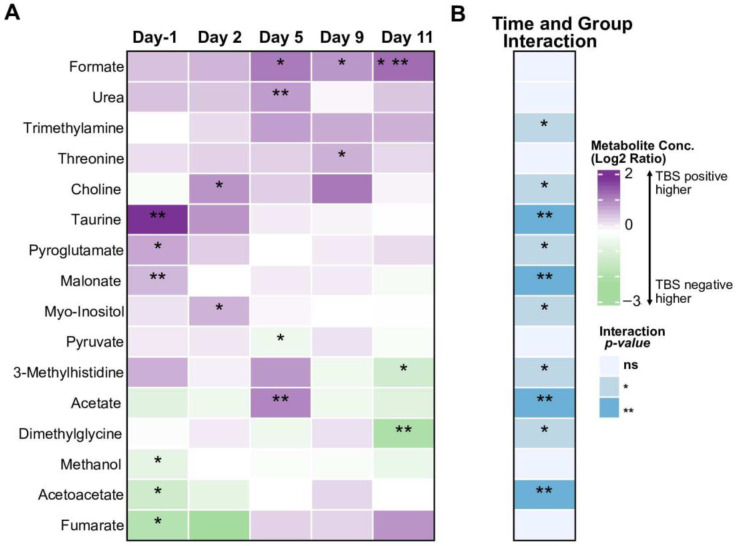
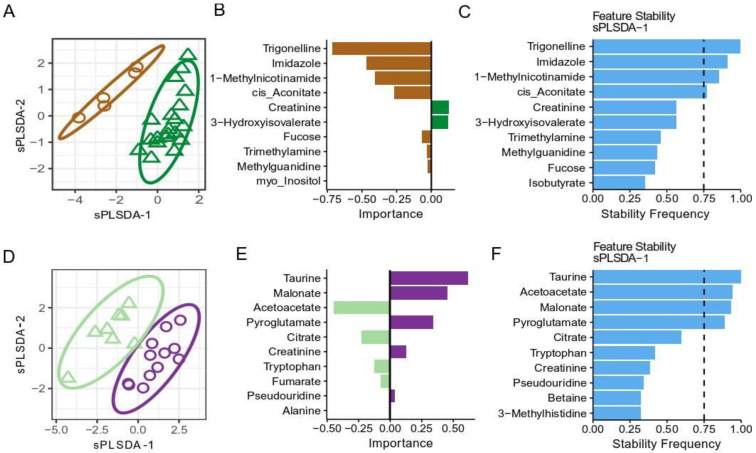
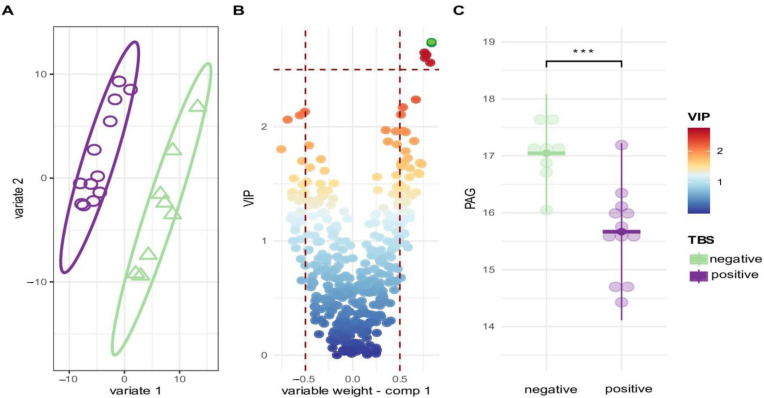
The interaction of malaria parasites with their human host is extensively studied, yet only few studies reported how P. falciparum infection affects urinary metabolite profiles and how this is associated with immunity. We present a longitudinal study of the urinary metabolic profiles of twenty healthy Africans with lifelong exposure to malaria and five malaria-naïve Europeans, who were all challenged with direct venous inoculation of live P. falciparum sporozoïtes (PfSPZ) and followed up until they developed symptoms or became thick blood smear positive (TBS). Urine samples were collected before and at 2, 5, 9 and 11 days post challenge and were analysed. Upon infection, all Europeans became TBS positive, while Africans showed either a delay in time to parasitaemia or controlled infection. Our metabolic data showed that Europeans and Africans had distinct alterations in metabolite patterns, with changes mostly seen on days 5 and 9 post PfSPZ infection, and more prominently in Europeans. Within the African group, the levels of formate, urea, trimethylamine, threonine, choline, myo-inositol and acetate were significantly higher in TBS positive whereas the levels of pyruvate, 3-methylhistidine and dimethylglycine were significantly lower in individuals who remained TBS negative. Notably, before inoculation with PfSPZ, a group of metabolites including phenylacetylglutamine can potentially be used to predict parasitaemia control among Africans. Taken together, this study highlights the difference in urinary metabolic changes in response to malaria infection as a consequence of lifelong exposure to malaria and that change detectable before challenge might predict the control of parasitaemia in malaria-endemic areas.

Keywords: Gabon; Plasmodium falciparum malaria; hydrophilic interaction chromatography-mass spectrometry; metabolomics; nuclear magnetic resonance; urine.


Conflict of interest statement

The authors declare no conflict of interest.

Figures

Figure 1
Figure 1
Study design. (A) A total of 25 healthy volunteers, 20 malaria-exposed Africans and 5 malaria-naive Europeans, received direct intravenous administration of 3200 live, aseptic, cryopreserved P. falciparum sporozoïtes (PfSPZ DVI). (B) Survival curves showing the time to parasitaemia defined by thick blood smear (TBS) microscopy until Day 28 when antimalarial chemotherapy was given in Europeans and Africans. The log-rank test was used to compare the survival distributions of the two groups.
Figure 2
Figure 2
Changes in urinary metabolites in Europeans and Africans upon Plasmodium falciparum infection. (A) Heatmap showing differentially abundant urinary metabolites between Europeans and Africans on Day-1 (before PfSPZ DVI), and at 2, 5, 9, and 11 days post PfSPZ DVI. Color indicates Log2-ratio of metabolite levels between Europeans and Africans; positive values indicate higher metabolite concentrations in Europeans. (B) Metabolites with differential trajectory of change between the groups in response to the challenge (time and group interaction effect). Statistically significant comparisons are indicated using colors and asterisks, as shown in the legend. * p < 0.05, ** p < 0.01, *** p < 0. 001.
Figure 3
Figure 3
Comparison of urinary metabolites in TBS positive and TBS negative Africans after PfSPZ DVI. (A) Heatmap showing differentially abundant urinary metabolites between TBS positive and TBS negative Africans on Day-1 (before PfSPZ DVI), and at 2, 5, 9, and 11 days post PfSPZ DVI. Color indicates Log2-ratio of metabolite levels between the two groups; positive values indicate higher metabolite concentrations in TBS positive Africans. (B) Metabolites with differential trajectory of change between the groups in response to the challenge (time and group interaction effect). Statistically significant comparisons are indicated using colors and asterisks, as shown in the legend. * p < 0.05, ** p < 0.01.
Figure 4
Figure 4
The differences in urinary metabolites at baseline. Sparse PLS-DA (sPLS-DA) analysis of metabolite concentrations at baseline (at Day 1 before PfSPZ DVI) in (A) Europeans (brown color) and Africans (green color) and as well as in (D) TBS negative (light green color) and TBS positive (purple color) Africans. The following hyperparameters were used for both sPLS-DA models in (A,D): two components, maximum distance, 10 variables per component. Model classification performance was assessed using 5-fold cross-validation. Overall classification error rates for the first and second component for (A) were 28% and 29%, respectively, and for (D) were 25% and 21%, respectively. (B,E) Importance of metabolites in the first sPLS-DA component for (A), and (B), respectively. Color indicates the group in which the metabolite concentration is higher. (C,F) represented the frequencies in which the metabolites were retained over 1000 repeats of 5-fold cross-validation, indicating the reproducibility of the signature.
Figure 5
Figure 5
Mass spectrometry reveals metabolites discriminating TBS positive and TBS negative Africans before PfSPZ DVI. (A) A score plot of PLS-DA model with a TBS status as a class identity. A classification performance of the model was assessed by five-fold cross-validation with over 1000 repeats; overall classification error rate was 22% for the first and 15% for the second component. (B) A plot showing variable weight on the first component (X axis) versus variable importance on projection (VIP) values; the plot reveals a cluster of the features with VIP > 2.5 upregulated in the TBS negative Africans. (C) A dot plot showing the difference in a relative abundance between TBS negative and TBS positive Africans for a feature with the highest VIP (i.e., VIP > 2.5, coloured in green). The feature annotated as Phenylacetylglutamine (PAG). *** p < 0.001.
Figure 6
Figure 6
Phenylacetylglutamine may predict parasitemia in Africans before PfSPZ DVI. Confirmation of the identity of phenylacetylglutamine (PAG) with the analysis of a sample composed of pooled urine samples collected from TBS negative Africans at Day-1 before PfSPZ DVI (Blank urine), the same urine sample spiked with PAG (Spiked urine) and a neat standard of PAG (PAG standard). (A) Extracted ion chromatogram, (B) MS spectrum and (C) MS/MS fragmentation spectrum, of PAG in blank urine, spiked urine and PAG standard. The retention times, as well as MS and MS/MS spectra of PAG overlap in the different samples injected, confirming the identity of PAG (confidence level 1 in the metabolite identification). Experimental conditions: see main text.

References

    1. Arya A., Foko L.P.K., Chaudhry S., Sharma A., Singh V. Artemisinin-based combination therapy (ACT) and drug resistance molecular markers: A systematic review of clinical studies from two malaria endemic regions—India and sub-Saharan Africa. Int. J. Parasitol. Drugs Drug Resist. 2021;15:43–56. doi: 10.1016/j.ijpddr.2020.11.006. - DOI - PMC - PubMed
    1. Ashley E.A., Dhorda M., Fairhurst R.M., Amaratunga C., Lim P., Suon S., Sreng S., Anderson J.M., Mao S., Sam B., et al. Spread of artemisinin resistance in Plasmodium falciparum malaria. N. Engl. J. Med. 2014;371:411–423. doi: 10.1056/NEJMoa1314981. - DOI - PMC - PubMed
    1. Fairhurst R.M., Dondorp A.M. Artemisinin-Resistant Plasmodium falciparum Malaria. Microbiol. Spectr. 2016;4:36. doi: 10.1128/microbiolspec.EI10-0013-2016. - DOI - PMC - PubMed
    1. Acharya P., Garg M., Kumar P., Munjal A., Raja K.D. Host-Parasite Interactions in Human Malaria: Clinical Implications of Basic Research. Front. Microbiol. 2017;8:889. doi: 10.3389/fmicb.2017.00889. - DOI - PMC - PubMed
    1. Menard R., Tavares J., Cockburn I., Markus M., Zavala F., Amino R. Looking under the skin: The first steps in malarial infection and immunity. Nat. Rev. Microbiol. 2013;11:701–712. doi: 10.1038/nrmicro3111. - DOI - PubMed

LinkOut - more resources