. 2022 Dec 15;12(12):1272.
doi: 10.3390/metabo12121272.

Metabolomics and Lipidomics Signatures of Insulin Resistance and Abdominal Fat Depots in People Living with Obesity

Affiliations

Metabolomics and Lipidomics Signatures of Insulin Resistance and Abdominal Fat Depots in People Living with Obesity

Yen Chin Koay et al. Metabolites. .

Abstract

The liver, skeletal muscle, and adipose tissue are major insulin target tissues and key players in glucose homeostasis. We and others have described diverse insulin resistance (IR) phenotypes in people at risk of developing type 2 diabetes. It is postulated that identifying the IR phenotype in a patient may guide the treatment or the prevention strategy for better health outcomes in populations at risk. Here, we performed plasma metabolomics and lipidomics in a cohort of men and women living with obesity not complicated by diabetes (mean [SD] BMI 36.0 [4.5] kg/m2, n = 62) to identify plasma signatures of metabolites and lipids that align with phenotypes of IR (muscle, liver, or adipose tissue) and abdominal fat depots. We used 2-step hyperinsulinemic-euglycemic clamp with deuterated glucose, oral glucose tolerance test, dual-energy X-ray absorptiometry and abdominal magnetic resonance imaging to assess muscle-, liver- and adipose tissue- IR, beta cell function, body composition, abdominal fat distribution and liver fat, respectively. Spearman’s rank correlation analyses that passed the Benjamini−Hochberg statistical correction revealed that cytidine, gamma-aminobutyric acid, anandamide, and citrate corresponded uniquely with muscle IR, tryptophan, cAMP and phosphocholine corresponded uniquely with liver IR and phenylpyruvate and hydroxy-isocaproic acid corresponded uniquely with adipose tissue IR (p < 7.2 × 10⁻⁴). Plasma cholesteryl sulfate (p = 0.00029) and guanidinoacetic acid (p = 0.0001) differentiated between visceral and subcutaneous adiposity, while homogentisate correlated uniquely with liver fat (p = 0.00035). Our findings may help identify diverse insulin resistance and adiposity phenotypes and enable targeted treatments in people living with obesity.

Keywords: abdominal fat deposition; liver fat; obesity phenotypes; plasma lipidomics; plasma metabolomics; tissue insulin resistance.


Conflict of interest statement

The authors declared no conflict of interest.

Figures

Figure 1
Figure 1
Spearman correlations between the clinical characteristics. The correlations are shown as a heatmap with the color indicating the significance and direction of the correlation (Spearman) (i.e., red positive, blue negative). Only the significant correlations are shown, where the p-value cut-off for significance (p = 0.025503) was determined using the Benjamini–Hochberg correction. Note the full correlation of the variables with themselves along the diagonal. Complete data were available for all variables other than the abdominal MRI data (n = 59) and AUC of insulin and c-peptide (n = 57 and n = 59, respectively).
Figure 2
Figure 2
Omics patterns of plasma lipidomics and metabolomics in individuals living with obesity. (A) Hierarchical clustering of metabolic phenotypes by plasma lipidomics and metabolomics. (B) Chain length (number of carbons) and number of double bonds in the TAGs represented in the blue cluster. In panel A, the clinical variables are shown in the rows with the metabolomics and lipidomics variables in the columns. The H = (1 − p)sign(R) value is shown as a heatmap with the color indicating the significance and direction of the correlation (Spearman) (i.e., red positive, blue negative and the darker the color the more significant p Value). The variables are clustered firstly according to the clinical variables (rows) with the hierarchical cluster tree shown as a dendrogram on the left. The p-value data in the columns (metabolomic and lipidomic variables) were then hierarchically clustered with the dendrogram shown at the top of the heatmap. In panel B, the color indicates the fraction of the total number of fatty acids (n = 207 FAs). Complete data were available for all variables other than the abdominal MRI data (n = 59) and AUC of insulin and c-peptide (n = 57 and n = 59, respectively).
Figure 3
Figure 3
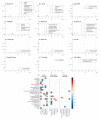
Metabolite correlates of clinical traits in a cohort of people living with obesity (AL). Combined Spearman R coefficient for the 25 metabolites which correlated with the different phenotypes. Significant R-values for the Spearman coefficient between metabolites and clinical traits are shown. Only the significant correlations are shown, where the p-value cut-off was determined by the Benjamini–Hochberg procedure (p = 0.00071671) and depicted in dotted lines (panels AL). Non-significant values are not shown. Red- positive and blue- negative R (M). Complete data were available for all variables other than the abdominal MRI data (n = 59) and AUC of insulin and c-peptide (n = 57 and n = 59, respectively).

Similar articles

Cited by

References

    1. Korenblat K.M., Fabbrini E., Mohammed B.S., Klein S. Liver, Muscle and Adipose Tissue Insulin Action is Directly Related to Intrahepatic Triglyceride Content in Obese Subjects. Gastroenterology. 2008;134:1369–1375. doi: 10.1053/j.gastro.2008.01.075. - DOI - PMC - PubMed
    1. Groop L.C., Bonadonna R.C., DelPrato S., Ratheiser K., Zyck K., Ferrannini E., DeFronzo R.A. Glucose and free fatty acid metabolism in non-insulin-dependent diabetes mellitus. Evidence for multiple sites of insulin resistance. J. Clin. Investig. 1989;84:205–213. doi: 10.1172/JCI114142. - DOI - PMC - PubMed
    1. Ferrannini E., Simonson D.C., Katz L.D., Reichard G., Jr., Bevilacqua S., Barrett E.J., Olsson M., DeFronzo R.A. The disposal of an oral glucose load in patients with non-insulin-dependent diabetes. Metabolism. 1988;37:79–85. doi: 10.1016/0026-0495(88)90033-9. - DOI - PubMed
    1. Trouwborst I., Bowser S.M., Goossens G.H., Blaak E.E. Ectopic Fat Accumulation in Distinct Insulin Resistant Phenotypes; Targets for Personalized Nutritional Interventions. Front. Nutr. 2018;5:77. doi: 10.3389/fnut.2018.00077. - DOI - PMC - PubMed
    1. Blanco-Rojo R., Alcala-Diaz J.F., Wopereis S., Perez-Martinez P., Quintana-Navarro G.M., Marin C., Ordovas J.M., van Ommen B., Perez-Jimenez F., Delgado-Lista J., et al. The insulin resistance phenotype (muscle or liver) interacts with the type of diet to determine changes in disposition index after 2 years of intervention: The CORDIOPREV-DIAB randomised clinical trial. Diabetologia. 2016;59:67–76. doi: 10.1007/s00125-015-3776-4. - DOI - PubMed

LinkOut - more resources