. 2022 Dec 16;12(12):1278.
doi: 10.3390/metabo12121278.

1H-NMR-Based Metabonomics Study to Reveal the Progressive Metabolism Regulation of SAP Deficiency on ApoE-/- Mice

Affiliations

1H-NMR-Based Metabonomics Study to Reveal the Progressive Metabolism Regulation of SAP Deficiency on ApoE-/- Mice

Qian Li et al. Metabolites. .

Abstract

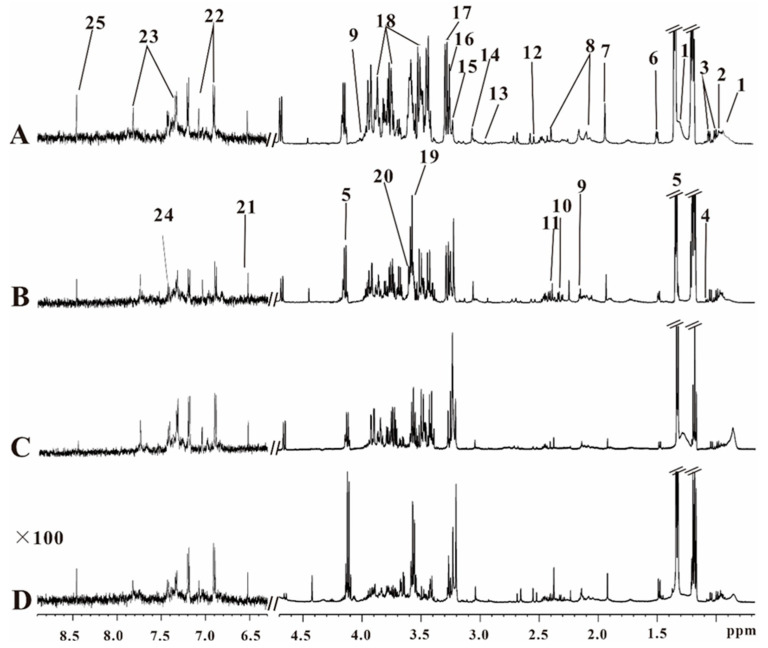
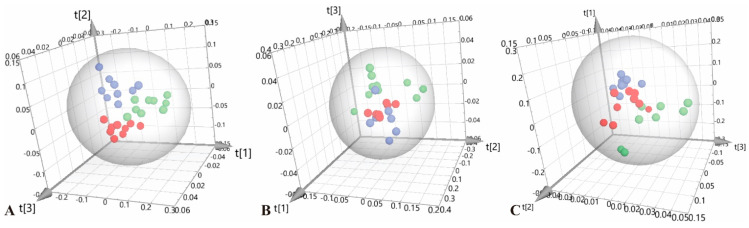
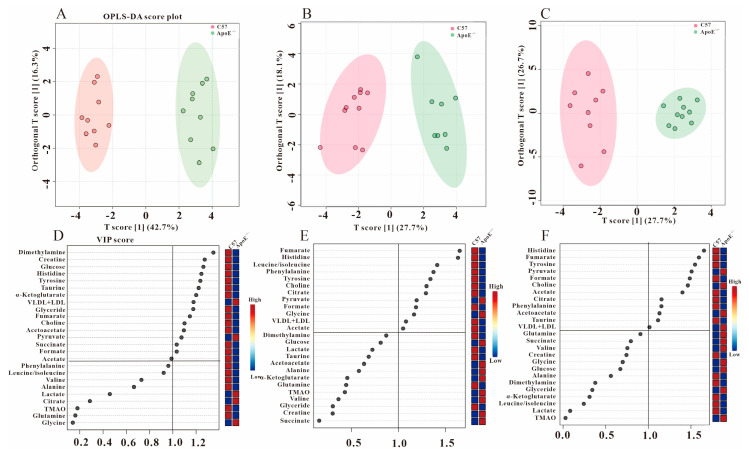
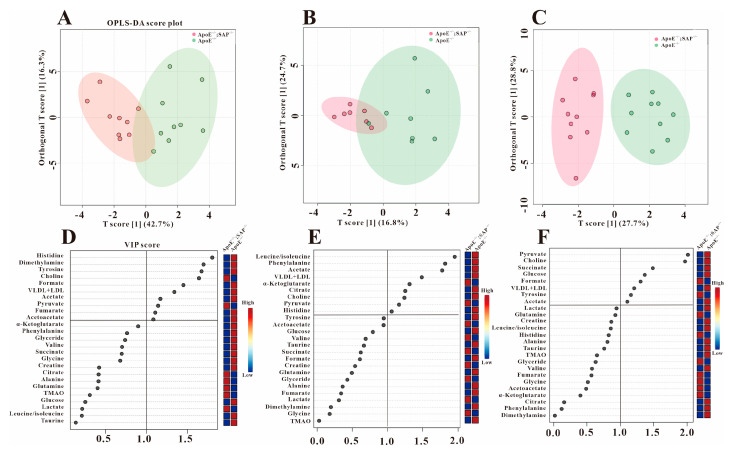
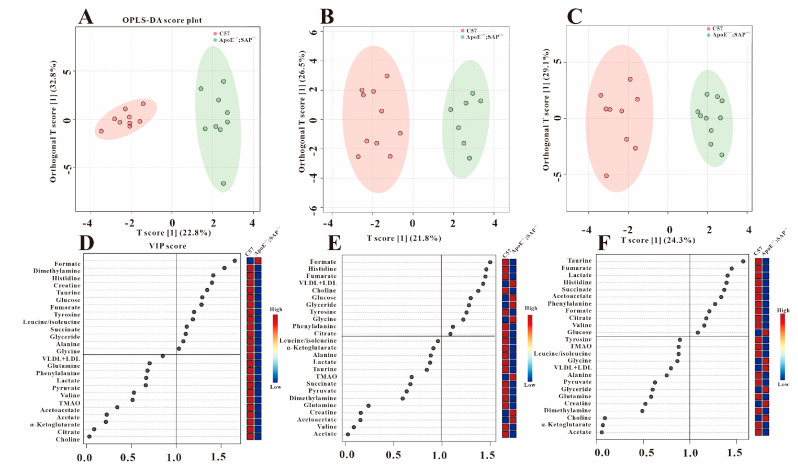
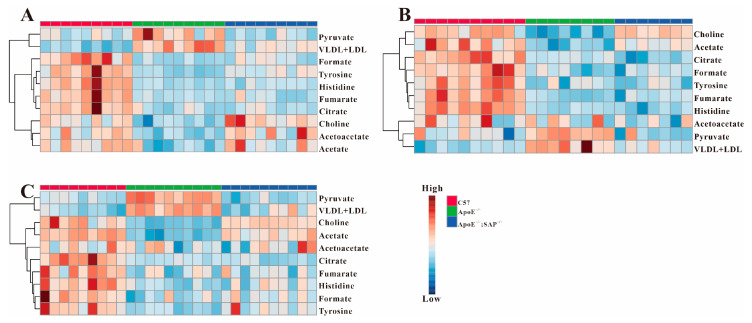
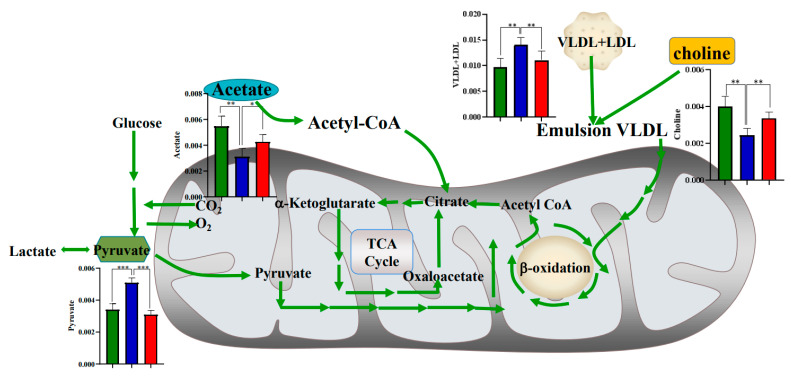
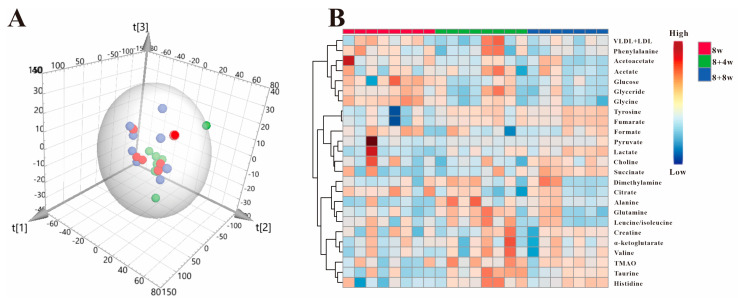
Atherosclerosis is the most common disease of the vascular system and the metabolic disorder is one of its important molecular mechanisms. SAP protein is found to be highly expressed in atherosclerotic blood vessels. Our previous study found that SAP deficiency can significantly inhibit the development of atherosclerosis. However, the regulatory effect of SAP deficiency on AS metabolism is unknown. Based on 1H-NMR metabonomics, this study investigated the serum metabolic changes in ApoE-/-;SAP-/- mice compared with ApoE-/- mice during the whole progression of atherosclerosis. The results showed that acetate, pyruvate, choline and VLDL + LDL were statistically regulated to the normal levels as in C57 mice by SAP deficiency in ApoE-/-;SAP-/- mice at 8 w (without obvious plaques). With the appearance and aggravation of atherosclerotic plaques (8 + 4 w and 8 + 8 w), the four metabolites of acetate, pyruvate, choline and VLDL + LDL were continuously regulated, which were denoted as the metabolic regulatory markers of SAP deficiency. We also found that the changes in these four metabolites had nothing to do with high-fat diet. Therefore, it was revealed that SAP deficiency regulated the metabolic disorders in ApoE-/- prior to the appearance of obvious atherosclerotic plaques, which is one of the important mechanisms leading to the inhibition of atherosclerosis, providing a new basis for the application of SAP in atherosclerosis.

Keywords: 1H-NMR; SAP; atherosclerosis; metabonomics.


Conflict of interest statement

The authors declare no conflicts of interest.

Figures

Figure 1
Figure 1
Representative serum 1H-NMR spectra of (A) ApoE−/− mice, (B) ApoE−/−;SAP−/− mice, (C) SAP−/− mice, (D) C57 mice. (The spectral peaks in the range of δ 6.3–8.9 are amplified 100 times.) 1. VLDL + LDL. 2. leucine/isoleucine (Leu). 3. valine (Val). 4. α-ketoglutarate. 5. lactate (Lac). 6. alanine. 7. Acetate (Ace). 8. glutamine. 9. acetoacetate. 10. pyruvate(Pyr). 11. succinate(Suc). 12. citrate. 13. dimethylamine. 14. Creatine (Cr). 15. Choline (Cho). 16. TMAO. 17. Taurine (Tau). 18. α,β-glucose (α,β-Glc). 19. glycine(Gly). 20. glyceride. 21. fumarate. 22. Tyrosine (Try). 23. Histidine (His). 24. Phenylalanine (Phe). 25. formate.
Figure 2
Figure 2
PCA scores plots for 1H-NMR spectra data. (A) 8 w, R2X = 0.937, Q2 = 0.904; (B) 8 + 4 w, R2X = 0.940, Q2 = 0.802; (C) 8 + 8 w, R2X = 0.955, Q2 = 0.778. ● C57; ● ApoE−/−; ● ApoE−/−;SAP−/−.
Figure 3
Figure 3
Metabolic differences between C57 and ApoE−/− groups at three periods. OPLS−DA scores plots (A) (8 w), (B) (8 + 4 w), (C) (8 + 8 w) and VIP scores (D) (8 w), (E) (8 + 4 w), (F) (8 + 8 w).
Figure 4
Figure 4
Metabolic differences between ApoE−/−;SAP−/− and ApoE−/− groups at three periods. OPLS−DA scores plots (A) (8 w), (B) (8 + 4 w), (C) (8 + 8 w) and VIP scores (D) (8 w), (E) (8 + 4 w), (F) (8 + 8 w).
Figure 5
Figure 5
Metabolic differences between C57 and ApoE−/−;SAP−/− groups at three periods. OPLS−DA scores plots (A) (8 w), (B) (8 + 4 w), (C) (8 + 8 w) and VIP scores (D) (8 w), (E) (8 + 4 w), (F) (8 + 8 w).
Figure 6
Figure 6
Heatmaps of all metabolic features in three groups. (A) metabolic profiles at 8 w; (B) metabolic profiles at 8 + 4 w and (C) metabolic profiles at 8 + 8 w.
Figure 7
Figure 7
Metabolic regulatory network induced by SAP deficiency in ApoE−/− model. The histogram results of statistical analysis were from the data in 8 + 8 w. ■ C57; ■ ApoE−/−; ■ ApoE−/−;SAP−/−. * p < 0.05, ** p < 0.01, *** p < 0.001.
Figure 8
Figure 8
(A) PCA scores plots for 1H-NMR spectra data of SAP−/− mice serum. ● 8 w; ● 8 + 4 w; ● 8 + 8 w; R2X = 0.975, Q2 = 0.816. (B) Heatmap of SAP−/− mice in three periods.

Similar articles

References

    1. Topol E.J., Yadav J.S. Recognition of the importance of embolization in atherosclerotic vascular disease. Circulation. 2000;101:570–580. doi: 10.1161/01.CIR.101.5.570. - DOI - PubMed
    1. Jenny N.S., Arnold A.M., Kuller L.H., Tracy R.P., Psaty B.M. Serum amyloid P and cardiovascular disease in older men and women:results from the Cardiovascular Health Study. Arterioscler. Thromb. Vasc. Biol. 2007;27:352–358. doi: 10.1161/01.ATV.0000254150.97741.fe. - DOI - PubMed
    1. Li X.A., Hatanaka K., Ishibashi-Ueda H., Yutani C., Yamamoto A. Characterization of serum amyloid P component from human aortic atherosclerotic lesions. Arterioscler. Thromb. Vasc. Biol. 1995;15:252–257. doi: 10.1161/01.ATV.15.2.252. - DOI - PubMed
    1. Stewart C.R., Haw A., 3rd, Lopez R., McDonald T.O., Callaghan J.M., McConville M.J., Moore K.J., Howlett G.J., O’Brien K.D. Serum amyloid P colocalizes with apolipoproteins in human atheroma: Functional implications. J. Lipid Res. 2007;48:2162–2171. doi: 10.1194/jlr.M700098-JLR200. - DOI - PubMed
    1. Li X.A., Yutani C., Shimokado K. Serum amyloid P component associates with high density lipoprotein as well as very low density lipoprotein but not with low density lipoprotein. Biochem. Biophys Res. Commun. 1998;244:249–252. doi: 10.1006/bbrc.1998.8248. - DOI - PubMed