. 2022 Dec 16;12(12):1281.
doi: 10.3390/metabo12121281.

Optimising Fluvoxamine Maternal/Fetal Exposure during Gestation: A Pharmacokinetic Virtual Clinical Trials Study

Affiliations

Optimising Fluvoxamine Maternal/Fetal Exposure during Gestation: A Pharmacokinetic Virtual Clinical Trials Study

Khairulanwar Burhanuddin et al. Metabolites. .

Abstract

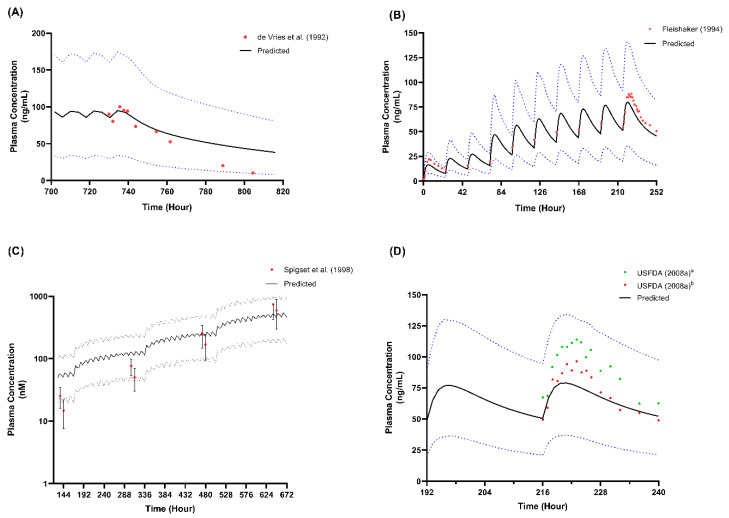
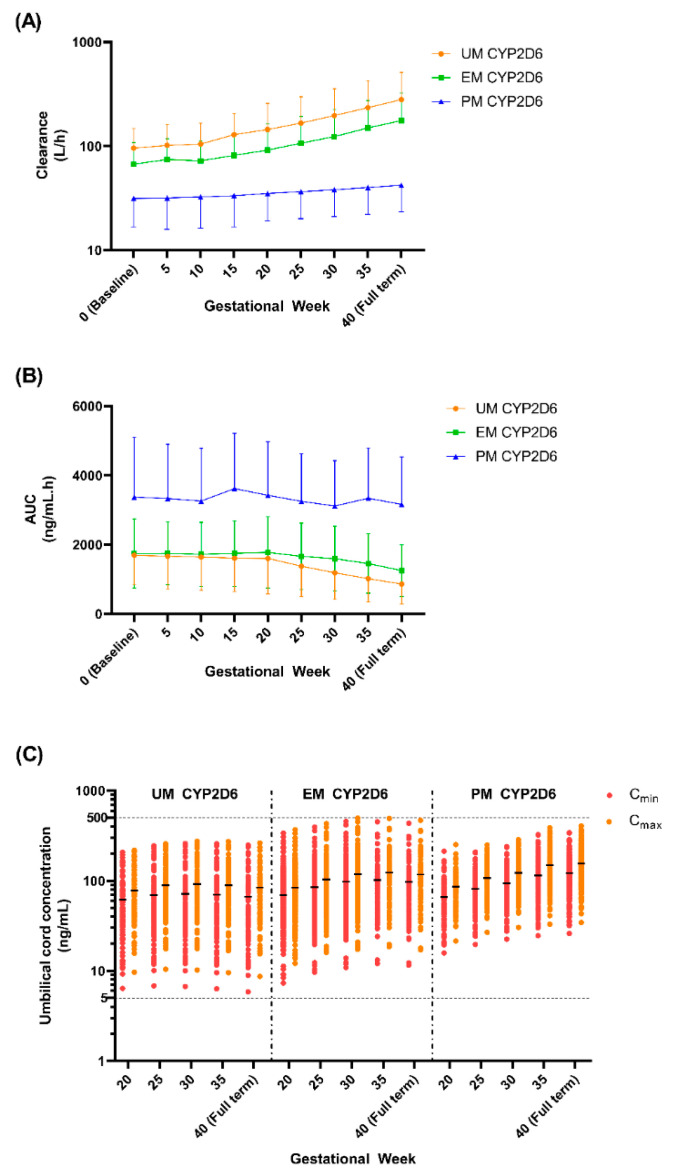
Fluvoxamine plasma concentrations have been shown to decrease throughout pregnancy. CYP2D6 polymorphisms significantly influence these changes. However, knowledge of an optimum dose adjustment according to the CYP2D6 phenotype is still limited. This study implemented a physiologically based pharmacokinetic modelling approach to assess the gestational changes in fluvoxamine maternal and umbilical cord concentrations. The optimal dosing strategies during pregnancy were simulated, and the impact of CYP2D6 phenotypes on fluvoxamine maternal and fetal concentrations was considered. A significant decrease in fluvoxamine maternal plasma concentrations was noted during gestation. As for the fetal concentration, a substantial increase was noted for the poor metabolisers (PM), with a constant level in the ultrarapid (UM) and extensive (EM) metabolisers commencing from gestation week 20 to term. The optimum dosing regimen suggested for UM and EM reached a maximum dose of 300 mg daily at gestational weeks (GW) 15 and 35, respectively. In contrast, a stable dose of 100 mg daily throughout gestation for the PM is sufficient to maintain the fluvoxamine plasma concentration within the therapeutic window (60-230 ng/mL). Dose adjustment during pregnancy is required for fluvoxamine, particularly for UM and EM, to maintain efficacy throughout the gestational period.

Keywords: depression; fetal; fluvoxamine; pharmacokinetics; pregnancy.


Conflict of interest statement

The authors declare no conflict of interest.

Figures

Figure 1
Figure 1
A 4-step workflow for fluvoxamine gestational model’s development.
Figure 2
Figure 2
Comparison between simulated trial and observed data for (A) Cmax and (B) AUCinf from De Vries et al. [39]. Coloured data points arranged vertically represent the predicted and observed data for each dose; horizontal lines on the coloured data points represent the mean and standard deviation (SD). * p < 0.05.
Figure 3
Figure 3
Single-dose studies simulated through model development. (A) Single-dose 25 mg; (B) Single-dose 50 mg; (C) Single-dose 100 mg. Solid lines represent the mean predicted concentration-time profile, with dotted lines representing the 5th and 95th percentile ranges. Solid circles represent observed clinical data from each study. Van Harten et al. (1991)a represents the 50 mg fed study [40]; Van Harten et al. (1991)b represents the 50 mg fast study [40]. Bahrami and Mohammadi (2007)a represents the 100 mg test formulation study [41]; Bahrami and Mohammadi (2007)b represents the 100 mg reference formulation study [41].
Figure 4
Figure 4
Single-dose studies simulated in model validation stage. (A) Single-dose 50 mg [44]; (B) Single-dose 100 mg [45,46]. Solid lines represent the mean predicted concentration-time profile, with dotted lines representing the 5th and 95th percentile ranges. Solid circles represent observed clinical data from each study.
Figure 5
Figure 5
Multiple-dose studies simulated in model development and validation. (A) Multiple-dose 50 mg twice daily from day 4 to day 31 [42]; (B) multiple-dose 50 mg daily for 3 days followed by 100 mg daily for 7 days [43]; (C) multiple-dose 12.5 mg twice daily for week 1, 25 mg twice daily for week 2, 50 mg twice daily for week 3, and 100 mg twice daily for week 4 [47]; (D) multiple-dose 100 mg daily for 10 days [46]. Solid lines represent the mean predicted concentration-time profile, with dotted lines representing the 5th and 95th percentile ranges. Solid circles represent observed clinical data from each study, with error bars indicating SD. USFDA (2008)a represents a bioavailability study with prototype D [46]; USFDA (2008)b represents a bioavailability study with prototype C [46].
Figure 6
Figure 6
Simulated single-dose studies in model validation for CYP2D6 phenotype. (A) Single-dose 50 mg in EM CYP2D6 population [48,49,50,51]; (B) single-dose 50 mg in PM CYP2D6 population [48,49,50]; (C) single-dose 25 mg in PM CYP2D6 population [51]; solid lines represent the mean predicted concentration-time profile, with dotted lines representing the 5th and 95th percentile ranges. Solid circles represent observed clinical data from each study, with error bars indicating SD.
Figure 7
Figure 7
Predicted maximum concentration and steady-state concentration for single-dose and multiple-dose studies. (A) EM CYP2D6 phenotype population; (B) PM CYP2D6 phenotype population; solid circles arranged vertically represent the predicted values for each dose. Horizontal lines on the coloured data points represent the mean and SD. Red, open circles represent the observed individual data from Christensen et al. [51]. Cmax, maximum concentration for single-dose; Css, average trough concentration at steady-state for Day 6 and Day 7.
Figure 8
Figure 8
Predicted steady-state Cmin fluvoxamine maternal concentration. Green, open circles represent the post-dose trough concentration sampled at 24 h post-dose and assembled every 5 GWs throughout the maternity period. Red, open circles represent reported plasma concentrations collected from 3 pregnant women from Westin et al. [18]. ‘0’ refers to the baseline predicted in the non-pregnant female population. The grey shaded region represents the fluvoxamine therapeutic window (TW).
Figure 9
Figure 9
Simulated fluvoxamine foetal (umbilical cord) concentrations. Doses were administered to steady-state with sampling on the final 30-h period of GW 40. Solid circles represent individual predicted cord concentrations. Coloured open circles represent the observed umbilical cord concentrations from Hostetter et al. [56], Sit et al. [57] and Rampono et al. [58],. Horizontal lines on the coloured data points represent the mean and SD.
Figure 10
Figure 10
Simulated fluvoxamine maternal concentrations in CYP2D6 phenotype population. (A) 50 mg daily; (B) 100 mg daily; (C) 300 mg daily. Coloured solid circles represent individual, predicted maternal concentrations. Cmax, maximum concentration; Cmin, minimum concentration. Horizontal lines on the coloured solid circles represent mean and standard deviations. The shaded region represents the fluvoxamine TW. Comparison between each CYP2D6 phenotype for every 5 GWs showed statistically significant difference except between UM and EM at GW labelled as ‘ns’, p > 0.05.
Figure 11
Figure 11
Simulated fluvoxamine umbilical cord concentrations in CYP2D6 phenotype population. (A) 50 mg daily; (B) 100 mg daily; (C) 300 mg daily. Coloured solid circles represent individual, predicted umbilical cord concentrations. Cmax, maximum concentration; Cmin, minimum concentration. Horizontal lines on the coloured solid circles represent mean and standard deviations. Comparing each CYP2D6 phenotype for every 5 GWs starting from GW 20 showed a statistically significant difference when compared with PM and a non-statistically significant difference between UM and EM at GW 25 for 300 mg daily—labelled as ‘*’; p < 0.05.
Figure 12
Figure 12
Predicted clearance, area-under-the-curve, and cord concentration based on the recommended doses. (A) Clearance; (B) area-under-the-curve; (C) umbilical cord concentration. Top and bottom horizontal lines in (A,B) represent standard deviations. Coloured, closed circles in (C) are the predicted individual cord concentrations. Horizontal lines on the coloured, solid circles in (C) represent the mean. Dashed horizontal lines in (C) represent the range of simulated cord concentrations throughout gestational periods and all three CYP2D6 phenotypes (5 ng/mL to 500 ng/mL).

Similar articles

Cited by

References

    1. Gaynes B.N., Gavin N., Meltzer-Brody S., Lohr K.N., Swinson T., Gartlehner G., Brody S., Miller W.C. Perinatal depression: Prevalence, screening accuracy, and screening outcomes. Evid. Rep. Technol. Assess (Summ) 2005:1–8. doi: 10.1037/e439372005-001. - DOI - PMC - PubMed
    1. Okagbue H.I., Adamu P.I., Bishop S.A., Oguntunde P.E., Opanuga A.A., Akhmetshin E.M. Systematic review of prevalence of antepartum depression during the trimesters of pregnancy. Open Access Maced. J. Med. Sci. 2019;7:1555–1560. doi: 10.3889/oamjms.2019.270. - DOI - PMC - PubMed
    1. Bennett H.A., Einarson A., Taddio A., Koren G., Einarson T.R. Prevalence of depression during pregnancy: Systematic review. Obstet. Gynecol. 2004;103:698–709. doi: 10.1097/01.AOG.0000116689.75396.5f. - DOI - PubMed
    1. Wichman C.L., Stern T.A. Diagnosing and treating depression during pregnancy. Prim. Care Companion CNS Disord. 2015;17 doi: 10.4088/PCC.15f01776. - DOI - PMC - PubMed
    1. Hiemke C., Bergemann N., Clement H.W., Conca A., Deckert J., Domschke K., Eckermann G., Egberts K., Gerlach M., Greiner C., et al. Consensus guidelines for therapeutic drug monitoring in neuropsychopharmacology: Update 2017. Pharmacopsychiatry. 2018;51:e1. doi: 10.1055/s-0037-1600991. - DOI - PubMed