

Comparative Proteomic Analysis of an Ethyl Tert-Butyl Ether-Degrading Bacterial Consortium
- PMID: 36557584
- PMCID: PMC9781318
- DOI: 10.3390/microorganisms10122331
Comparative Proteomic Analysis of an Ethyl Tert-Butyl Ether-Degrading Bacterial Consortium
Abstract
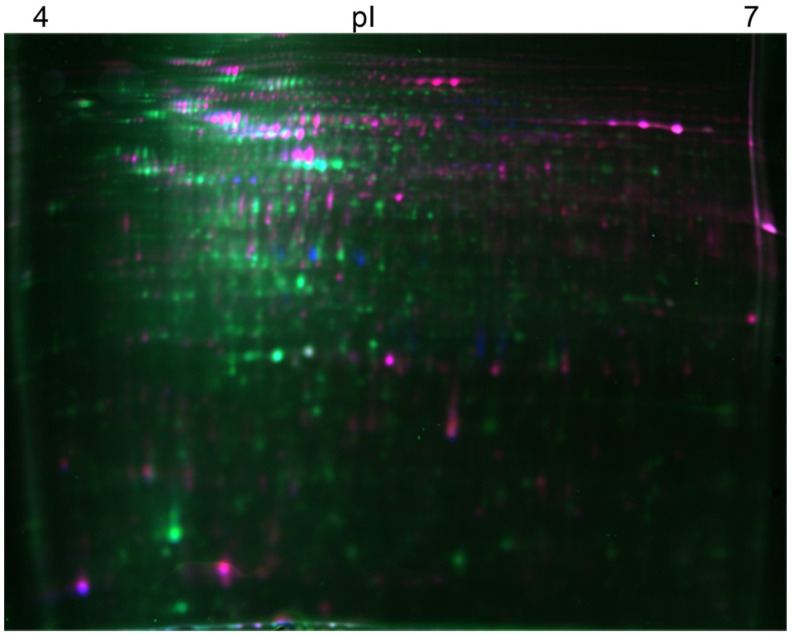
A bacterial consortium capable of degrading ethyl tert-butyl ether (ETBE) as a sole carbon source was enriched and isolated from gasoline-contaminated water. Arthrobacter sp., Herbaspirillum sp., Pseudacidovorax sp., Pseudomonas sp., and Xanthomonas sp. were identified as the initial populations with the 16S rDNA analysis. The consortium aerobically degraded 49% of 50 mg/L of ETBE, in 6 days. The ETBE degrading efficiency of the consortium increased to 98% even with the higher concentrations of ETBE (1000 mg/L) in the subsequent subcultures, which accumulated tert-butyl alcohol (TBA). Xanthomonas sp. and Pseudomonas sp. were identified as the predominant ETBE degrading populations in the final subculture. The metaproteome of the ETBE-grown bacterial consortium was compared with the glucose-grown bacterial consortium, using 2D-DIGE. Proteins related to the ETBE metabolism, stress response, carbon metabolism and chaperones were found to be abundant in the presence of ETBE while proteins related to cell division were less abundant. The metaproteomic study revealed that the ETBE does have an effect on the metabolism of the bacterial consortium. It also enabled us to understand the responses of the complex bacterial consortium to ETBE, thus revealing interesting facts about the ETBE degrading bacterial community.
Keywords: 2D-DIGE; ETBE; bacterial consortium; biodegradation; metaproteome.
Conflict of interest statement
All the authors state that they have no conflict of interest.
Figures

 Control;
  B consortium-EB3;
  bacterial growth (OD at 600 nm). The error bars represent the standard deviation between the replicates (n = 2).


Similar articles
-
Aerobic degradation of ethyl-tert-butyl ether by a microbial consortium: selection and evaluation of biodegradation ability.Environ Toxicol Chem. 2002 Oct;21(10):2052-8. Environ Toxicol Chem. 2002. PMID: 12371480
-
Ethyl tert-butyl ether (ETBE) biodegradation by a syntrophic association of Rhodococcus sp. IFP 2042 and Bradyrhizobium sp. IFP 2049 isolated from a polluted aquifer.Appl Microbiol Biotechnol. 2013 Dec;97(24):10531-9. doi: 10.1007/s00253-013-4803-3. Epub 2013 Mar 10. Appl Microbiol Biotechnol. 2013. PMID: 23474617
-
Ethyl tert-butyl ether (ETBE)-degrading microbial communities in enrichments from polluted environments.J Hazard Mater. 2014 Aug 30;279:502-10. doi: 10.1016/j.jhazmat.2014.07.013. Epub 2014 Jul 16. J Hazard Mater. 2014. PMID: 25108826
-
Potential of stable isotope analysis to deduce anaerobic biodegradation of ethyl tert-butyl ether (ETBE) and tert-butyl alcohol (TBA) in groundwater: a review.Environ Sci Pollut Res Int. 2024 Mar;31(11):16150-16163. doi: 10.1007/s11356-024-32109-3. Epub 2024 Feb 6. Environ Sci Pollut Res Int. 2024. PMID: 38319419 Free PMC article. Review.
-
Biodegradation and fate of ethyl tert-butyl ether (ETBE) in soil and groundwater: A review.J Hazard Mater. 2020 Jun 5;391:122046. doi: 10.1016/j.jhazmat.2020.122046. Epub 2020 Jan 24. J Hazard Mater. 2020. PMID: 32145642 Review.
Cited by
-
A bibliometric analysis of the global impact of metaproteomics research.Front Microbiol. 2023 Jul 5;14:1217727. doi: 10.3389/fmicb.2023.1217727. eCollection 2023. Front Microbiol. 2023. PMID: 37476667 Free PMC article.
References
-
- Barceló D., Arvin E. Fuel Oxygenates. Springer; Berlin/Heidelberg, Germany: 2007.
-
- Kian F.Y., Abdul R.M., Soon H.T. A review on the evolution of ethyl tert-butyl ether (ETBE) and its future prospects. Renew. Sustain. Energy Rev. 2013;22:604–620.
-
- Squillace P.J., Zogorski J.S., Wilber W.G., Price C.V. Preliminary Assessment of the Occurrence and Possible Sources of MTBE in Groundwater in the United States. 1993−1994. Environ. Sci. Technol. 1996;30:1721–1730. doi: 10.1021/es9507170. - DOI
Grants and funding
LinkOut - more resources
Full Text Sources
Molecular Biology Databases
