. 2022 Nov 30;10(12):2366.
doi: 10.3390/microorganisms10122366.

The Spatial Organization of Bacterial Transcriptional Regulatory Networks

Affiliations

The Spatial Organization of Bacterial Transcriptional Regulatory Networks

Liu Tian et al. Microorganisms. .

Abstract

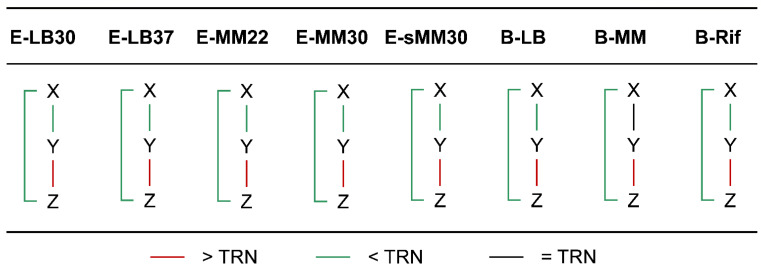
The transcriptional regulatory network (TRN) is the central pivot of a prokaryotic organism to receive, process and respond to internal and external environmental information. However, little is known about its spatial organization so far. In recent years, chromatin interaction data of bacteria such as Escherichia coli and Bacillus subtilis have been published, making it possible to study the spatial organization of bacterial transcriptional regulatory networks. By combining TRNs and chromatin interaction data of E. coli and B. subtilis, we explored the spatial organization characteristics of bacterial TRNs in many aspects such as regulation directions (positive and negative), central nodes (hubs, bottlenecks), hierarchical levels (top, middle, bottom) and network motifs (feed-forward loops and single input modules) of the TRNs and found that the bacterial TRNs have a variety of stable spatial organization features under different physiological conditions that may be closely related with biological functions. Our findings provided new insights into the connection between transcriptional regulation and the spatial organization of chromosome in bacteria and might serve as a factual foundation for trying spatial-distance-based gene circuit design in synthetic biology.

Keywords: 3D genome; bacterial chromatin; network hierarchy; network motif; spatial effect.


Conflict of interest statement

The authors declare no conflict of interest.

Figures

Figure 1
Figure 1
Comparison of chromatin interaction frequency in global TRN. Under almost all culture conditions, the chromatin interaction frequency within TRN (denoted as TRN) is significantly higher than that of all the gene pairs in the whole genome (denoted as All); the interaction frequency of positive regulation (denoted as P) is significantly lower than TRN; the interaction frequency of negative regulation (denoted as N) is significantly higher than TRN. The symbols on the figure indicate statistical significance levels: ns: p > 0.05; *: p ≤ 0.05; **: p ≤ 0.01; ***: p ≤ 0.001; ****: p ≤ 0.0001.
Figure 2
Figure 2
The spatial organization of the TRN hierarchy. The four spheres T, M, B, and TG represent top, middle, bottom and target layers in the hierarchy, respectively. The numbers on the edges represent the numbers of regulatory relationships within or between layers. The color of edge represents the comparison result of the chromatin interaction frequency of the edge with the TRN. Significance level: p < 0.05.
Figure 3
Figure 3
Comparison of chromatin interaction frequencies in network motifs with TRN. Under the five culture conditions of E. coli, the chromatin interaction frequency of FFL is significantly higher than that of TRN and that of SIM is of no significant difference from TRN. In B. subtilis, the chromatin interaction frequencies of both kinds of network motifs are significantly higher than that of TRN. The symbols on the figure indicate statistical significance levels: ns: p > 0.05; **: p ≤ 0.01; ***: p ≤ 0.001; ****: p ≤ 0.0001.
Figure 4
Figure 4
Comparison of chromatin interaction frequencies of FFL edges with TRN. In almost all cases, the chromatin interaction frequency between X and Y/Z in the feed-forward loop is significantly lower than TRN, while the interaction frequency between Y and Z is significantly higher than TRN. Significance level: p < 0.05.
Figure 5
Figure 5
The distribution of standard deviation (SD) of chromatin interaction frequency within SIMs (violin plot) and its comparison with that of TRN (red dashed line). The SD of chromatin interaction frequency within SIMs is clearly lower than that of TRN, indicating lower dispersion and higher uniformity of chromatin interaction within SIMs.
Figure 6
Figure 6
The distribution of high-level regulatory genes in the 3D architecture of bacterial chromosomes. In the 3D models of E. coli and B. subtilis chromosomes, the genes of the top (orange) and middle (blue) layers in the TRN hierarchy are shown as spheres, and the bigger red balls indicate the positions of oriC loci. The E. coli chromosome resembles a letter C, and the top-layer genes (orange) are mainly distributed at both ends of the letter C. The B. subtilis chromosome is spiral-shaped, and the top-layer genes (orange) are mainly distributed in the middle and one end of the spiral. The middle-layer genes (blue) seem evenly distributed in the 3D architecture.
Figure 7
Figure 7
Dynamic behaviors affected by the spatial organization of FFL and SIM. (A). For FFL-1 (grey edges), suppose DX_Y1 = DX_Z1 = 2√2, DY1_Z1 = 4; for FFL-2 (yellow edges), suppose DX_Y2 = 2√5, DX_Z2 = 3√2, DY2_Z2 = √2 (see Table S5 for the coordinates of X, Y1, Z1, Y2, Y2). FFL-1 responds to both signals, while FFL-2 just responds to the longer one, which means different spatial distributions of genes in FFL can affect dynamic function. (B). In SIM-1 (grey edges), the distances between the three child nodes (S1, S2, S3) and the parent node P are assumed to be identical, and the three child nodes can be regulated in a correct time order. In SIM-2 (yellow edges), the distances between the child nodes and the parent node are randomly arranged, and the original time order disappears. This result indicates that the spatial distribution of genes in SIM can affect dynamic function. Time could have arbitrary unit because it is just for conceptual illustration.

Similar articles

Cited by

References

    1. Balleza E., Lopez-Bojorquez L.N., Martinez-Antonio A., Resendis-Antonio O., Lozada-Chavez I., Balderas-Martinez Y.I., Encarnacion S., Collado-Vides J. Regulation by transcription factors in bacteria: Beyond description. FEMS Microbiol. Rev. 2009;33:133–151. doi: 10.1111/j.1574-6976.2008.00145.x. - DOI - PMC - PubMed
    1. Seshasayee A.S., Bertone P., Fraser G.M., Luscombe N.M. Transcriptional regulatory networks in bacteria: From input signals to output responses. Curr. Opin. Microbiol. 2006;9:511–519. doi: 10.1016/j.mib.2006.08.007. - DOI - PubMed
    1. Mejia-Almonte C., Busby S.J.W., Wade J.T., van Helden J., Arkin A.P., Stormo G.D., Eilbeck K., Palsson B.O., Galagan J.E., Collado-Vides J. Redefining fundamental concepts of transcription initiation in bacteria. Nat. Rev. Genet. 2020;21:699–714. doi: 10.1038/s41576-020-0254-8. - DOI - PMC - PubMed
    1. Madan Babu M., Teichmann S.A., Aravind L. Evolutionary dynamics of prokaryotic transcriptional regulatory networks. J. Mol. Biol. 2006;358:614–633. doi: 10.1016/j.jmb.2006.02.019. - DOI - PubMed
    1. Bhardwaj N., Kim P.M., Gerstein M.B. Rewiring of transcriptional regulatory networks: Hierarchy, rather than connectivity, better reflects the importance of regulators. Sci. Signal. 2010;3:ra79. doi: 10.1126/scisignal.2001014. - DOI - PubMed

LinkOut - more resources