

Species-Specific Duplication of Surface Antigen Genes in Paramecium
- PMID: 36557632
- PMCID: PMC9788069
- DOI: 10.3390/microorganisms10122378
Species-Specific Duplication of Surface Antigen Genes in Paramecium
Abstract
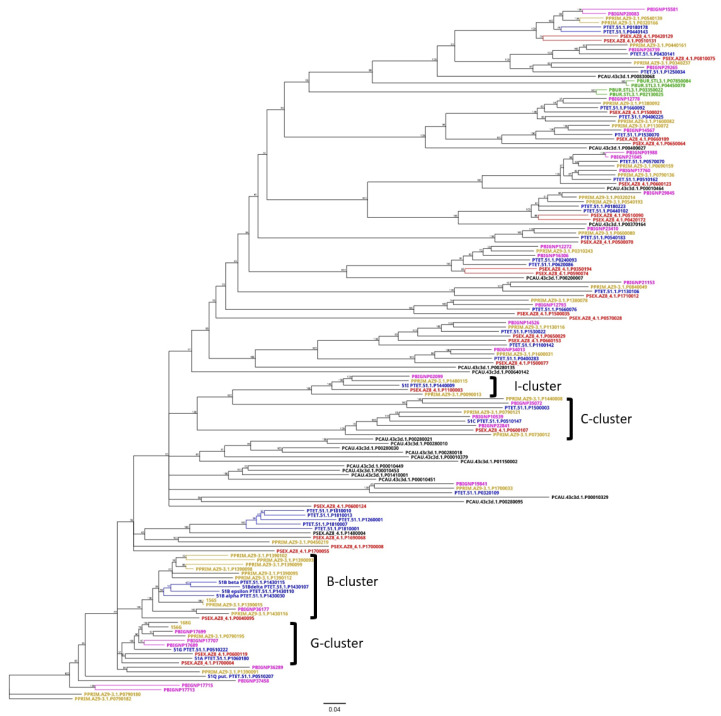
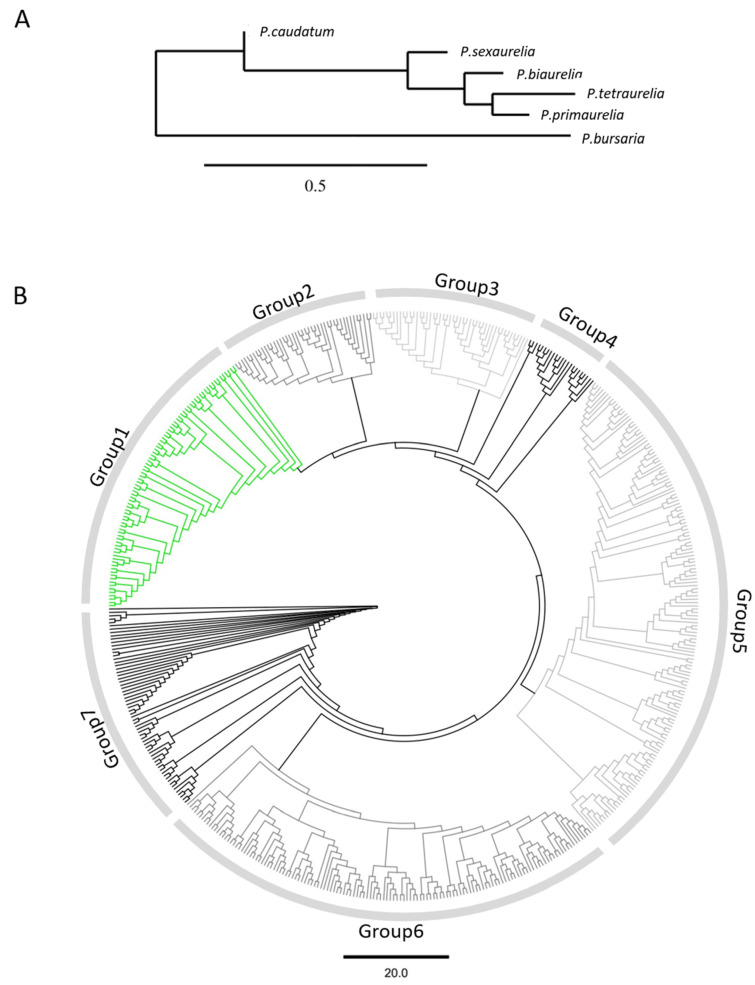
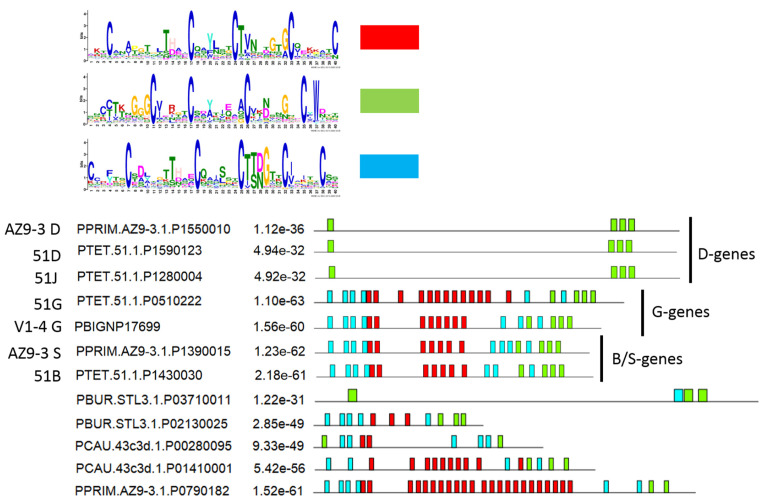
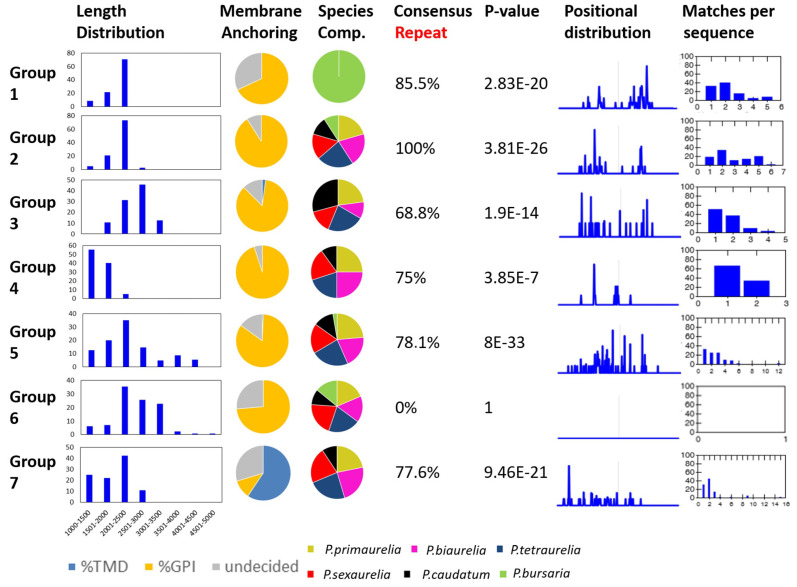
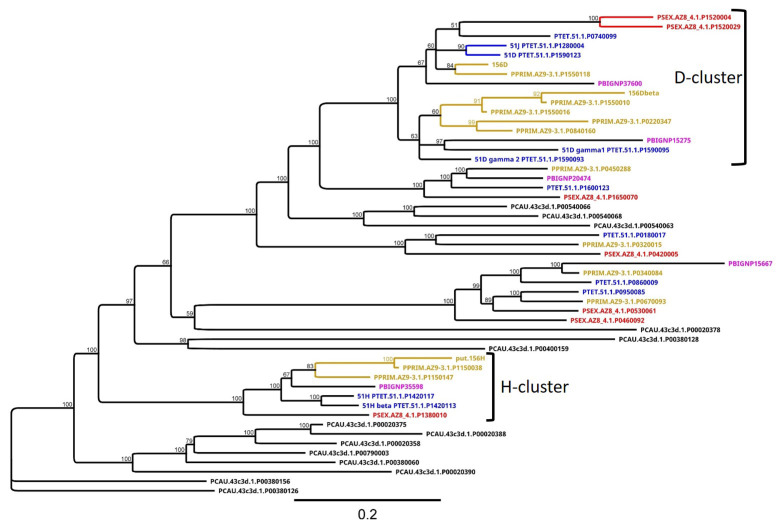
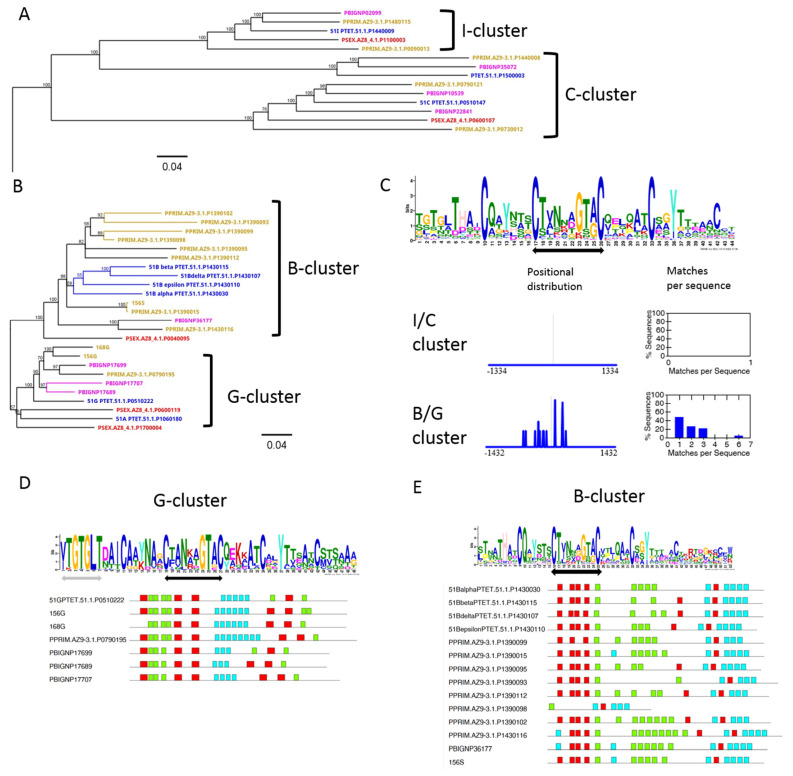
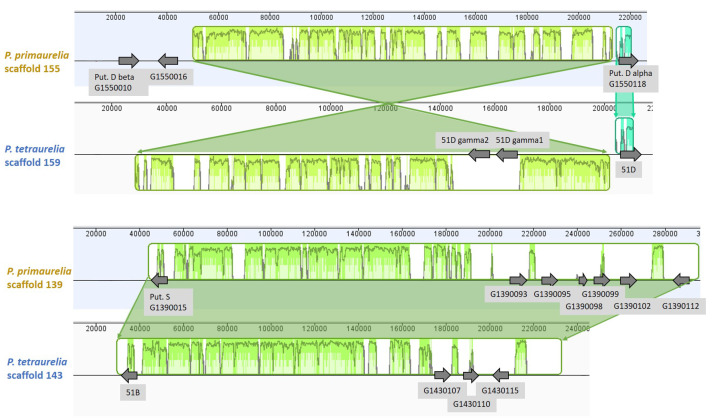
Paramecium is a free-living ciliate that undergoes antigenic variation and still the functions of these variable surface antigen coats in this non-pathogenic ciliate remain elusive. Only a few surface antigen genes have been described, mainly in the two model species P. tetraurelia strain 51 and P. primaurelia strain 156. Given the lack of suitable sequence data to allow for phylogenetics and deeper sequence comparisons, we screened the genomes of six different Paramecium species for serotype genes and isolated 548 candidates. Our approach identified the subfamilies of the isogenes of individual serotypes that were mostly represented by intrachromosomal gene duplicates. These showed different duplication levels, and chromosome synteny suggested rather young duplication events after the emergence of the P. aurelia species complex, indicating a rapid evolution of surface antigen genes. We were able to identify the different subfamilies of the surface antigen genes with internal tandem repeats, which showed consensus motifs across species. The individual isogene families showed additional consensus motifs, indicating that the selection pressure holds individual amino acids constant in these repeats. This may be a hint of the receptor function of these antigens rather than a presentation of random epitopes, generating the variability of these surface molecules.
Keywords: Paramecium; antigenic variation; multigene family; surface antigen.
Conflict of interest statement
The authors declare no conflict of interest.
Figures
Similar articles
-
Genomic characterization of variable surface antigens reveals a telomere position effect as a prerequisite for RNA interference-mediated silencing in Paramecium tetraurelia.mBio. 2014 Nov 11;5(6):e01328. doi: 10.1128/mBio.01328-14. mBio. 2014. PMID: 25389173 Free PMC article.
-
Variety of serotypes of Paramecium primaurelia: single epitopes are responsible for immunological differentiation.J Eukaryot Microbiol. 2005 Jul-Aug;52(4):319-27. doi: 10.1111/j.1550-7408.2005.00040.x. J Eukaryot Microbiol. 2005. PMID: 16014009
-
The actin multigene family of Paramecium tetraurelia.BMC Genomics. 2007 Mar 28;8:82. doi: 10.1186/1471-2164-8-82. BMC Genomics. 2007. PMID: 17391512 Free PMC article.
-
Antigenic variation in ciliates: antigen structure, function, expression.J Eukaryot Microbiol. 2007 Jan-Feb;54(1):1-7. doi: 10.1111/j.1550-7408.2006.00226.x. J Eukaryot Microbiol. 2007. PMID: 17300509 Review.
-
Paramecium Genetics, Genomics, and Evolution.Annu Rev Genet. 2023 Nov 27;57:391-410. doi: 10.1146/annurev-genet-071819-104035. Annu Rev Genet. 2023. PMID: 38012024 Free PMC article. Review.
Cited by
-
A Review for the Special Issue on Paramecium as a Modern Model Organism.Microorganisms. 2023 Apr 3;11(4):937. doi: 10.3390/microorganisms11040937. Microorganisms. 2023. PMID: 37110360 Free PMC article. Review.
-
Infection with the Endonuclear Symbiotic Bacterium Holospora obtusa Reversibly Alters Surface Antigen Expression of the Host Paramecium caudatum.Microorganisms. 2025 Apr 25;13(5):991. doi: 10.3390/microorganisms13050991. Microorganisms. 2025. PMID: 40431163 Free PMC article.
-
A droplet digital PCR assay to measure pilin antigenic variation frequency in Neisseria gonorrhoeae.mSphere. 2025 May 27;10(5):e0009425. doi: 10.1128/msphere.00094-25. Epub 2025 Apr 23. mSphere. 2025. PMID: 40265899 Free PMC article.
References
-
- Kaviratne M., Fernandez V., Jarra W., Cunningham D., Galinski M.R., Wahlgren M., Preiser P.R. Antigenic Variation. Elsevier; Amsterdam, The Netherlands: 2003. Antigenic variation in Plasmodium falciparum and other Plasmodium species; pp. 291–318.
-
- Avril M., Tripathi A.K., Brazier A.J., Andisi C., Janes J.H., Soma V.L., Sullivan D.J., Jr., Bull P.C., Stins M.F., Smith J.D. A restricted subset of var genes mediates adherence of Plasmodium falciparum-infected erythrocytes to brain endothelial cells. Proc. Natl. Acad. Sci. USA. 2012;109:E1782–E1790. doi: 10.1073/pnas.1120534109. - DOI - PMC - PubMed
LinkOut - more resources
Full Text Sources
