. 2022 Dec 16;14(24):5365.
doi: 10.3390/nu14245365.

Modeling Obesity-Associated Ovarian Dysfunction in Drosophila

Affiliations

Modeling Obesity-Associated Ovarian Dysfunction in Drosophila

Huanju Liu et al. Nutrients. .

Abstract

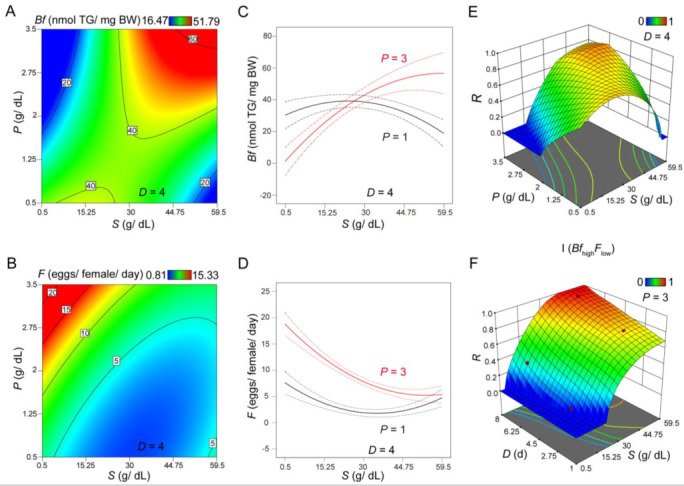
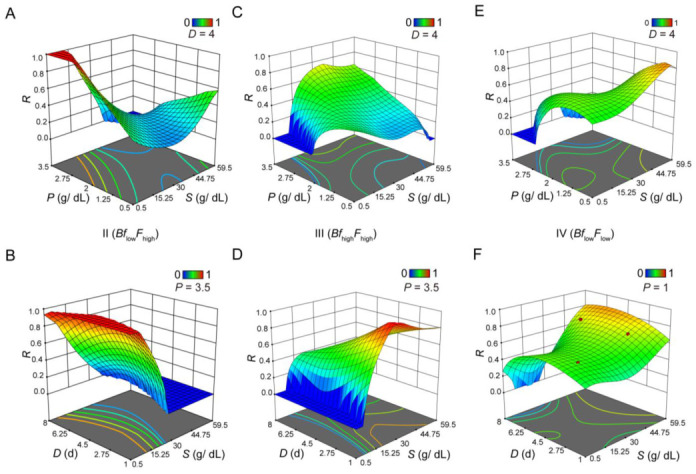
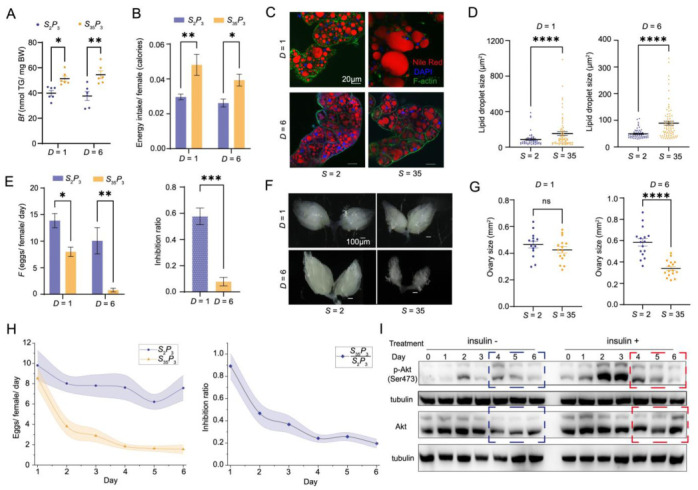
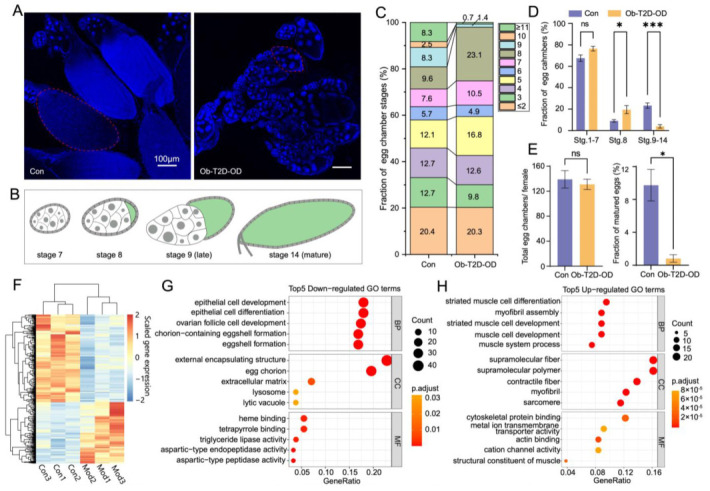
We perform quantitative studies to investigate the effect of high-calorie diet on Drosophila oogenesis. We use the central composite design (CCD) method to obtain quadratic regression models of body fat and fertility as a function of the concentrations of protein and sucrose, two major macronutrients in Drosophila diet, and treatment duration. Our results reveal complex interactions between sucrose and protein in impacting body fat and fertility when they are considered as an integrated physiological response. We verify the utility of our quantitative modeling approach by experimentally confirming the physiological responses-including increased body fat, reduced fertility, and ovarian insulin insensitivity-expected of a treatment condition identified by our modeling method. Under this treatment condition, we uncover a Drosophila oogenesis phenotype that exhibits an accumulation of immature oocytes and a halt in the production of mature oocytes, a phenotype that bears resemblance to key aspects of the human condition of polycystic ovary syndrome (PCOS). Our analysis of the dynamic progression of different aspects of diet-induced pathophysiology also suggests an order of the onset timing for obesity, ovarian dysfunction, and insulin resistance. Thus, our study documents the utility of quantitative modeling approaches toward understanding the biology of Drosophila female reproduction, in relation to diet-induced obesity and type II diabetes, serving as a potential disease model for human ovarian dysfunction.

Keywords: Drosophila; animal model; central composite design; insulin resistance; obesity; ovarian dysfunction.


Conflict of interest statement

The authors declare no competing interests.

Figures

Figure 1
Figure 1
Characterization of Bf and F under various feeding treatment. (A,B) Contour plots of Bf (A) or F (B) at D = 4. The X-axis represents S, Y-axis represents P, and the color represents levels of Bf (A) or F (B). (C,D) Interaction plots of S and P on Bf (C) or F (D) at D = 4. The X-axis represents S; Y-axis represents Bf (C) or F (D). The two lines show the response of Bf (C) or F (D) to S at different levels of P. Dashed lines represent 95% confidence intervals. (E,F) Integrated 3D surface plots under Scenario I, showing R as a function of S-P (E) or S-D (F), respectively. Here, a high value of R represents a high desirability for achieving BfhighFlow. D = 4 in panel E and P = 3 in panel F.
Figure 2
Figure 2
Integration analysis of Bf and F with different phenotype preference. Shown are integrated 3D surface plots showing R as a function of S-P (A,C,E) or S-D (B,D,F) under three different scenarios (AB for Scenario II, CD for Scenario III, and DF for Scenario IV). A high R value indicates a high desirability for the given scenario. For each panel, values for D or P are indicated.
Figure 3
Figure 3
Phenotype verification under the selected treatment conditions. (A) Bf measurement under the four indicated conditions (ANOVA), * p < 0.05, ** p < 0.01. (B) Calorie intake calculation from feeding quantification with the dye assay under four indicated conditions (ANOVA), * p < 0.05, ** p < 0.01. (C) Nile red staining of lipid droplets in the fat body under S2P3D1, S35P3D1, S2P3D6, S35P3D6. F-actin stained with phalloidin was in green, nucleus stained with DAPI was in blue. Scale bars: 20 μm. (D) Measurements and statistical analysis of lipid droplet size under the four indicated conditions (t-test), **** p < 10−4. (E) F measurement under four conditions (ANOVA). The inhibition ratio of high sucrose on F was calculated by the number of eggs produced under S35P3 divided by that under S2P3 (t-test), * p < 0.05, ** p < 0.01, *** p < 10−3. (F) Comparison of whole ovarian morphology under four conditions. Scale bars: 100 μm. (G) Measurement and statistical analysis of ovarian size under four conditions (t-test), **** p < 10−4. (H) Continued egg production from day 1 to day 6 on the indicated diet. The inhibition ratio as a function of treatment time under high sucrose diet. See Materials and Methods for further details. (I) Shown are Western blotting results detecting p-Akt, Akt, and tubulin of the ovary (D = 0 to D = 6), with or without the addition of human insulin to the dissected ovaries. Insulin sensitivity was calculated as the ratio of detected protein levels, p-Akt/Akt. Protein levels were normalized to that of tubulin.
Figure 4
Figure 4
Halted oogenesis and molecular defects in the Ob-T2D-OD Drosophila model. (A) Confocal microscopy imaging visualizing egg chambers from control (Con) and Ob-T2D-OD females. Imaging under 405 nm and 100× with scale bars: 100 μm. The circled areas provide examples of egg chambers at stage 14 (Con) or stage 8 (Ob-T2D-OD). (B) Schematic illustration of egg chambers at the stages shown. Morphological difference is readily recognizable based on egg chamber size and the presence of follicle cell nuclei surrounding the anterior nurse cells. (C) Percentages of egg chambers at different stages from the ovaries of a representative control or Ob-T2D-OD female with a stacked bar chart. (D) Statistical analysis of stage comparations in the Con and Ob-T2D-OD (ANOVA), * p < 0.05, *** p < 10−3. (E) Statistical analysis of total egg chamber numbers and fractions of stage 14 in the Con and Ob-T2D-OD females (t-test), * p < 0.05. (F) Hierarchical clustering of genes that were significantly differentially expressed (|log2FoldChange| > 0.5 and p-value < 0.05) in ovaries between the control group (S2P3D6) and the Ob-T2D-OD model group (S35P3D6). Each group consists of three independent replicates. (G,H) GO enrichment analysis of genes that were significantly down-regulated (n = 253) and up-regulated (n = 177) under S35P3D6. Shown are the top 5 terms with the smallest Benjamini-Hochberg adjusted p-values under each category of Biological Process (BP), Cellular Component (CC), and Molecular Function (MF).

Similar articles

Cited by

References

    1. Ma J., He F., Xie G., Deng W. Maternal AP determinants in the Drosophila oocyte and embryo. Wiley Interdiscip. Rev. Dev. Biol. 2016;5:562–581. doi: 10.1002/wdev.235. - DOI - PubMed
    1. Sieber M.H., Spradling A.C. The role of metabolic states in development and disease. Curr. Opin. Genet. Dev. 2017;45:58–68. doi: 10.1016/j.gde.2017.03.002. - DOI - PMC - PubMed
    1. Arhin S.K., Lu J., Xi H., Jin X. Energy requirements in mammalian oogenesis. Cell. Mol. Biol. 2018;64:12–19. doi: 10.14715/cmb/2018.64.10.3. - DOI - PubMed
    1. Celik E., Olson E., Titi E.S. Spectral Filtering of Interpolant Observables for a Discrete-in-Time Downscaling Data Assimilation Algorithm. SIAM J. Appl. Dyn. Syst. 2019;18:1118–1142. doi: 10.1137/18M1218480. - DOI
    1. Roth S. Drosophila oogenesis: Coordinating germ line and soma. Curr. Biol. 2001;11:R779–R781. doi: 10.1016/S0960-9822(01)00469-9. - DOI - PubMed

LinkOut - more resources