. 2022 Nov 29;11(12):1436.
doi: 10.3390/pathogens11121436.

[PRION+] States Are Associated with Specific Histone H3 Post-Translational Modification Changes

Affiliations

[PRION+] States Are Associated with Specific Histone H3 Post-Translational Modification Changes

Samantha N Cobos et al. Pathogens. .

Abstract

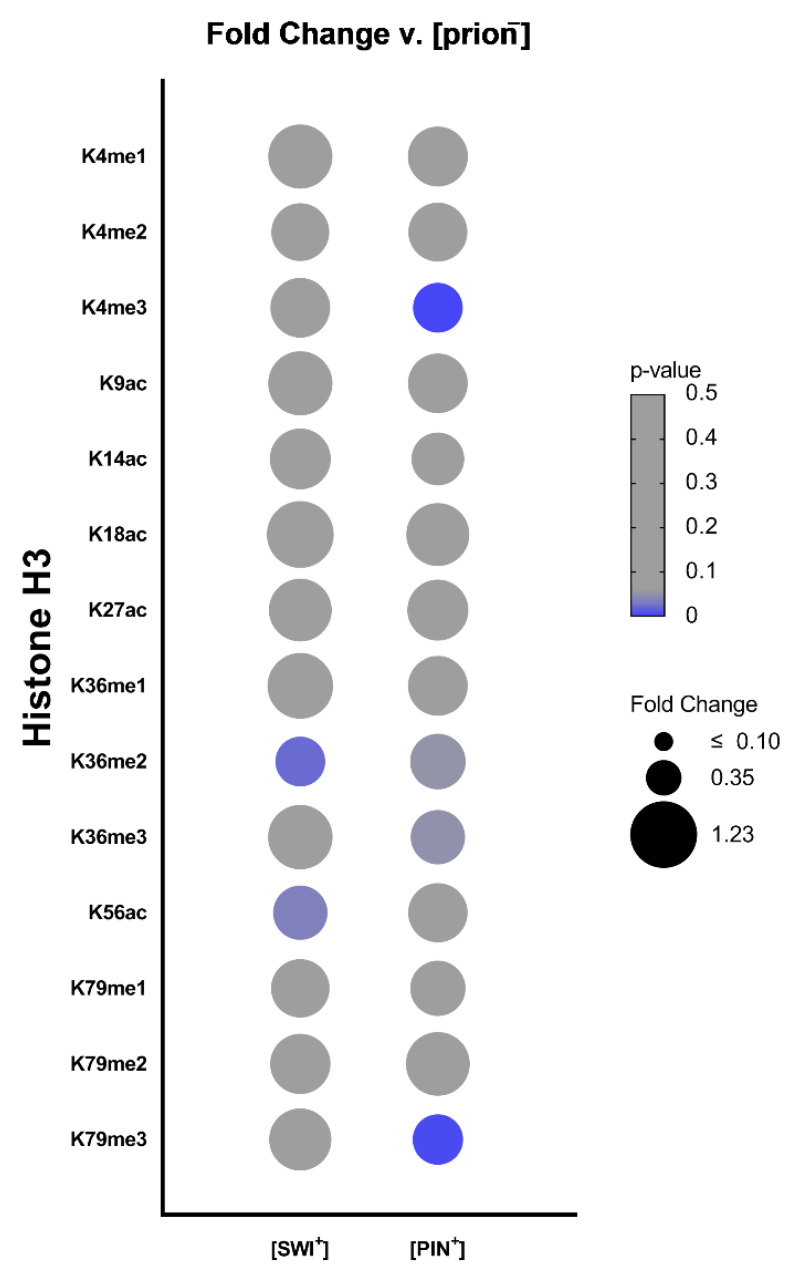
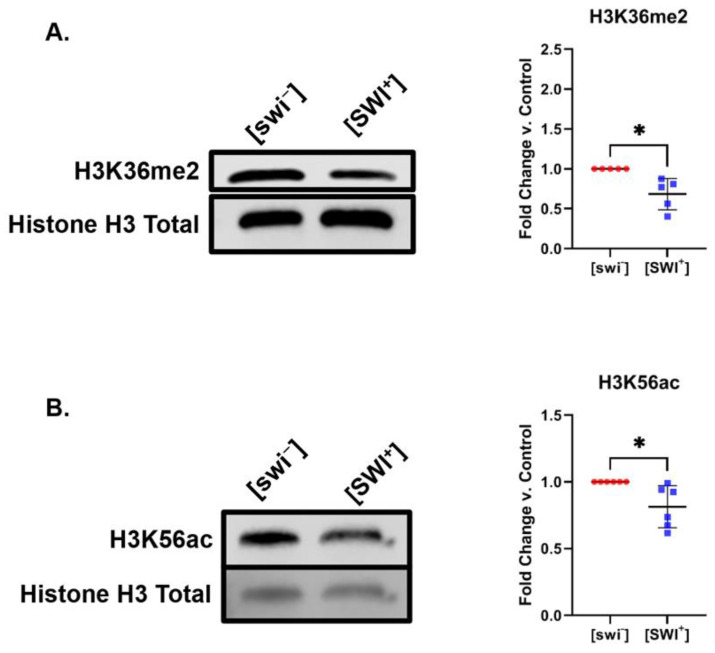
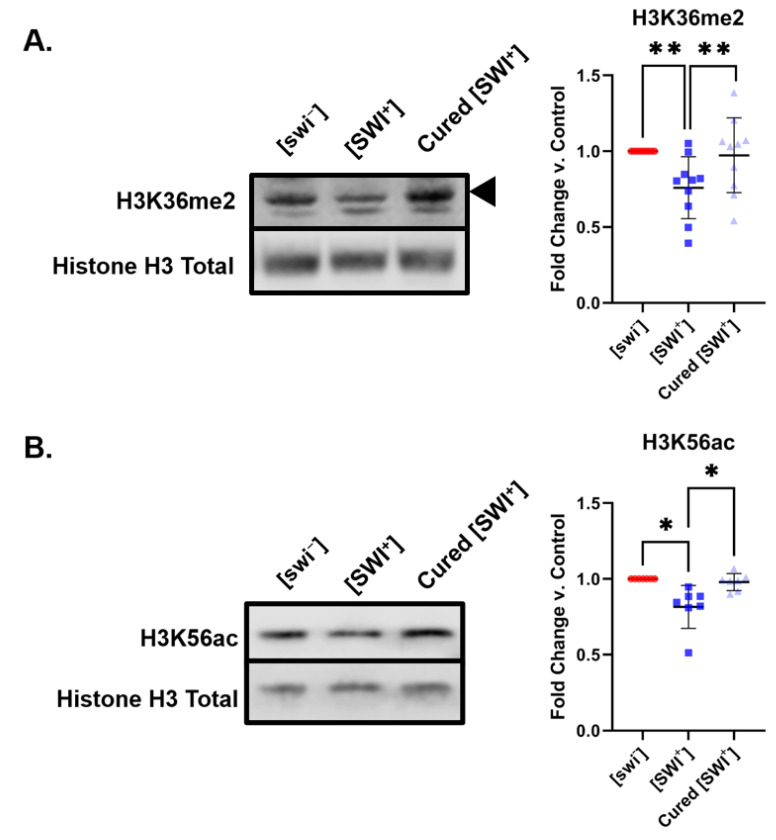
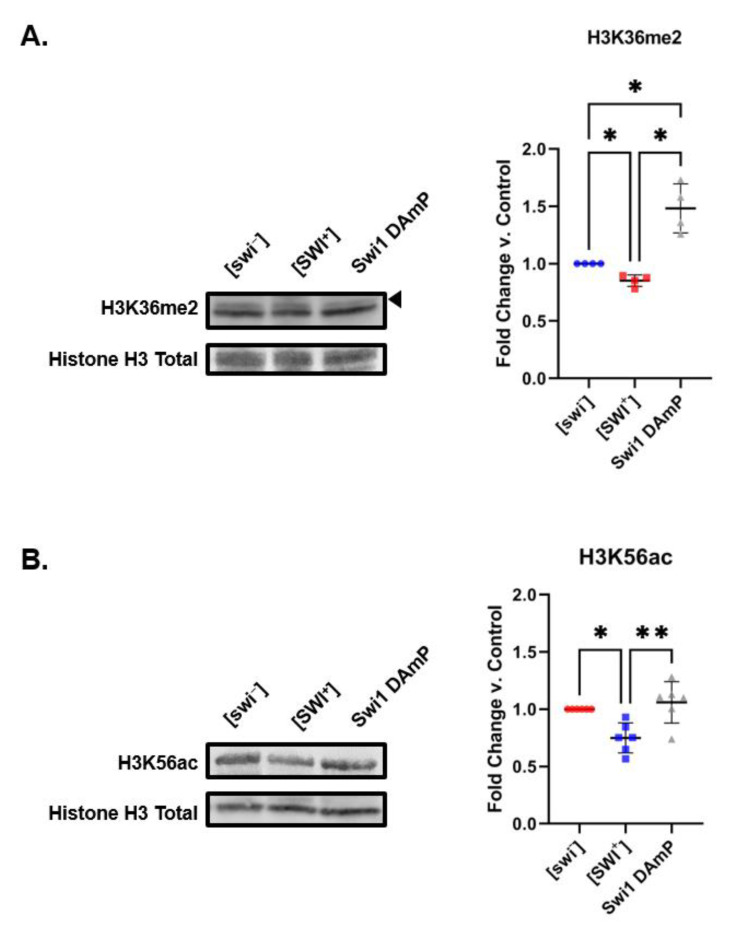
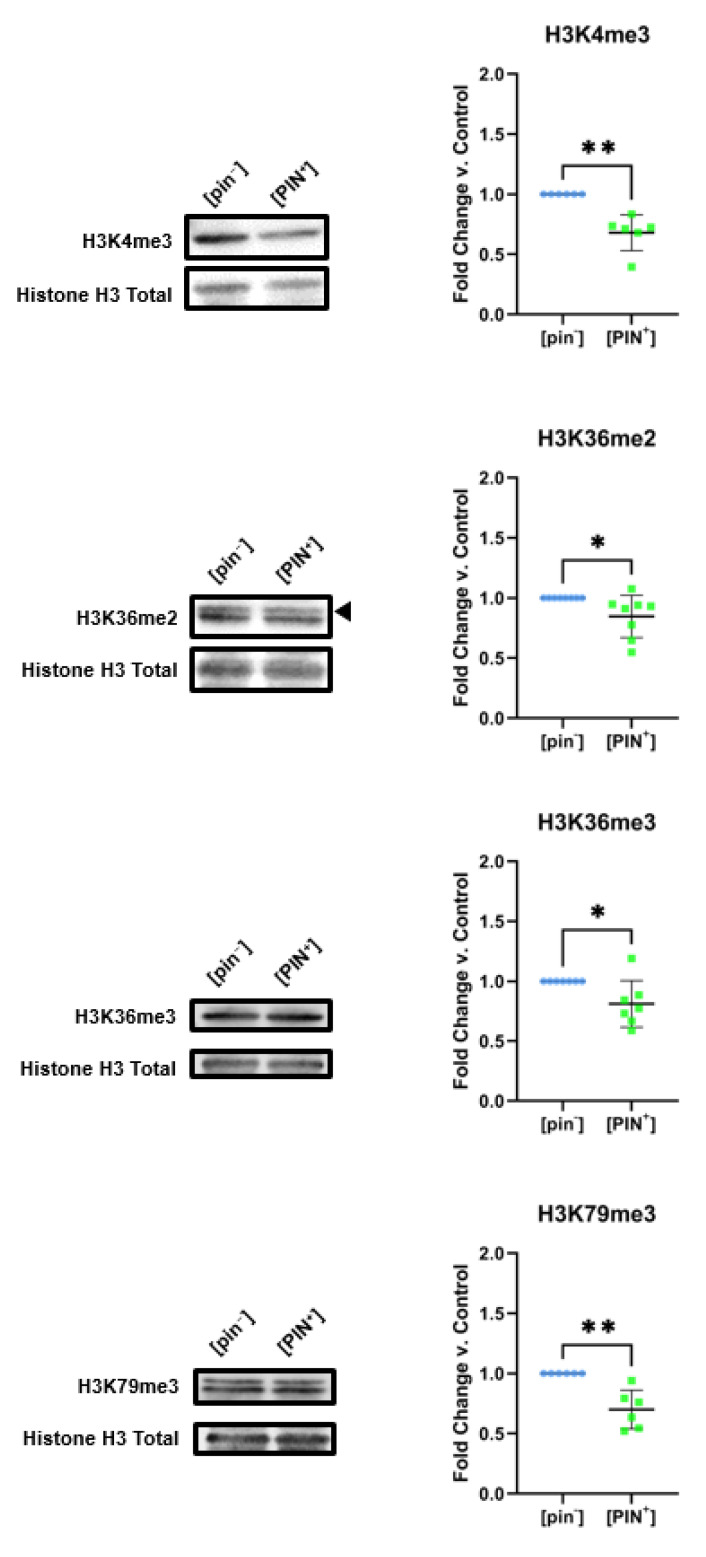
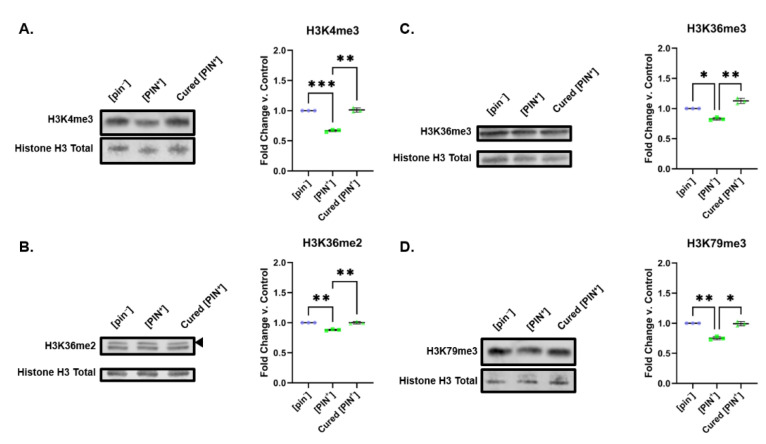
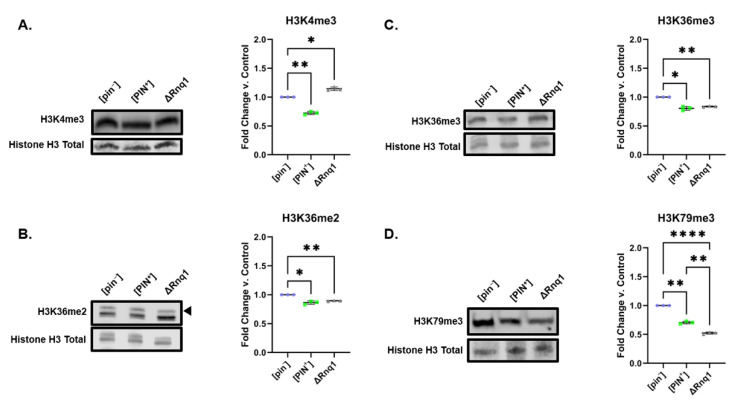
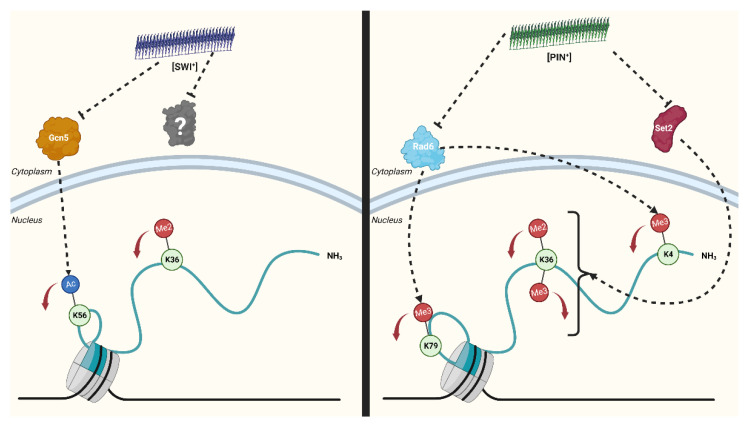
Prions are proteins able to take on alternative conformations and propagate them in a self-templating process. In Saccharomyces cerevisiae, prions enable heritable responses to environmental conditions through bet-hedging mechanisms. Hence, [PRION+] states may serve as an atypical form of epigenetic control, producing heritable phenotypic change via protein folding. However, the connections between prion states and the epigenome remain unknown. Do [PRION+] states link to canonical epigenetic channels, such as histone post-translational modifications? Here, we map out the histone H3 modification landscape in the context of the [SWI+] and [PIN+] prion states. [SWI+] is propagated by Swi1, a subunit of the SWI/SNF chromatin remodeling complex, while [PIN+] is propagated by Rnq1, a protein of unknown function. We find [SWI+] yeast display decreases in the levels of H3K36me2 and H3K56ac compared to [swi-] yeast. In contrast, decreases in H3K4me3, H3K36me2, H3K36me3 and H3K79me3 are connected to the [PIN+] state. Curing of the prion state by treatment with guanidine hydrochloride restored histone PTM to [prion-] state levels. We find histone PTMs in the [PRION+] state do not match those in loss-of-function models. Our findings shed light into the link between prion states and histone modifications, revealing novel insight into prion function in yeast.

Keywords: Saccharomyces cerevisiae; epigenetics; histone post-translational modifications; prion; protein aggregates; yeast.


Conflict of interest statement

The authors declare no conflict of interest.

Figures

Figure 1
Figure 1
Prion states are connected to distinct changes in the levels of histone H3 post-translational modifications. Bubble plot displaying relative fold change values of histone H3 PTMs in yeast bearing [SWI+] and [PIN+] compared to [swi] and [pin] cells, respectively. Size of bubbles represents relative fold changes in histone PTM levels. p values were calculated using a two-tailed t test with Welch’s modification. Color scale represents p values; gray indicates a p > 0.05, while blue indicates a p value ≤ 0.05.
Figure 2
Figure 2
[SWI+] is connected to decreases in the levels of H3K36me2 and H3K56ac. Representative immunoblots displaying the levels of (A) H3K36me2 and (B) H3K56ac for [SWI+] and [swi] yeast. Graphs compiling quantification of biological replicates are presented alongside blots. Graphs display the mean fold change in modification levels for each group based on densitometric analysis of Western blots. Error bars indicate the ±SD. n = 6 for each experiment, * = p < 0.05.
Figure 3
Figure 3
GuHCl curing of [SWI+] restores K36me2 and K56ac levels. Representative blots show the levels of (A) H3K36me2 (n = 10) and (B) H3K56ac (n = 6) in [swi], [SWI+], and cured [SWI+] yeast. Graphs compiling quantification of biological replicates are presented alongside blots. Graphs display the mean fold change in modification levels for each group based on densitometric analysis of Western blots. Error bars indicate the ±SD. * = p < 0.05, ** = p < 0.01.
Figure 4
Figure 4
Decreased levels of Swi1 are associated with histone PTM changes that differ from those connected to [SWI+]. Representative blots show the levels of (A) H3K36me2 and (B) H3K56ac [swi], [SWI+] and Swi1 DAmP yeast. Graphs compiling quantification of biological replicates are presented alongside blots. Graphs display the mean fold change in modification levels for each group based on densitometric analysis of Western blots. Error bars indicate the ±SD. * = p < 0.05, ** = p < 0.01.
Figure 5
Figure 5
[PIN+] is connected to decreases in the di- and trimethylation levels of histone H3 on specific sites. [PIN+] is associated with significant decreases in the levels of H3K4me3, H3K36me2, H3K36me3, and H3K79me3 levels compared to [pin] control yeast. Representative immunoblots displaying the levels of each modification for [PIN+] and [pin] yeast are shown. Graphs compiling quantification of biological replicates are presented alongside blots. Graphs display the mean fold change in modification levels for each group based on densitometric analysis of Western blots. Error bars indicate the ±SD. n = 6 for all experiments, * = p < 0.05, ** = p < 0.01.
Figure 6
Figure 6
GuHCl treatment of [PIN+] yeast restores H3 methylation levels. Representative Western blots showing the levels of (A) H3K4me3, (B) H3K36me2, (C) H3K36me3 and (D) H3K79me3 in [pin], [PIN+], and cured [PIN+] yeast are shown. Graphs compiling quantification of biological replicates are presented alongside blots. Graphs display the mean fold change in modification levels for each group based on densitometric analysis of Western blots. Error bars indicate the ±SD. n = 6 for each experiment, * = p < 0.05, ** = p < 0.01, *** = p < 0.001.
Figure 7
Figure 7
Rnq1 deletion is connected to a different histone PTM landscape from [PIN+] yeast. [pin], [PIN+] and ΔRnq1 yeast were probed for changes in (A) H3K4me3, (B) H3K36me2, (C) H3K36me3 and (D) H3K79me3. Representative blots are shown alongside graphs compiling quantification of biological replicates. Graphs display the mean fold change in modification levels for each group based on densitometric analysis of Western blots. Error bars indicate the ±SD. * = p < 0.05, ** = p < 0.01, **** = p < 0.0001.
Figure 8
Figure 8
Distinct [PRION+] states are connected to unique changes in post-translational modifications on histone H3. [SWI+] is linked to decreases in H3K56ac potentially occurring through interference of histone deacetylase Gcn5 (orange) activity. Decreases in H3K36me2 levels could involve other histone modifying enzymes (gray) aside from Set2. [PIN+] yeast display a decrease in H3K4me3 and H3K79me3 through potential disruption of the activity of the ubiquitin conjugating enzyme Rad6 (blue). H3K36me2 and H3K36me3 levels reductions in [PIN+] yeast could be mediated through potential interactions with the histone methyltransferase Set2 (red). Red arrows represent decreases in associated histone post-translational modification levels. Created with BioRender.com (accessed on 16 November 2022).

Similar articles

Cited by

References

    1. Aguzzi A., Polymenidou M. Mammalian prion biology: One century of evolving concepts. Cell. 2004;116:313–327. doi: 10.1016/S0092-8674(03)01031-6. - DOI - PubMed
    1. Halfmann R., Lindquist S. Epigenetics in the extreme: Prions and the inheritance of environmentally acquired traits. Science. 2010;330:629–632. doi: 10.1126/science.1191081. - DOI - PubMed
    1. Namy O., Galopier A., Martini C., Matsufuji S., Fabret C., Rousset J.P. Epigenetic control of polyamines by the prion [PSI+] Nat. Cell Biol. 2008;10:1069–1075. doi: 10.1038/ncb1766. - DOI - PubMed
    1. Joseph S.B., Kirkpatrick M. Effects of the [PSI+] prion on rates of adaptation in yeast. J. Evol. Biol. 2008;21:773–780. doi: 10.1111/j.1420-9101.2008.01515.x. - DOI - PubMed
    1. True H.L., Lindquist S.L. A yeast prion provides a mechanism for genetic variation and phenotypic diversity. Nature. 2000;407:477–483. doi: 10.1038/35035005. - DOI - PubMed

LinkOut - more resources