Mesoporous Silica Promotes Osteogenesis of Human Adipose-Derived Stem Cells Identified by a High-Throughput Microfluidic Chip Assay
- PMID: 36559224
- PMCID: PMC9781822
- DOI: 10.3390/pharmaceutics14122730
Mesoporous Silica Promotes Osteogenesis of Human Adipose-Derived Stem Cells Identified by a High-Throughput Microfluidic Chip Assay
Abstract
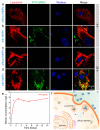
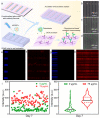
Silicon-derived biomaterials are conducive to regulating the fate of osteo-related stem cells, while their effects on the osteogenic differentiation of human adipose-derived stem cells (hADSCs) remain inconclusive. Mesoporous silica (mSiO2) is synthesized in a facile route that exhibited the capability of promoting osteogenic differentiation of hADSCs. The metabolism of SiO2 in cells is proposed according to the colocalization fluorescence analysis between lysosomes and nanoparticles. The released silicon elements promote osteogenic differentiation. The detection of secretory proteins through numerous parallel experiments performed via a microfluidic chip confirms the positive effect of SiO2 on the osteogenic differentiation of hADSCs. Moreover, constructed with superparamagnetic iron oxide (Fe3O4), the magnetic nanoparticles (MNPs) of Fe3O4@mSiO2 endow the cells with magnetic resonance imaging (MRI) properties. The MNP-regulated osteogenic differentiation of autologous adipose-derived stem cells provides considerable clinical application prospects for stem cell therapy of bone tissue repair with an effective reduction in immune rejection.
Keywords: human adipose-derived stem cells; mesoporous silica; microfluidic detection; osteogenic differentiation.
Conflict of interest statement
The authors declare no conflict of interest.
Figures


Similar articles
-
Effect of Hydroxyapatite Nanorods on the Fate of Human Adipose-Derived Stem Cells Assessed In Situ at the Single Cell Level with a High-Throughput, Real-Time Microfluidic Chip.Small. 2019 Dec;15(51):e1905001. doi: 10.1002/smll.201905001. Epub 2019 Nov 7. Small. 2019. PMID: 31697037
-
Transcriptomic analysis and biological evaluation reveals that LMO3 regulates the osteogenic differentiation of human adipose derived stem cells via PI3K/Akt signaling pathway.J Mol Histol. 2022 Apr;53(2):379-394. doi: 10.1007/s10735-021-10047-5. Epub 2022 Feb 14. J Mol Histol. 2022. PMID: 35165791
-
PCL/Col I-based magnetic nanocomposite scaffold provides an osteoinductive environment for ADSCs in osteogenic cues-free media conditions.Stem Cell Res Ther. 2022 Apr 4;13(1):143. doi: 10.1186/s13287-022-02816-0. Stem Cell Res Ther. 2022. PMID: 35379318 Free PMC article.
-
A smart fluorescence nanoprobe for the detection of cellular alkaline phosphatase activity and early osteogenic differentiation.Nanomedicine. 2016 Jul;12(5):1313-22. doi: 10.1016/j.nano.2016.01.010. Epub 2016 Mar 4. Nanomedicine. 2016. PMID: 26961462
-
Magnetic resonance imaging tracking of human adipose derived stromal cells within three-dimensional scaffolds for bone tissue engineering.Eur Cell Mater. 2011 Apr 11;21:341-54. doi: 10.22203/ecm.v021a25. Eur Cell Mater. 2011. PMID: 21484704
Cited by
-
Cytocompatible and osteoconductive silicon oxycarbide glass scaffolds 3D printed by DLP: a potential material for bone tissue regeneration.Front Bioeng Biotechnol. 2024 Jan 4;11:1297327. doi: 10.3389/fbioe.2023.1297327. eCollection 2023. Front Bioeng Biotechnol. 2024. PMID: 38239914 Free PMC article.
-
Electrochemical-Genetic Programming of Protein-Based Magnetic Soft Robots for Active Drug Delivery.Adv Sci (Weinh). 2025 Jul;12(27):e2503404. doi: 10.1002/advs.202503404. Epub 2025 Apr 29. Adv Sci (Weinh). 2025. PMID: 40298906 Free PMC article.
References
-
- Zhang X., Koo S., Kim J.H., Huang X., Kong N., Zhang L., Zhou J., Xue J., Harris M.B., Tao W., et al. Nanoscale materials-based platforms for the treatment of bone-related diseases. Matter. 2021;4:2727–2764.
-
- Koons G.L., Diba M., Mikos A.G. Materials design for bone-tissue engineering. Nat. Rev. Mater. 2020;5:584–603. doi: 10.1038/s41578-020-0204-2. - DOI
-
- Wan X., Liu Z., Li L. Manipulation of Stem Cells Fates: The Master and Multifaceted Roles of Biophysical Cues of Biomaterials. Adv. Funct. Mater. 2021;31:2010626.
Grants and funding
LinkOut - more resources
Full Text Sources

