. 2022 Dec 8;11(24):3435.
doi: 10.3390/plants11243435.

Simulated Analysis of Influence of Changes in H+-ATPase Activity and Membrane CO2 Conductance on Parameters of Photosynthetic Assimilation in Leaves

Affiliations

Simulated Analysis of Influence of Changes in H+-ATPase Activity and Membrane CO2 Conductance on Parameters of Photosynthetic Assimilation in Leaves

Ekaterina Sukhova et al. Plants (Basel). .

Abstract

Photosynthesis is an important process in plants which influences their development and productivity. Many factors can control the efficiency of photosynthesis, including CO2 conductance of leaf mesophyll, which affects the CO2 availability for Rubisco. It is known that electrical stress signals can decrease this conductance, and the response is probably caused by inactivation of H+-ATPase in the plasma membrane. In the current work, we analyzed the influence of both CO2 conductance in the plasma membrane, and chloroplast envelopes and H+-ATPase activity on photosynthetic CO2 assimilation, using a two-dimensional mathematical model of photosynthesis in leaves. The model included a description of assimilation on the basis of the Farquhar-von Caemmerer-Berry model, ion transport through the plasma membrane, diffusion of CO2 in the apoplast, and transport of CO2 through the plasma membrane and chloroplast envelope. The model showed that the photosynthetic CO2 assimilation rate was mainly dependent on the plasma membrane and chloroplast envelope conductance; direct influence of the H+-ATPase activity (through changes in pH and CO2/HCO3- concentration ratio) on this rate was weak. In contrast, both changes in CO2 conductance of the plasma membrane and chloroplast envelopes and changes in the H+-ATPase activity influenced spatial heterogeneity of the CO2 assimilation on the leaf surface in the simulated two-dimensional system. These effects were also observed under simultaneous changes in the CO2 conductance of the plasma membrane and H+-ATPase activity. Qualitatively similar influence of changes in the CO2 conductance of the plasma membrane and chloroplast envelopes, and changes in the H+-ATPase activity on photosynthesis were shown for two different densities of stomata in the simulated leaf; however, lowering the density of stomata decreased the assimilation rate and increased the heterogeneity of assimilation. The results of the model analysis clarify the potential influence of H+-ATPase inactivation on photosynthesis, and can be the basis for development of new methods for remote sensing of the influence of electrical signals.

Keywords: H+-ATPase; chloroplast envelope CO2 conductance; electrical signals; photosynthetic CO2 assimilation; plasma membrane CO2 conductance; spatial heterogeneity; two-dimensional photosynthetic model.


Conflict of interest statement

The authors declare no conflict of interest. The funders had no role in the design of the study, the collection, analyses, or interpretation of data, the writing of the manuscript or in the decision to publish the results.

Figures

Figure 1
Figure 1
(a) A general scheme of the two-dimensional model of photosynthesis in a leaf. The simulated leaf is round and is composed of cells which are connected through the apoplast. Small arrows show transport of carbon dioxide, H+, and K+ between apoplastic volumes of neighboring cells and across the plasma membrane. PAR is the photosynthetically active radiation. (b) A description of ion and CO2 fluxes, the activities of ion transporters, buffer capacities, and photosynthetic and respiratory processes simulated by the model. pHap, pHcyt, and pHstr are the pH in the apoplast, cytoplasm, and stroma of chloroplasts, respectively. Bcyt and BcytH are the free and proton-bound cytoplasmic buffers. Bap, BapH, and BapK are the free, proton-bound, and potassium-bound apoplastic buffers. Em is the gradient of electrical potential across the plasma membrane. FvCB-model is the Farquhar–von Caemmerer–Berry model. The main systems of ion transport at rest, including H+-ATP-ases, H+/K+-antiporters, inwardly rectifying K+ channels, and outwardly rectifying K+ channels are described in the two-dimensional photosynthetic model. The schemes from [42], with modifications, are used.
Figure 2
Figure 2
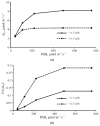
Light dependence of the photosynthetic CO2 assimilation rate Ahv (a) and the coefficient of variation of assimilation CV(Ahv) (b). PAR is photosynthetically active radiation. Each stomata in the simulated leaf was located in center of a 3 × 3 cell square or a 5 × 5 cell square. The basic values of the model parameters were used.
Figure 3
Figure 3
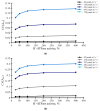
Simulated dependence of the photosynthetic CO2 assimilation rate (Ahv) on the H+-ATPase activity in variants with stomata located in center of the 3 × 3 cell square (a) or in center of the 5 × 5 cell square (b) under various intensities of PAR. The value of the H+-ATPase activity from our previous work [42] was used as 100%.
Figure 4
Figure 4
Simulated dependence of variation coefficient of spatial distribution of the photosynthetic CO2 assimilation rate (CV(Ahv)) on the H+-ATPase activity in variants with stomata located in center of 3 × 3 cells square (a) or in center of 5 × 5 cells square (b) under various intensities of PAR. Value of the H+-ATPase activity from our previous work [42] was used as 100%.
Figure 5
Figure 5
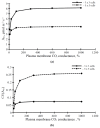
Dependence of the photosynthetic CO2 assimilation rate (Ahv) (a) and the coefficient of variation of the spatial distribution of this rate (CV(Ahv)) (b) on the plasma membrane CO2 conductance under PAR intensity equaling to 221 μmol m−2 s−1. Each stomata in the simulated leaf was located in center of a 3 × 3 cell square or in center of a 5 × 5 cell square. The value of the plasma membrane CO2 conductance from our previous work [42] was used as 100%.
Figure 6
Figure 6
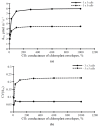
Dependence of the photosynthetic CO2 assimilation rate (Ahv) (a) and the coefficient of variation of the spatial distribution of this rate (CV(Ahv)) (b) on the CO2 conductance of chloroplast envelopes under PAR intensity equaling to 221 μmol m−2 s−1. Each stomata in the simulated leaf was located in center of a 3 × 3 cell square or in center of a 5 × 5 cell square. The value of the CO2 conductance of chloroplast envelopes from our previous work [42] was used as 100%.

Similar articles

Cited by

References

    1. Foyer C.H., Ruban A.V., Nixon P.J. Photosynthesis solutions to enhance productivity. Philos. Trans. R. Soc. Lond. B Biol. Sci. 2017;372:20160374. doi: 10.1098/rstb.2016.0374. - DOI - PMC - PubMed
    1. Simkin A.J., López-Calcagno P.E., Raines C.A. Feeding the world: Improving photosynthetic efficiency for sustainable crop production. J. Exp. Bot. 2019;70:1119–1140. - PMC - PubMed
    1. Tholen D., Zhu X.-G. The mechanistic basis of internal conductance: A theoretical analysis of mesophyll cell photosynthesis and CO2 diffusion. Plant Physiol. 2011;156:90–105. doi: 10.1104/pp.111.172346. - DOI - PMC - PubMed
    1. Berghuijs H.N., Yin X., Ho Q.T., Driever S.M., Retta M.A., Nicolaï B.M., Struik P.C. Mesophyll conductance and reaction-diffusion models for CO2 transport in C3 leaves; needs, opportunities and challenges. Plant Sci. 2016;252:62–75. doi: 10.1016/j.plantsci.2016.05.016. - DOI - PubMed
    1. Von Caemmerer S., Farquhar G., Berry J. Biochemical model of C3 photosynthesis. In: Laisk A., Nedbal L., Govindjee, editors. Photosynthesis In Silico: Advances in Photosynthesis and Respiration. Volume 29. Springer; Dordrecht, The Netherlands: 2009. pp. 209–230.

LinkOut - more resources