Review
. 2022 Dec 13;11(24):3502.
doi: 10.3390/plants11243502.

Responses of Caribbean Mangroves to Quaternary Climatic, Eustatic, and Anthropogenic Drivers of Ecological Change: A Review

Affiliations
Review

Responses of Caribbean Mangroves to Quaternary Climatic, Eustatic, and Anthropogenic Drivers of Ecological Change: A Review

Valentí Rull. Plants (Basel). .

Abstract

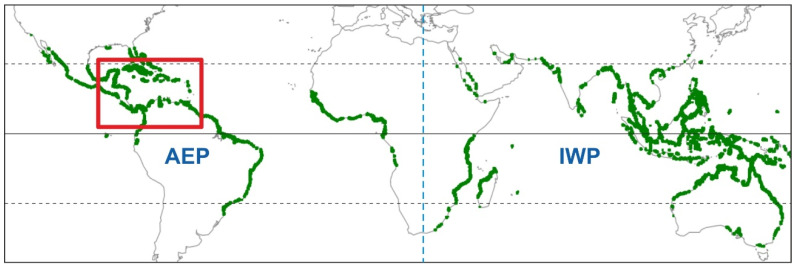
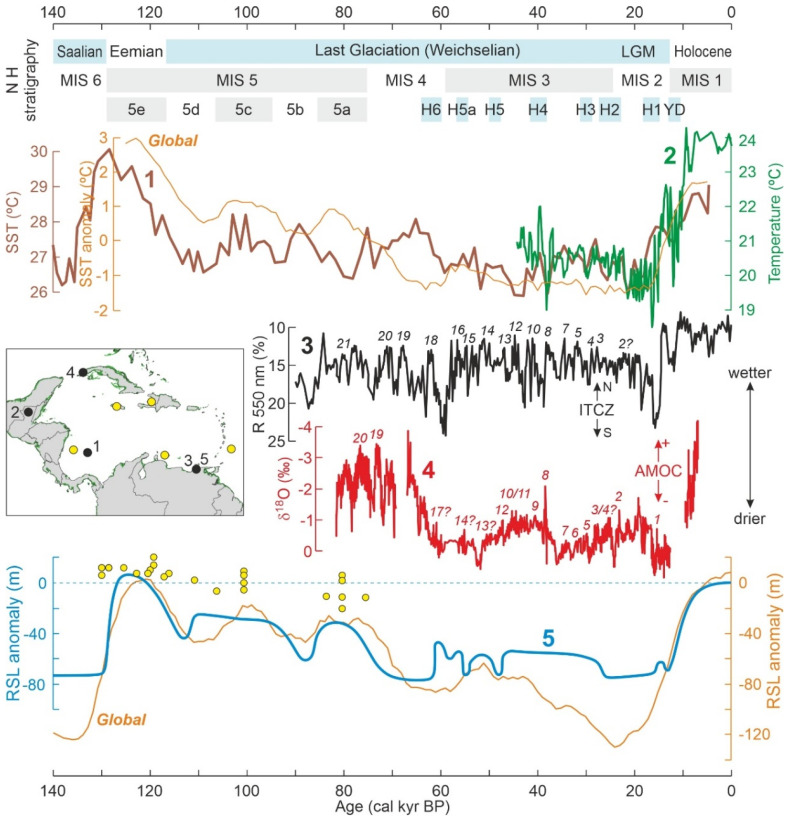
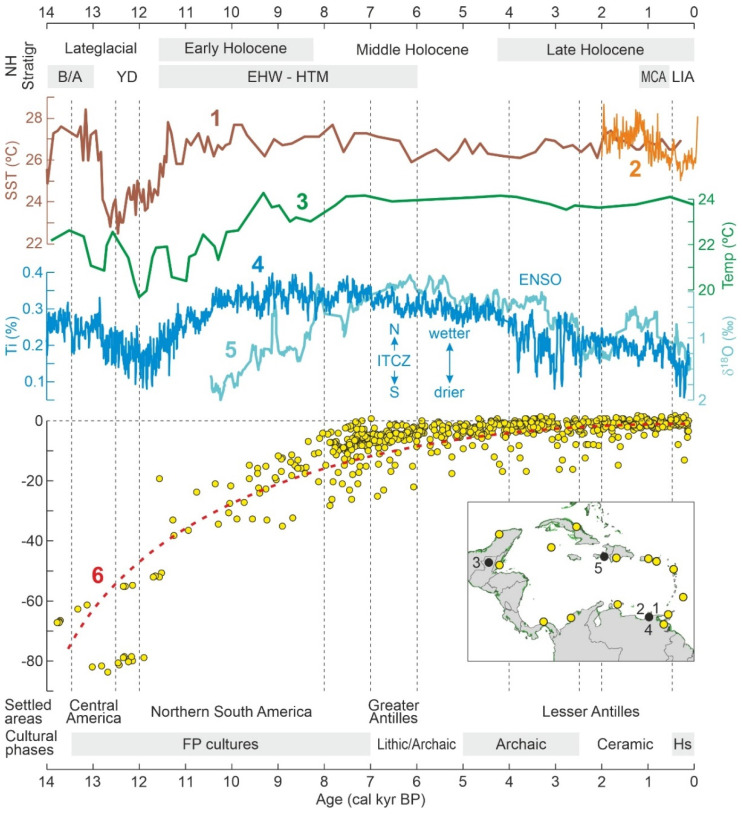
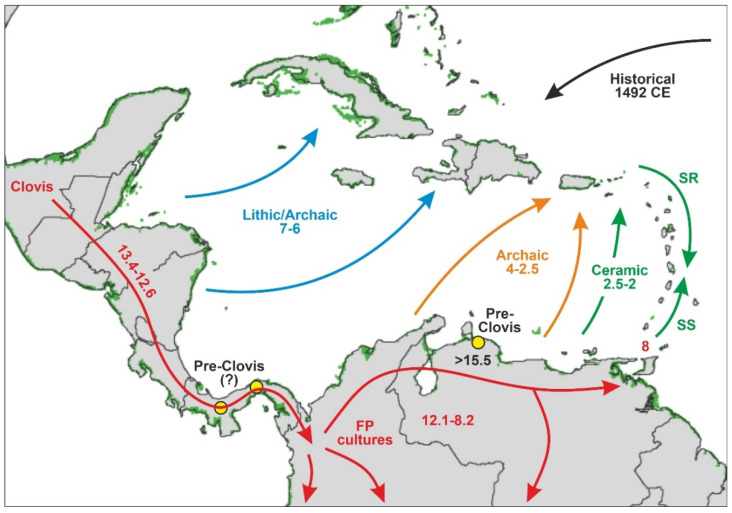
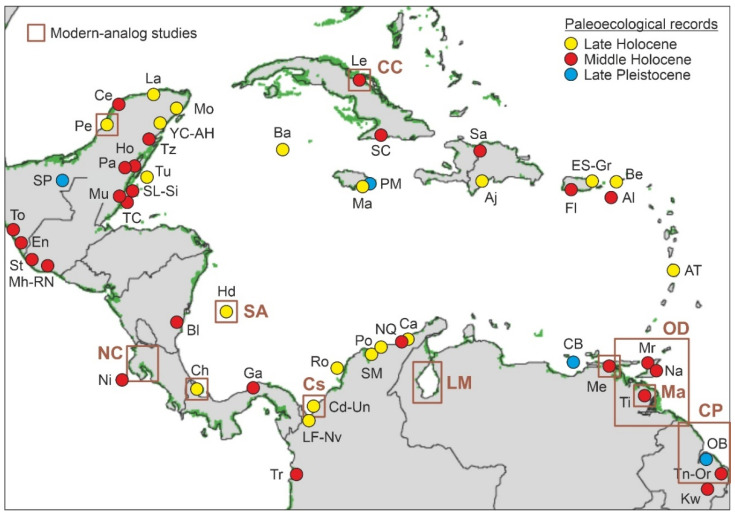
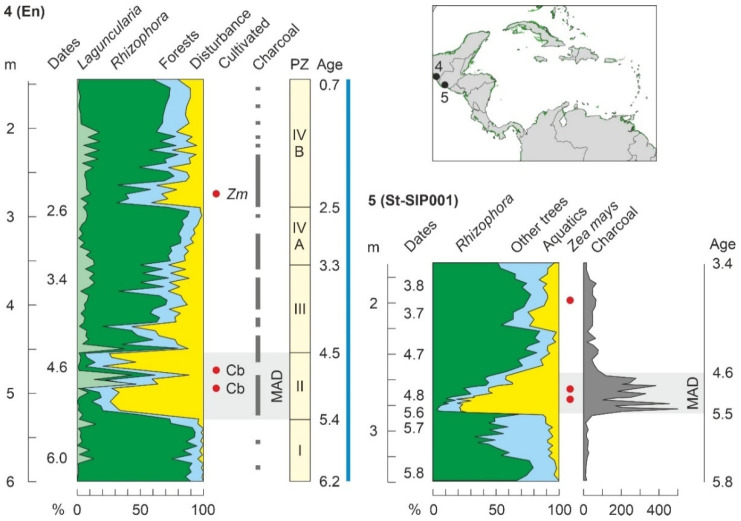
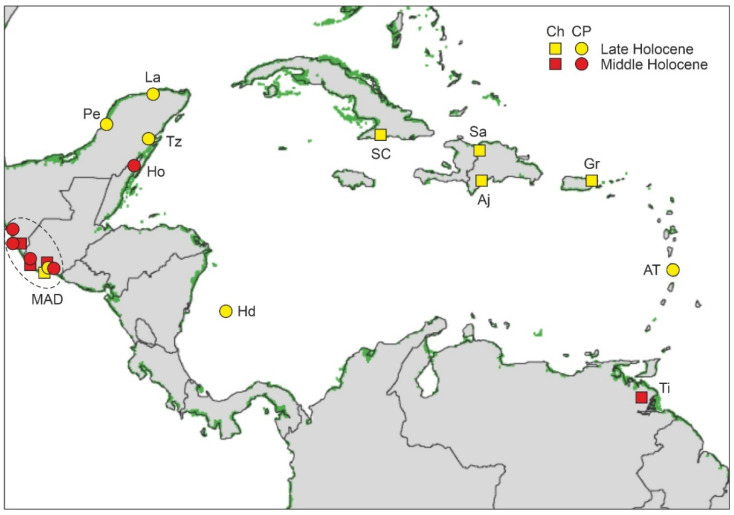
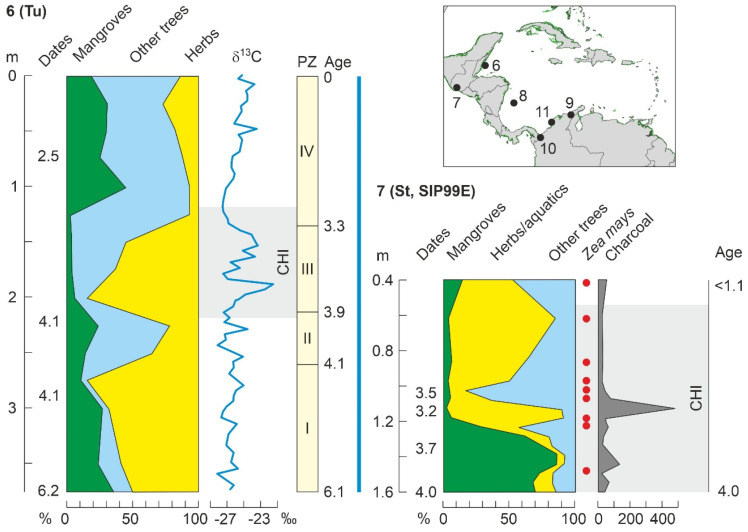
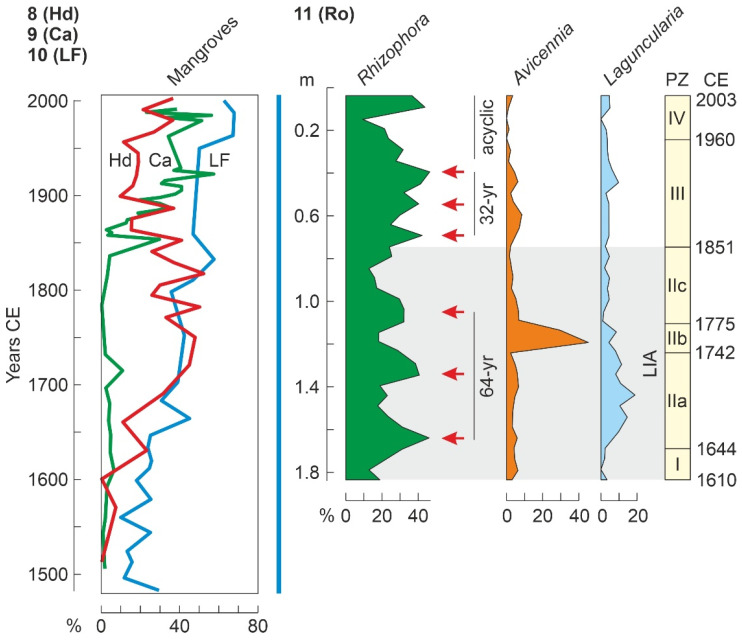
Mangroves are among the world's most threatened ecosystems. Understanding how these ecosystems responded to past natural and anthropogenic drivers of ecological change is essential not only for understanding how extant mangroves have been shaped but also for informing their conservation. This paper reviews the available paleoecological evidence for Pleistocene and Holocene responses of Caribbean mangroves to climatic, eustatic, and anthropogenic drivers. The first records date from the Last Interglacial, when global average temperatures and sea levels were slightly higher than present and mangroves grew in locations and conditions similar to today. During the Last Glaciation, temperatures and sea levels were significantly lower, and Caribbean mangroves grew far from their present locations on presently submerged sites. The current mangrove configuration was progressively attained after Early Holocene warming and sea level rise in the absence of anthropogenic pressure. Human influence began to be important in the Mid-Late Holocene, especially during the Archaic and Ceramic cultural periods, when sea levels were close to their present position and climatic and human drivers were the most influential factors. During the last millennium, the most relevant drivers of ecological change have been the episodic droughts linked to the Little Ice Age and the historical developments of the last centuries.

Keywords: Caribbean; Holocene; Pleistocene; biotic responses; climate change; human disturbance; mangroves; palynology; sea levels.


Conflict of interest statement

The author declares no conflict of interest.

Figures

Figure 1
Figure 1
World map of mangroves (green fringes) indicating the Caribbean region (red box). The African continental barrier between the Atlantic-Eastern Pacific (AEP) and Indo-West Pacific (IWP) regions is represented by a dotted blue line in the center. Base map from Ref. [1].
Figure 2
Figure 2
Examples of mangrove-forming trees from the Caribbean region. (A) Rhizophora mangle; (B) Avicennia germinans; (C) Pelliciera rhizophorae; (D) Laguncularia racemosa; (E) Acrostichum aureum; (F) Conocarpus erectus. Modified from Ref. [20].
Figure 3
Figure 3
A Google Earth map showing the Caribbean region sensu lato considered in this study and the main physiographic features.
Figure 4
Figure 4
Caribbean precipitation patterns. (A) Seasonal variations in Central America and the Caribbean islands. (B) Total annual precipitation patterns across the study area (A, Florida region; B, Central America; C, northern South America; D, Caribbean islands). MSD, mid-summer drought. Modified from Ref. [26].
Figure 5
Figure 5
NASA Landsat 5-TM image of the Caribbean mangrove areas (green patches) using the data of Ref. [4]. Abbreviations from Table 1. Base map downloaded from https://earthobservatory.nasa.gov/images/47427/mapping-mangroves-by-satellite (last accessed 3 October 2022).
Figure 6
Figure 6
Pollen morphology of the main components of Caribbean mangroves. (AC) Rhizophora mangle (red mangrove); (D,E) Conocarpus erectus (buttowood); (F,G) Laguncularia racemosa (white mangrove); (H,I) Avicennia germinans (black mangrove); (JL) Pelliciera rhizophorae (tea mangrove). Measurements (vertical lines) in μm. Modified from Ref. [20].
Figure 7
Figure 7
Approximate geographical range of the most important Neotropical mangrove-forming trees in the Caribbean region. Species distributed across the whole study area are indicated in blue in the upper right. A, Avicennia; C, Conocarpus; L, Laguncularia; R, Rhizophora. Composed from Refs. [49,50].
Figure 8
Figure 8
Idealized transect showing the typical coastal zonation of Caribbean mangroves. The approximate ranges of the most important mangrove elements are indicated by green lines. Modified from Ref. [20].
Figure 9
Figure 9
Temperature, moisture and sea level changes during the last glacial cycle in the Caribbean region, compared with global reconstructions. (1) Sea surface temperature (SST) reconstruction from core ODP-999A (Colombian Basin) [79]; (2) Land temperature reconstruction from Lake Petén Itzá (Guatemala) [80]; (3) Millennial ITCZ migration as recorded in the reflectance (R) measures of core ODP-1002 (Cariaco Basin, Venezuela) [81], numbers are the Dansgaard-Oeschger (D-O) events [82]; (4) Oxygen isotope ratio of speleothem Cuba Medio from the Santo Tomás cave (Cuba) [83], numbers are D-O events [82]; (5) Relative sea level (RSL) reconstruction based on seismic stratigraphy from the Venezuelan Gulf of Cariaco (blue line) [84] and several coral terraces from Barbados, Bonaire, Cayman, Curaçao, Haiti and San Andrés (Colombia) (yellow dots) [85,86,87,88,89]. Global temperature and sea-level reconstructions from Refs. [90,91], respectively. Northern Hemisphere (NH) glacial stratigraphy based on Refs. [92,93,94]. AMOC, Atlantic Meridional Overturning Circulation; H1-H6, Heinrich events; ITCZ, Intertropical Convergence Zone; LGM, Last Glacial Maximum; MIS, Marine Isotope Stages; YD, Younger Dryas.
Figure 10
Figure 10
Late Glacial and Holocene temperature, moisture, sea-level changes and human settlement in the Caribbean region. (1) Sea Surface Temperature (SST) reconstruction from core PL07-39PC (Cariaco Basin, Venezuela) [95]; (2) High-resolution record of the last two millennia from core PL07-72GGC (Cariaco Basin, Venezuela) [96], vertical axis as in (1); (3) Land temperature reconstruction from Lake Petén Itzá (Guatemala) [80]; (4) Titanium (Ti) concentration as a proxy for continental moisture (river discharge) in core ODP-1002 (Cariaco Basin, Venezuela) [97]; (5) Ostracod oxygen isotope ratio from Lake Miragoane (Haiti) as a moisture proxy (the same ITCZ dynamics apply) [98]; (6) Sea-level trends, as deduced from almost 500 sites widespread across the Caribbean region (yellow dots in the reference map) [99]. B/A, Bølling/Allerød; Cr, Ceramic culture; EHW, Early Holocene Warming; Eu, Europeans; FP cultures, Fishtailed-Point cultures; G Antilles, Greater Antilles; Hs, Historical; HTM, Holocene Thermal Maximum; ITCZ, Intertropical Convergence Zone; LIA, Little Ice Age; MCA, Medieval Climate Anomaly; YD, Younger Dryas.
Figure 11
Figure 11
Human migration and settlement patterns across the Caribbean region considered in this study, composed from Refs. [105,109,110,111,114,115,116,117,118,119]. Numbers are ages in cal kyr BP. FP cultures, Fishtailed-Point cultures; SR, southern route hypothesis; SS, stepping-stone hypothesis.
Figure 12
Figure 12
Circum-Caribbean sites and areas with Pleistocene–Holocene mangrove records (dots) and modern-analog pollen studies (boxes). Dot colors indicate the oldest age of each record. Abbreviations of paleoecological sites according to Table 3. Modern-analog study sites: CC, Cayo Coco (Cuba) [132]; Ch, Changuinola (Panama) [133]; CP, coastal plain (Guyana) [131]; Cs, Cispatá (Colombia) [134]; LM; Lake Maracaibo (Venezuela) [135]; Ma, Caño Macareo (Venezuela) [136]; Me, Playa Medina (Venezuela) [137,138]; NC, northwest Costa Rica [139,140]; OD, Orinoco delta (Venezuela) [130]; Pe, Petenes (Mexico) [141]; SA, San Andrés (Colombia) [142]; Ti, Caño Tigre (Venezuela) [143].
Figure 13
Figure 13
Cariaco pollen record from core MD03-2622 showing the changes in the abundance of mangrove elements (Rhizophora and Acrostichum), using the gray scale (reflectance) and the SDF (semi-deciduous forest) and the SM (salt marsh) percentage curves as a reference. H6 to H3 are Heinrich events, and numbers in the gray scale are D-O events. Composed from Refs. [187,188].
Figure 14
Figure 14
Summary pollen diagram from the Ogle Bridge section (Guyana) and chronological interpretation, according to the original Ref. [131]. Other trees include Alnus, Ilex, Symphonia, Virola, Mauritia, and other palms. Redrawn from Ref. [131].
Figure 15
Figure 15
Holocene pollen records sorted by oldest date (time scale in cal yr BP). The different continental and insular Caribbean coasts are indicated by line colors. Yellow dots indicate the first appearances of pollen/phytoliths from cultivated plants, and gray dots mark the onset of significant/continuous charcoal records. Data and abbreviations from Table 3 (see Figure 12 for location). CHI, Cariaco Holocene Instability event; CP, Cultural Phases; His, Historical period; MAD, Mesoamerican Archaic Disturbance event.
Figure 16
Figure 16
Summary pollen diagrams for the oldest and most complete mangrove records identified in this review. Diagrams SL and Si are plotted by depth (m), and Mr is plotted by time (cal kyr BP), as in the original references. All dates (calibrated from 14C dates) and ages (interpolated/extrapolated from age-depth models) are in cal kyr BP and have been taken from the original references. The broken line between six and two cal kyr BP in sites SL and Si indicates the approximate position of the millennial-scale sedimentary gap present in these sequences; the question mark in SL indicates the uncertainty of the II/III boundary due to the sedimentary gap. FP, Fishtailed Point cultures; PZ, pollen zones. Redrawn and composed from Refs. [179,182,185].
Figure 17
Figure 17
Summary subcentennial pollen records from Mesoamerica showing the conspicuous Mesoamerican Archaic Disturbance event (MAD) (gray band). The occurrence of pollen from cultivated plants is indicated by red dots (Cb, Cucurbitaceae; Zm, Zea mays). All dates (calibrated from 14C dates) and ages (interpolated/extrapolated from age-depth models) are in cal kyr BP and have been taken from the original references. Charcoal is represented in concentration units (particles/mL of sediment). PZ, pollen zones. Redrawn and composed from Refs. [124,178].
Figure 18
Figure 18
First appearances of pollen from cultivated plants (Zea mays and Cucurbitaceae) and charcoal amounts/patterns compatible with anthropogenic fires in Caribbean mangrove records. Raw data from Table 3 (see also Figure 15). Ch, charcoal; CP, cultivated plants; MAD, Mesoamerican Archaic Disturbance event.
Figure 19
Figure 19
Summary pollen diagrams from Mesoamerican sites showing mangrove reductions around the CHI climatic event (gray band). The occurrence of pollen from cultivated plants is indicated by red dots (Cb, Cucurbitaceae; Zm, Zea mays). All dates (calibrated from 14C dates) and ages (interpolated/extrapolated from age-depth models) are in cal kyr BP and have been taken from the original references. Charcoal is represented in concentration units (particles/mL of sediment). PZ, pollen zones. Redrawn and composed from Refs. [124,169].
Figure 20
Figure 20
Mangrove dynamics on the Colombian Caribbean coasts during the last five centuries. See Figure 19 for the location of coring sites. PZ, pollen zones. Redrawn from Refs. [149,151,153,155].

Similar articles

Cited by

References

    1. Spalding M., Kainuma M., Collins L. Wolrd Atlas of Mangroves. Routledge; London, UK: 2010.
    1. Giri C., Ochieng E., Tieszen L.L., Zhu Z., Singh A., Loveland T., Masek J., Duke N. Status and distribution of mangrove forests of the world using earth observation satellite data. Glob. Ecol. Biogeogr. 2011;20:154–159. doi: 10.1111/j.1466-8238.2010.00584.x. - DOI
    1. Bunting P., Rosenqvist A., Lucas R., Rebelo L.M., Hilarides L., Thomas N., Hardy A., Itoh T., Shimada M., Finlayson C. The Global Mangrove Watch—A New 2010 Global Baseline of Mangrove Extent. Remote Sens. 2018;10:1669. doi: 10.3390/rs10101669. - DOI
    1. Bunting P., Rosenqvist A., Hilarides L., Lucas R.M., Thomas N. Global Mangrove Watch: Updated 2010 Mangrove Forest Extent (v2.5) Remote Sens. 2022;14:1034. doi: 10.3390/rs14041034. - DOI
    1. Walker J.E., Ankersen T., Barchiesi S., Meyer C.K., Altieri A.H., Osborne T.Z., Angelini C. Governance and the mangrove commons: Advancing the cross-scale. nested framework for the global conservation and wise use of mangroves. J. Environ. Manag. 2022;312:114823. doi: 10.1016/j.jenvman.2022.114823. - DOI - PubMed

LinkOut - more resources