Cell-Type-Specific Length and Cytosolic pH Response of Superficial Cells of Arabidopsis Root to Chronic Salinity
- PMID: 36559645
- PMCID: PMC9783886
- DOI: 10.3390/plants11243532
Cell-Type-Specific Length and Cytosolic pH Response of Superficial Cells of Arabidopsis Root to Chronic Salinity
Abstract
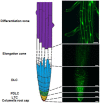
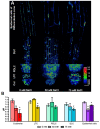
Soil salinity negatively affects the growth, development and yield of plants. Acidification of the cytosol in cells of glycophytes was reported under salinity, while various types of plant cells can have a specific reaction under the same conditions. Transgenic Arabidopsis plants expressing the pH sensor Pt-GFP in the cytosol were used in this work for determination of morphometric changes and cytosolic pH changes in the superficial cells of Arabidopsis roots under chronic salinity in vitro. We did not find changes in the length of the root cap cells, while there was a decrease in the length of the differentiation zone under 50, 75 mM NaCl and the size of the epidermal cells of the differentiation zone under 75 mM NaCl. The most significant changes of cytosolic pH to chronic salinity was noted in columella (decrease by 1 pH unit at 75 mM NaCl) and epidermal cells of the differentiation zone (decrease by 0.6 and 0.4 pH units at 50 and 75 mM NaCl, respectively). In developed lateral root cap cells, acidification of cytosol by 0.4 units occurred only under 75 mM NaCl in the medium. In poorly differentiated lateral cells of the root cap, there were no changes in pH under chronic salinity.
Keywords: Arabidopsis thaliana L.; Pt-GFP; differentiation zone; epidermal cells; pH; pH indicator; root; root cap; salinity.
Conflict of interest statement
The authors declare no conflict of interest.
Figures


Similar articles
-
The Morphological Parameters and Cytosolic pH of Cells of Root Zones in Tobacco Plants (Nicotiana tabacum L.): Nonlinear Effects of NaCl Concentrations.Plants (Basel). 2023 Oct 28;12(21):3708. doi: 10.3390/plants12213708. Plants (Basel). 2023. PMID: 37960064 Free PMC article.
-
Salinity-Induced Cytosolic Alkaline Shifts in Arabidopsis Roots Require the SOS Pathway.Int J Mol Sci. 2023 Feb 10;24(4):3549. doi: 10.3390/ijms24043549. Int J Mol Sci. 2023. PMID: 36834961 Free PMC article.
-
Sodium chloride reduces growth and cytosolic calcium, but does not affect cytosolic pH, in root hairs of Arabidopsis thaliana L.J Exp Bot. 2003 Apr;54(385):1269-80. doi: 10.1093/jxb/erg134. J Exp Bot. 2003. PMID: 12654878
-
Does salinity reduce growth in maize root epidermal cells by inhibiting their capacity for cell wall acidification?Plant Physiol. 1990 May;93(1):7-11. doi: 10.1104/pp.93.1.7. Plant Physiol. 1990. PMID: 16667468 Free PMC article.
-
Physiological and biochemical perspectives of non-salt tolerant plants during bacterial interaction against soil salinity.Plant Physiol Biochem. 2017 Jul;116:116-126. doi: 10.1016/j.plaphy.2017.05.009. Epub 2017 May 22. Plant Physiol Biochem. 2017. PMID: 28554145 Review.
Cited by
-
Growth, Physiology and Nutritional Quality of C4 Halophyte Portulaca oleracea L. Grown Aeroponically in Different Percentages of Artificial Seawater under Different Light-Emitting Diode Spectral Qualities.Plants (Basel). 2023 Sep 8;12(18):3214. doi: 10.3390/plants12183214. Plants (Basel). 2023. PMID: 37765377 Free PMC article.
-
Effect of low-dose ionizing radiation on spatiotemporal parameters of functional responses induced by electrical signals in tobacco plants.Photosynth Res. 2023 Sep;157(2-3):119-132. doi: 10.1007/s11120-023-01027-9. Epub 2023 May 21. Photosynth Res. 2023. PMID: 37210467
-
The Morphological Parameters and Cytosolic pH of Cells of Root Zones in Tobacco Plants (Nicotiana tabacum L.): Nonlinear Effects of NaCl Concentrations.Plants (Basel). 2023 Oct 28;12(21):3708. doi: 10.3390/plants12213708. Plants (Basel). 2023. PMID: 37960064 Free PMC article.
-
Unraveling the role of urea hydrolysis in salt stress response during seed germination and seedling growth in Arabidopsis thaliana.Elife. 2024 Jul 22;13:e96797. doi: 10.7554/eLife.96797. Elife. 2024. PMID: 39037769 Free PMC article.
-
The roles of DNA methylation on pH dependent i-motif (iM) formation in rice.Nucleic Acids Res. 2024 Feb 9;52(3):1243-1257. doi: 10.1093/nar/gkad1245. Nucleic Acids Res. 2024. PMID: 38180820 Free PMC article.
References
-
- Shahid S.A., Zaman M., Heng L. Guideline for Salinity Assessment, Mitigation and Adaptation Using Nuclear and Related Techniques. 1st ed. Springer International Publishing; Cham, Switzerland: 2018. Soil salinity: Historical perspectives and a world overview of the problem; pp. 43–53.
-
- Haj-Amor Z., Araya T., Kim D.-G., Bouri S., Lee J., Ghiloufi W., Yang Y., Kang H., Jhariya M.K., Banerjee A., et al. Soil salinity and its associated effects on soil microorganisms, greenhouse gas emissions, crop yield, biodiversity and desertification: A review. Sci. Total Environ. 2022;843:156946. doi: 10.1016/j.scitotenv.2022.156946. - DOI - PubMed
-
- Qadir M., Quillérou E., Nangia V., Murtaza G., Singh M., Thomas R.J., Drechsel P., Noble A.D. Economics of salt-induced land degradation and restoration. Nat. Resour. Forum. 2014;38:282–295. doi: 10.1111/1477-8947.12054. - DOI
-
- Abbas A., Khan S., Hussain N., Hanjra M.A., Akbar S. Characterizing soil salinity in irrigated agriculture using a remote sensing approach. Phys. Chem. Earth Parts ABC. 2013;55–57:43–52. doi: 10.1016/j.pce.2010.12.004. - DOI
Grants and funding
LinkOut - more resources
Full Text Sources
Miscellaneous

