. 2022 Dec 11;22(24):9709.
doi: 10.3390/s22249709.

A Mathematically Generated Noise Technique for Ultrasound Systems

Affiliations

A Mathematically Generated Noise Technique for Ultrasound Systems

Hojong Choi et al. Sensors (Basel). .

Abstract

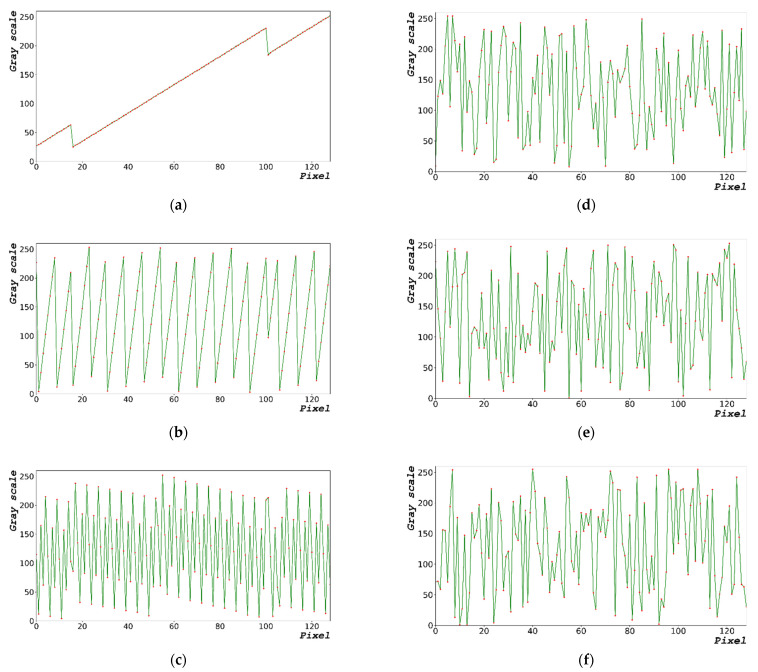
Ultrasound systems have been widely used for consultation; however, they are susceptible to cyberattacks. Such ultrasound systems use random bits to protect patient information, which is vital to the stability of information-protecting systems used in ultrasound machines. The stability of the random bit must satisfy its unpredictability. To create a random bit, noise generated in hardware is typically used; however, extracting sufficient noise from systems is challenging when resources are limited. There are various methods for generating noises but most of these studies are based on hardware. Compared with hardware-based methods, software-based methods can be easily accessed by the software developer; therefore, we applied a mathematically generated noise function to generate random bits for ultrasound systems. Herein, we compared the performance of random bits using a newly proposed mathematical function and using the frequency of the central processing unit of the hardware. Random bits are generated using a raw bitmap image measuring 1000 × 663 bytes. The generated random bit analyzes the sampling data in generation time units as time-series data and then verifies the mean, median, and mode. To further apply the random bit in an ultrasound system, the image is randomized by applying exclusive mixing to a 1000 × 663 ultrasound phantom image; subsequently, the comparison and analysis of statistical data processing using hardware noise and the proposed algorithm were provided. The peak signal-to-noise ratio and mean square error of the images are compared to evaluate their quality. As a result of the test, the min entropy estimate (estimated value) was 7.156616/8 bit in the proposed study, which indicated a performance superior to that of GetSystemTime. These results show that the proposed algorithm outperforms the conventional method used in ultrasound systems.

Keywords: mathematical function; mathematically generated noise; ultrasound system.


Conflict of interest statement

The authors declare no conflicts of interest. The funders had no role in the design of the study; in the collection, analyses, or interpretation of data; in the writing of the manuscript; or in the decision to publish the results.

Figures

Figure 1
Figure 1
Our proposed concept of an ultrasound system for consultation.
Figure 2
Figure 2
Random-bit generation result based on time: (a) 1000 × 663 random-bit generation time-series data; (b) generated random-bit trend line for dt = 0 μs; (c) 1000 × 663 random-bit generation time-series data; (d) generated random-bit trend line for dt = 1.0 μs; (e) 1000 × 663 random-bit generation time-series data; and (f) generated random-bit trend line for dt = 5.0 μs. Red dot and green line represent the distribution and time flow of the random-bit, respectively.
Figure 3
Figure 3
Random-bit generation results based on time: (a) 1000 × 663 random-bit visualization image; (b) 0–255, 8-bit entropy generation distribution diagram at dt = 0 μs; (c) 1000 × 663 random-bit visualization image; (d) 0–255, 8-bit entropy generation distribution diagram at dt = 1.0 μs; (e) 1000 × 663 random-bit visualization image; and (f) 0–255, 8-bit entropy generation distribution diagram at dt = 5.0 μs.
Figure 3
Figure 3
Random-bit generation results based on time: (a) 1000 × 663 random-bit visualization image; (b) 0–255, 8-bit entropy generation distribution diagram at dt = 0 μs; (c) 1000 × 663 random-bit visualization image; (d) 0–255, 8-bit entropy generation distribution diagram at dt = 1.0 μs; (e) 1000 × 663 random-bit visualization image; and (f) 0–255, 8-bit entropy generation distribution diagram at dt = 5.0 μs.
Figure 4
Figure 4
Randomized ultrasound abdomen phantom images: (a) ultrasound image; (b) 1000 × 663 random-bit generation visualization image; (c) randomized ultrasound image at dt = 0.5 μs; (d) ultrasound image; (e) 1000 × 663 random-bit generation visualization image; (f) randomized ultrasound image at dt = 1 μs; (g) ultrasound image; (h) 1000 × 663 random-bit generation visualization image; and (i) randomized ultrasound image at dt = 5.0 μs.
Figure 4
Figure 4
Randomized ultrasound abdomen phantom images: (a) ultrasound image; (b) 1000 × 663 random-bit generation visualization image; (c) randomized ultrasound image at dt = 0.5 μs; (d) ultrasound image; (e) 1000 × 663 random-bit generation visualization image; (f) randomized ultrasound image at dt = 1 μs; (g) ultrasound image; (h) 1000 × 663 random-bit generation visualization image; and (i) randomized ultrasound image at dt = 5.0 μs.
Figure 5
Figure 5
(a) Mathematical continuous periodic function; and (b) discontinuous periodic function.
Figure 6
Figure 6
(a) Determination of independent variables at regular intervals (dx) for generating random bits in periodic functions; and (b) set of non-overlapping dependent variables based on selected independent variables.
Figure 7
Figure 7
Periodic functions yielded using designed algorithms at (a) dx = 0.1156 rad, (b) dx = 0.2312 rad, and (c) dx = 1.1560 rad.
Figure 8
Figure 8
Random-bit generation result in radian: (a) 1000 × 663 random-bit generation time-series data; (b) trend line of Figure 8a for dX = 0.1156 rad; (c) 1000 × 663 random-bit generation time-series data; (d) trend line of Figure 8c for dx = 0.2312 rad; (e) 1000 × 663 random-bit generation time-series data; and (f) trend line of Figure 8c for dx = 1.1560 rad.
Figure 8
Figure 8
Random-bit generation result in radian: (a) 1000 × 663 random-bit generation time-series data; (b) trend line of Figure 8a for dX = 0.1156 rad; (c) 1000 × 663 random-bit generation time-series data; (d) trend line of Figure 8c for dx = 0.2312 rad; (e) 1000 × 663 random-bit generation time-series data; and (f) trend line of Figure 8c for dx = 1.1560 rad.
Figure 9
Figure 9
Random-bit generation result based on time: (a) image of random-bit generation measuring 1000 × 663; (b) distribution diagram chart of entropy generation with size ranging from of 0 to 255 and 8 bits at dx = 0.1156 rad; (c) image of random-bit generation measuring 1000 × 663; (d) distribution diagram chart of entropy generation with size ranging from 0 to 255 and 8 bits at dx = 0.2312 rad; (e) image of random-bit generation measuring 1000 × 663; and (f) distribution diagram chart of entropy generation with size ranging from 0 to 255 and 8 bits at dx = 1.1560 rad.
Figure 10
Figure 10
Randomization of abdomen phantom image: (a) ultrasound image; (b) 1000 × 663 random-bit generation visualization image; (c) randomized ultrasound image for dx = 0.1156 rad; (d) ultrasound image; (e) 1000 × 663 random-bit generation visualization image; (f) randomized ultrasound image for dx = 0.2312 rad; (g) ultrasound image; (h) 1000 × 663 random-bit generation visualization image; and (i) randomized ultrasound image for dx = 1.156 rad.
Figure 11
Figure 11
Comparison data for encrypting performance. Enlarged sections of Figures (a) 2b, (b) 2d, and (c) 2f. Enlarged sections of Figures (d) 8b, (e) 8d, and (f) 8f within 0–128 pixels.
Figure 12
Figure 12
(a) Obtained original ultrasound image and enlarged images of (b) Figure 4i and (c) Figure 10i.

References

    1. Shung K.K., Thieme G.A. Ultrasonic Scattering in Biological Tissues. CRC Press; Boca Raton, FL, USA: 1992.
    1. Huang B., Shung K.K. Characterization of high-frequency, single-element focused transducers with wire target and hydrophone. IEEE Trans. Ultrason. Ferroelectr. Freq. Control. 2005;52:1608–1612. doi: 10.1109/TUFFC.2005.1516034. - DOI - PMC - PubMed
    1. Duan S., Liu L., Chen Y., Yang L., Zhang Y., Wang S., Hao L., Zhang L. A 5G-powered robot-assisted teleultrasound diagnostic system in an intensive care unit. Crit. Care. 2021;25:134. doi: 10.1186/s13054-021-03563-z. - DOI - PMC - PubMed
    1. Moore C.L., Copel J.A. Point-of-care Ultrasonography. N. Engl. J. Med. 2011;364:749–757. doi: 10.1056/NEJMra0909487. - DOI - PubMed
    1. Brunner E. How ultrasound system considerations influence front-end component choice. Analog Dialogue. 2002;36:1–4.