. 2022 Dec 14;22(24):9799.
doi: 10.3390/s22249799.

A Tiled Ultrasound Matrix Transducer for Volumetric Imaging of the Carotid Artery

Affiliations

A Tiled Ultrasound Matrix Transducer for Volumetric Imaging of the Carotid Artery

Djalma Simões Dos Santos et al. Sensors (Basel). .

Abstract

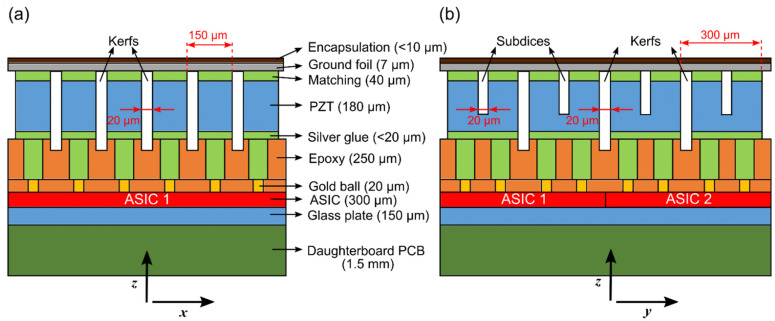
High frame rate three-dimensional (3D) ultrasound imaging would offer excellent possibilities for the accurate assessment of carotid artery diseases. This calls for a matrix transducer with a large aperture and a vast number of elements. Such a matrix transducer should be interfaced with an application-specific integrated circuit (ASIC) for channel reduction. However, the fabrication of such a transducer integrated with one very large ASIC is very challenging and expensive. In this study, we develop a prototype matrix transducer mounted on top of multiple identical ASICs in a tiled configuration. The matrix was designed to have 7680 piezoelectric elements with a pitch of 300 μm × 150 μm integrated with an array of 8 × 1 tiled ASICs. The performance of the prototype is characterized by a series of measurements. The transducer exhibits a uniform behavior with the majority of the elements working within the -6 dB sensitivity range. In transmit, the individual elements show a center frequency of 7.5 MHz, a -6 dB bandwidth of 45%, and a transmit efficiency of 30 Pa/V at 200 mm. In receive, the dynamic range is 81 dB, and the minimum detectable pressure is 60 Pa per element. To demonstrate the imaging capabilities, we acquired 3D images using a commercial wire phantom.

Keywords: application-specific integrated circuit (ASIC); carotid artery; high-frame rate; lead zirconate titanate (PZT); matrix array; three-dimensional (3D); ultrasound imaging; ultrasound transducer.


Conflict of interest statement

The authors declare no conflict of interest.

Figures

Figure A1
Figure A1
Relation between the input and output of the Verasonics V1 system for several TGC gains at 7.5 MHz.
Figure A2
Figure A2
Assumptions for crosstalk simulations. (a) Electrical crosstalk. (b) Acoustical crosstalk via an attenuating medium. (c) Acoustical crosstalk via a non-attenuating medium.
Figure A3
Figure A3
Directivity pattern along the x-direction. (a) Effect of individual crosstalks. (b) Effect of the combined crosstalk.
Figure 1
Figure 1
Schematic drawing of the envisioned full matrix transducer (right), together with a single ASIC transducer with PZT elements mounted on top (left).
Figure 2
Figure 2
Example imaging schemes determined by different transmit and receive element configurations. (a) Plane-wave imaging. (b) Dynamic linear array. (c) Random pattern imaging.
Figure 3
Figure 3
Block diagram of the architecture of a single ASIC.
Figure 4
Figure 4
Overview of the acoustic stack (not drawn to scale). (a) Front view. (b) Side view. The numbers in parenthesis indicate the dimension in the z-direction (i.e., thickness).
Figure 5
Figure 5
Photograph of the prototype transducer. (a) Fabrication of the PZT matrix with 96 × 80 (rows × columns) elements on top of 8 × 1 tiled ASICs. (b) The finished transducer on the daughterboard.
Figure 6
Figure 6
Acoustical measurement setup. (a) Transmit characterization. (b) Receive characterization. (c) Imaging using a CIRS phantom.
Figure 7
Figure 7
Sensitivity variation across the transducer elements. (a) Transmit sensitivity. (b) Receive sensitivity. (c) Transmit sensitivity histogram. (d) Receive sensitivity histogram.
Figure 8
Figure 8
(a) Time and frequency domain response for a single element. (b) Close-up look at the second pulse.
Figure 9
Figure 9
Time and frequency domain responses for all elements. (a) Envelope of the time signals. (b) Frequency spectrum.
Figure 10
Figure 10
Measured and simulated directivity pattern in transmit. (a) Along the x-direction. (b) Along the y-direction.
Figure 11
Figure 11
The relation between the received pressure and ASIC output voltage for different gain settings.
Figure 12
Figure 12
(a) Scheme of the wire phantom and numbered wires (the dashed rectangle depicts the field of view of the transducer). The reconstructed (b) 2D and (c) 3D images.
Figure 13
Figure 13
The axial and lateral FWHM for different wires in different elevation planes.

References

    1. Dakok K.K., Matjafri M.Z., Suardi N., Oglat A.A., Nabasu S.E. A Review of Carotid Artery Phantoms for Doppler Ultrasound Applications. J. Med. Ultrasound. 2021;29:157–166. doi: 10.4103/JMU.JMU_164_20. - DOI - PMC - PubMed
    1. Delcker A., Tegeler C. Influence of ECG-Triggered Data Acquisition on Reliability for Carotid Plaque Volume Measurements with a Magnetic Sensor Three-Dimensional Ultrasound System. Ultrasound Med. Biol. 1998;24:601–605. doi: 10.1016/S0301-5629(98)00012-X. - DOI - PubMed
    1. Kruizinga P., Mastik F., de Jong N., van der Steen A.F.W., van Soest G. High Frame Rate Ultrasound Imaging of Human Carotid Artery Dynamics; Proceedings of the 2012 IEEE International Ultrasonics Symposium; Dresden, Germany. 7–10 October 2012; pp. 1177–1180.
    1. Landry A., Spence J.D., Fenster A. Measurement of Carotid Plaque Volume by 3-Dimensional Ultrasound. Stroke. 2004;35:864–869. doi: 10.1161/01.STR.0000121161.61324.ab. - DOI - PubMed
    1. Spence J.D., Eliasziw M., DiCicco M., Hackam D.G., Galil R., Lohmann T. Carotid Plaque Area. Stroke. 2002;33:2916–2922. doi: 10.1161/01.STR.0000042207.16156.B9. - DOI - PubMed

LinkOut - more resources