. 2022 Dec 19;22(24):9994.
doi: 10.3390/s22249994.

Plasmonic Sensors beyond the Phase Matching Condition: A Simplified Approach

Affiliations

Plasmonic Sensors beyond the Phase Matching Condition: A Simplified Approach

Alessandro Tuniz et al. Sensors (Basel). .

Abstract

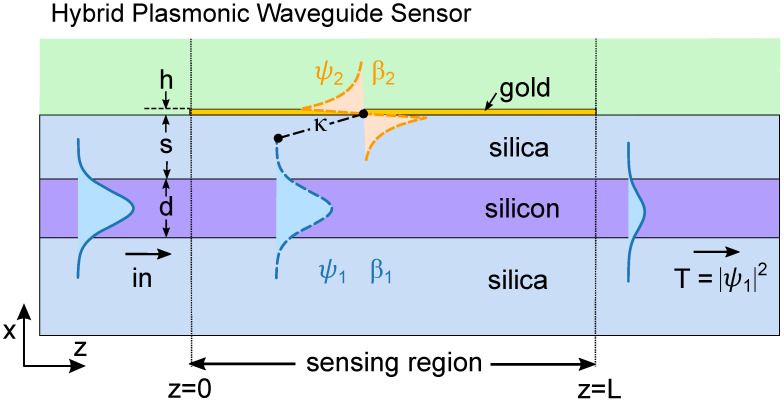
The conventional approach to optimising plasmonic sensors is typically based entirely on ensuring phase matching between the excitation wave and the surface plasmon supported by the metallic structure. However, this leads to suboptimal performance, even in the simplest sensor configuration based on the Otto geometry. We present a simplified coupled mode theory approach for evaluating and optimizing the sensing properties of plasmonic waveguide refractive index sensors. It only requires the calculation of propagation constants, without the need for calculating mode overlap integrals. We apply our method by evaluating the wavelength-, device length- and refractive index-dependent transmission spectra for an example silicon-on-insulator-based sensor of finite length. This reveals all salient spectral features which are consistent with full-field finite element calculations. This work provides a rapid and convenient framework for designing dielectric-plasmonic sensor prototypes-its applicability to the case of fibre plasmonic sensors is also discussed.

Keywords: coupled mode theory; directional coupling; fibre sensors; hybrid plasmonic waveguides; photonic integrated circuits; plasmonics; sensors.


Conflict of interest statement

The authors declare no conflict of interest.

Figures

Figure 1
Figure 1
Concept schematic of the challenge of calculating resonances in plasmonic sensors. (a) The simple Otto configuration relies on monitoring the reflectivity R of plane waves propagating in semi-infinite media as a function of angle θ. At the angle θSPP a SPP is excited. (b) θ-dependent reflectance spectrum for na=1, λ=800nm, and w as labelled. Also shown is the full colourmap of the reflectance as a function of θ and w for (c) na=1 and (d) na=1.33. Note that the spectral maps are subtly dependent on both na and w.
Figure 2
Figure 2
Schematic of the HPWG sensor and the coupled mode theory picture. The modes in the dielectric and plasmonic regions, ψ1 and ψ2 respectively, couple linearly as described by Equation (6). The power in the dielectric at output is given by T=|ψ1|2. The periodic exchange of power between waveguides can lead to a resonant spectrum that in general depends on both the length of the device L and the analyte index na [25].
Figure 3
Figure 3
Effective index neff=β/k0 as a function of wavelength for the geometry shown in Figure 2 when (a) na=1.3, (b) na=1.4, (c) na=1.5 in the lossless case. The dashed line shows the isolated plasmonic- and dielectric- modes, respectively. The solid lines show the hybrid eigenmodes. (df) show the associated calculated coupling coefficients, following the simple expression in Equation (8) (black line). Top row shows a schematic of the magnetic field for the plotted isolated- or hybrid-/super-modes.
Figure 4
Figure 4
Real part of the effective index e(neff)=e(β/k0) as a function of wavelength for the geometry shown in Figure 2 when (a) na=1.3, (b) na=1.4, (c) na=1.5, using the lossy Drude model for the gold permittivity. The dashed line shows the isolated plasmonic- and dielectric- modes, respectively. The solid lines show the hybrid eigenmodes according to the “exact” solution (dark) and obtained from CMT via the eigenvalues of Equation (9) (light). (df) show the associated m(neff).
Figure 5
Figure 5
Transmitted power by the plasmonic sensor as a function of λ and na for L=10μm using (a) CMT, and (b) FEM. (c,d): same as (a,b) for L=15μm. (e,f): same as (a,b) for L=20μm. (g,h): same as (a,b) for L=50μm. EP: exceptional point.
Figure 6
Figure 6
Calculated colour maps of (a) |β1β2R|/k0+|κβ2I/2|/k0 using CMT and (b) |β1˜β2˜|/k0 using the exact supermodes. The global minima in the phase space show the location of the exceptional point using our CMT model and the exact solution, as per Equations (10) and (11).
Figure 7
Figure 7
(a) Green (right axis): phase matching wavelength λPM where β1=β2R, and associated half beat length Lb according to the supermodes obtained with CMT (orange) and “exact” calculations (blue). (b) Associated absorption length La. Solid lines indicate the average La=(La1+La2)/2; shaded regions encompass the La1 and La2 boundaries.
Figure 8
Figure 8
(a) Transmission spectrum using the “conventional” approach of Equation (14), as a function of wavelength, for the three analyte indices as labelled, using L=10μm. Also shown are the resonant wavelength λR, corresponding to the spectral minimum and the δλ, corresponding to the FWHM. (b) Associated λR vs. na (green circles, left axis), second order polynomial fit (green line), and resulting sensitivity S (orange line, right axis.) Also shown in (c) are the δλ vs. na (orange curve, left axis) and the total FOM = S/δλ. (df): same as (ac), obtained from the CMT approach, using a subset of the data shown in Figure 5a as labelled. (gi): same as (df), obtained from FEM calculations, using a subset of the data shown in Figure 5b as labelled.

References

    1. Guo X. Surface plasmon resonance based biosensor technique: A review. J. Biophotonics. 2012;5:483–501. doi: 10.1002/jbio.201200015. - DOI - PubMed
    1. Chung T., Lee S.Y., Song E.Y., Chun H., Lee B. Plasmonic nanostructures for nano-scale bio-sensing. Sensors. 2011;11:10907–10929. doi: 10.3390/s111110907. - DOI - PMC - PubMed
    1. Coskun A.F., Cetin A.E., Galarreta B.C., Alvarez D.A., Altug H., Ozcan A. Lensfree optofluidic plasmonic sensor for real-time and label-free monitoring of molecular binding events over a wide field-of-view. Sci. Rep. 2014;4:6789. doi: 10.1038/srep06789. - DOI - PMC - PubMed
    1. Beuwer M.A., Prins M.W., Zijlstra P. Stochastic protein interactions monitored by hundreds of single-molecule plasmonic biosensors. Nano Lett. 2015;15:3507–3511. doi: 10.1021/acs.nanolett.5b00872. - DOI - PubMed
    1. Im H., Shao H., Park Y.I., Peterson V.M., Castro C.M., Weissleder R., Lee H. Label-free detection and molecular profiling of exosomes with a nano-plasmonic sensor. Nat. Biotechnol. 2014;32:490–495. doi: 10.1038/nbt.2886. - DOI - PMC - PubMed

LinkOut - more resources