. 2023 Mar;150(3):269-285.
doi: 10.1017/S003118202200172X. Epub 2022 Dec 23.

Cyclospora cayetanensis comprises at least 3 species that cause human cyclosporiasis

Affiliations

Cyclospora cayetanensis comprises at least 3 species that cause human cyclosporiasis

Joel Leonard Nicholas Barratt et al. Parasitology. 2023 Mar.

Abstract

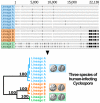
The apicomplexan parasite Cyclospora cayetanensis causes seasonal foodborne outbreaks of the gastrointestinal illness cyclosporiasis. Prior to the coronavirus disease-2019 pandemic, annually reported cases were increasing in the USA, leading the US Centers for Disease Control and Prevention to develop a genotyping tool to complement cyclosporiasis outbreak investigations. Thousands of US isolates and 1 from China (strain CHN_HEN01) were genotyped by Illumina amplicon sequencing, revealing 2 lineages (A and B). The allelic composition of isolates was examined at each locus. Two nuclear loci (CDS3 and 360i2) distinguished lineages A and B. CDS3 had 2 major alleles: 1 almost exclusive to lineage A and the other to lineage B. Six 360i2 alleles were observed – 2 exclusive to lineage A (alleles A1 and A2), 2 to lineage B (B1 and B2) and 1 (B4) was exclusive to CHN_HEN01 which shared allele B3 with lineage B. Examination of heterozygous genotypes revealed that mixtures of A- and B-type 360i2 alleles occurred rarely, suggesting a lack of gene flow between lineages. Phylogenetic analysis of loci from whole-genome shotgun sequences, mitochondrial and apicoplast genomes, revealed that CHN_HEN01 represents a distinct lineage (C). Retrospective examination of epidemiologic data revealed associations between lineage and the geographical distribution of US infections plus strong temporal associations. Given the multiple lines of evidence for speciation within human-infecting Cyclospora, we provide an updated taxonomic description of C. cayetanensis, and describe 2 novel species as aetiological agents of human cyclosporiasis: Cyclospora ashfordi sp. nov. and Cyclospora henanensis sp. nov. (Apicomplexa: Eimeriidae).

Keywords: Cyclospora ashfordi; Cyclospora cayetanensis; Cyclospora henanensis; epidemiology; genotyping; speciation.


Figures
None
Graphical abstract
Fig. 1.
Fig. 1.
Population structure of Cyclospora cayetanensis. This hierarchical tree was generated from a distance matrix computed using Barratt's heuristic definition of genetic distance, including 651 genotypes that had been filtered for strain pureness and genotype completeness. Two distinct populations are supported: lineage A (blue) and lineage B (orange). Strain CHN_HEN01 from Henan, China was clustered alongside 650 American isolates, and its final position within the resultant hierarchical tree supports that it shares some genetic features with lineage B. Despite this, strain CHN_HEN01 clustered as a singleton supporting that it also possesses some unique genetic characters not observed in American isolates.
Fig. 2.
Fig. 2.
Reconstructing full-length 360i2 alleles and assessing their phylogenetic relationship. The CYCLONE workflow divides the 360i2 amplicon into 6 segments (panel A – segments A–F) and haplotypes are defined separately at each segment. Reconstruction of full-length A-lineage alleles was trivial as a difference only exists at segment C (light green). For lineage B, multiple haplotypes were observed at segments C, D and E. Reconstruction of full-length B-lineage alleles was relatively simple as multiple B-lineage genotypes were homozygous at this locus (Table 2). Full-length alleles were aligned using MUSCLE aligner and a schematic of this alignment was generated using Geneious Prime (panel B). Each allele is shown as a horizontal track, conserved bases are shown in grey and SNPs that differ to the consensus are shown in black. This alignment was used to generate a UPGMA phylogeny (panel C) based on the Jukes–Cantor model, with 1000 bootstrap replicates. Bootstrap percentages are shown on nodes. The scale bar represents numbers of substitutions per site. Panel C shows that haplotypes A1 and A2 share a closer phylogenetic relationship to each other than to the 4 B-type alleles, which form their own distinct clade. The sequence of each haplotype is provided in File S2.
Fig. 3.
Fig. 3.
Alignment of concatenated sequences from several loci and the Mt genome (A) and the resulting phylogeny (B). This phylogeny (panel B) was generated by concatenating several loci extracted from published WGS sequences to Mt genomes of representative isolates of lineage A, lineage B and strain CHN_HEN01. The loci were concatenated in the following order to produce the alignment in panel A generated in Geneious Prime: Mt genome excluding the junction (positions 1–6020), beta-tubulin paralogue 1 (6021–6878), cyc_06182-t31_1 (6879–8345), cyc_06177-t31_1 (8346–12 999), cyc_06176-t31_1 (1300–16 446), 360i2 part A (16 447–16 546) and 360i2 part F (16 547–16 656). Sequences were aligned using MUSCLE. Sequences obtained for each lineage are shown as a horizontal track, conserved bases are shown in grey and SNP's that differ to the consensus are shown in black. Gaps are represented by a dash. This alignment was used to generate a UPGMA phylogeny (panel B) based on the Jukes–Cantor model, with 1000 bootstrap replicates. A bootstrap percentage (100%) is shown on the single node, and the scale bar represents the number of substitutions per site.
Fig. 4.
Fig. 4.
Alignment of concatenated sequences from several loci and partial apicoplast sequences (A) and the resulting phylogeny (B) for several isolates. This phylogeny (panel B) was generated by concatenating 2 protein-coding loci extracted from published C. cayetanensis WGS sequences to partial apicoplast genome sequences from the same isolates. These loci were concatenated in the following order to produce the alignment in panel A using Geneious Prime: partial apicoplast genome (positions 1–17 987), putative cysteine protease cyc_00943 (17 988–19 550) and partial sequence of polyamine-modulated factor 1-binding protein 1 – locus LOC34622638 (19 551–22 138). Sequences were aligned using MUSCLE. Each sequence is shown as a horizontal track, conserved bases are shown in grey and SNP's that differ to the consensus are shown in black. Gaps are represented by a dash. This alignment was used to generate a UPGMA phylogeny (panel B) based on the Jukes–Cantor model, with 1000 bootstrap replicates. A bootstrap percentage (100%) is shown on major nodes, and the scale represents the number of substitutions per site. Two sets of sequences obtained for strain CHN_HEN01 were generated from the same material (i.e. technical sequencing replicates – Table 1).
Fig. 5.
Fig. 5.
Phylogenetic reconstruction based on large segments of the Nu genome. Several large segments of the Cyclospora Nu genome were concatenated for 11 Cyclospora isolates. These concatenated genomic segments (~1.02 million bases) were aligned using LASTZ. Genetic distances were computed using the Jukes–Cantor model and a neighbour-joining tree was generated with 1000 bootstrap replicates (panel A). This tree includes 5 isolates assigned to lineages A (blue) and B (orange) based on their possession of A-type or B-type 360i2 alleles, in addition to the 2 sequenced genomes (technical replicates) of strain CHN_HEN01 (green) which cluster as the outgroup. The scale bar represents the number of substitutions per site and bootstrap values are shown on nodes. Two technical (sequencing) replicates of strain CDC:HCNY16:01 included in this analysis are essentially identical supporting the accuracy of these sequences. The precise genomic regions that were concatenated (relative to reference strain CHN_HEN01, GenBank Assembly accession: ASM289330v1) are provided in File S2. Patristic distances were extracted from this phylogeny and average patristic distances between different groups of Cyclospora were calculated. Results are represented as a bar chart (panel B). The average distance between isolates of the same lineage is small while the average distance between isolates of different lineages is substantially larger, with the most genetically disparate being lineage C (strain CHN_HEN01). Average patristic distance values are shown above each bar, and error bars represent 1 standard deviation.
Fig. 6.
Fig. 6.
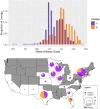
Weekly incidence of cyclosporiasis illness onset and geographical distribution of reported cases attributed to C. cayetanensis from lineages A and B over the 2018–2020 cyclosporiasis peak periods. Top (histogram): Dates of illness onset were obtained from CNHGQ data over the 2018–2020 cyclosporiasis peak periods and consolidated into 1 incidence curve by week of illness onset in a side-by-side bar chart. Bar heights indicate the proportions of all cases within a lineage, reporting symptom onsets over a 7-day interval. Proportions are displayed because showing absolute weekly case numbers would mask differences between lineages A (purple) and B (orange) due to the large difference in total numbers of case-patients infected with lineage A vs B. Bottom (map): This map shows the distribution of genotyped C. cayetanensis isolates from US states reporting cyclosporiasis cases between 2018 and 2020. The pie charts show the relative proportions of each lineage within a state, with lineage A shown in purple and lineage B in orange. No data were obtained from states shaded in grey (i.e. no cases were reported, no specimens were submitted for genotyping or cases/genotypes from these states did not meet the inclusion criteria for this analysis). The size of circles reflects the number of genotyped specimens. Note that no genotyping data were obtained from Alaska or Hawaii.
Fig. 7.
Fig. 7.
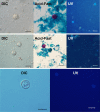
Micrographs of unsporulated oocysts of C. cayetanensis lineages A, B and C. Unsporulated oocysts as shown under DIC microscopy (1000×, scale bar 10 μm), on modified acid-fast (Kinyoun) stained smears (1000×, scale bar 10 μm), and under a UV fluorescence microscope (500×, scale bar 20 μm). Top row is lineage A (isolate CTN10041_20), middle row is lineage B (isolate CGA10451_20) and bottom row is lineage C (strain CHN_HEN01). Only UV and DIC images are shown for strain CHN_HEN01 due to limited oocyst material.

References

    1. Almeria S, Cinar HN and Dubey JP (2019) Cyclospora cayetanensis and cyclosporiasis: an update. Microorganisms 7, 317. doi: 10.3390/microorganisms7090317 - DOI - PMC - PubMed
    1. Anonymous CfDCaP (1997) Update: outbreaks of cyclosporiasis – United States and Canada, 1997. MMWR. Morbidity and Mortality Weekly Report 46, 521–523. - PubMed
    1. Ashford RW (1979) Occurrence of an undescribed coccidian in man in Papua New Guinea. Annals of Tropical Medicine & Parasitology 73, 497–500. - PubMed
    1. Babiker HA, Ranford-Cartwright LC, Currie D, Charlwood JD, Billingsley P, Teuscher T and Walliker D (1994) Random mating in a natural population of the malaria parasite Plasmodium falciparum. Parasitology 109, 413–421. - PubMed
    1. Barratt JLN and Sapp SGH (2020) Machine learning-based analyses support the existence of species complexes for Strongyloides fuelleborni and Strongyloides stercoralis. Parasitology 147, 1184–1195. doi: 10.1017/S0031182020000979 - DOI - PMC - PubMed

Publication types