

Low HDL-cholesterol levels predict hepatocellular carcinoma development in individuals with liver fibrosis
- PMID: 36561127
- PMCID: PMC9763866
- DOI: 10.1016/j.jhepr.2022.100627
Low HDL-cholesterol levels predict hepatocellular carcinoma development in individuals with liver fibrosis
Abstract
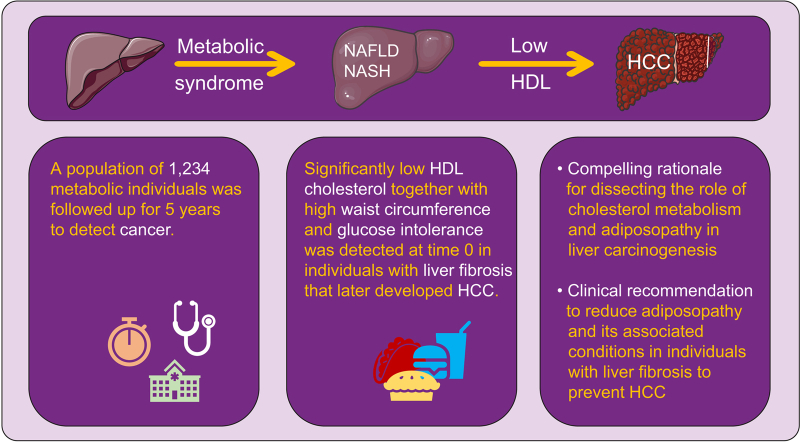
Background & aims: Dysmetabolic conditions could drive liver fibrosis in patients with non-alcoholic fatty liver disease (NAFLD), increasing susceptibility to hepatocellular carcinoma (HCC). We therefore aimed to identify novel predictive biomarkers of HCC in patients with and without liver fibrosis.
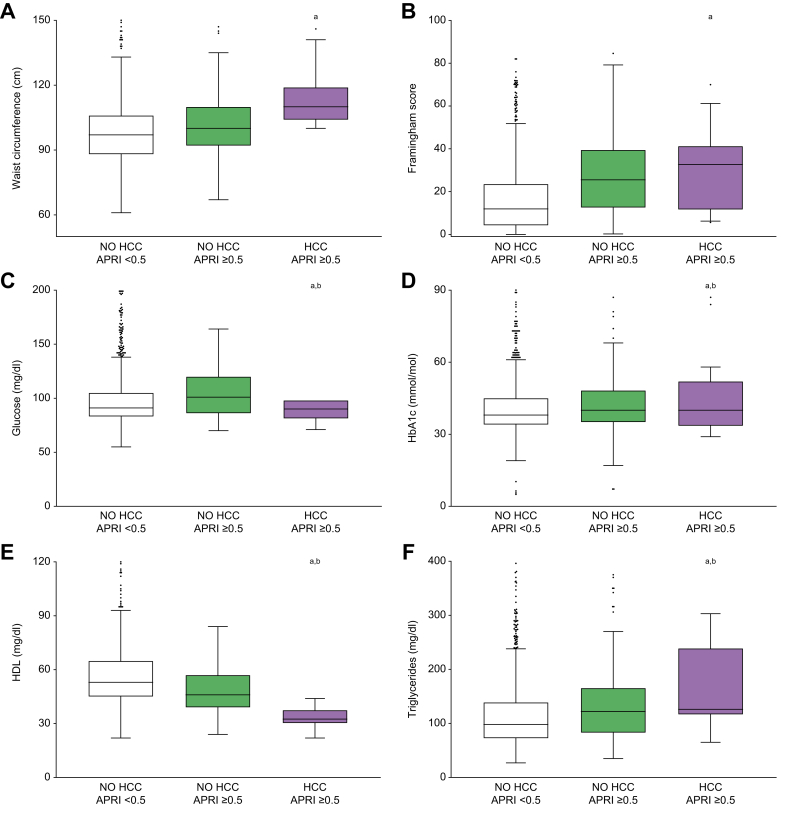
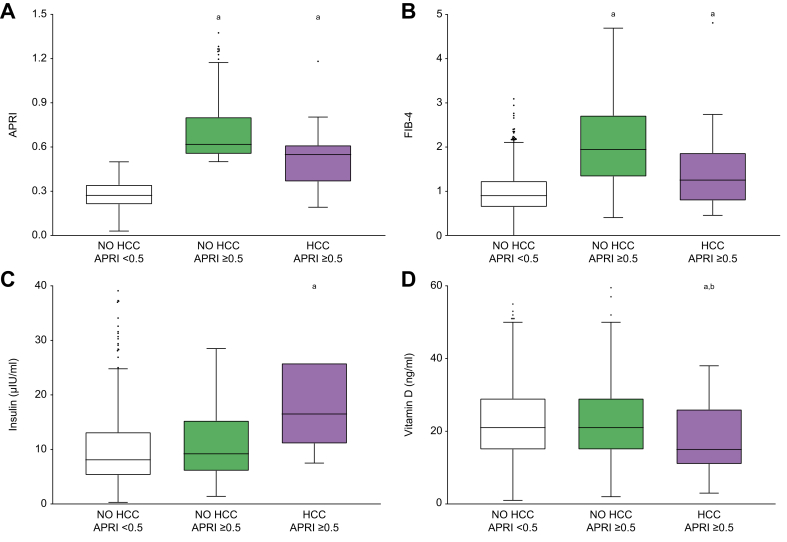
Methods: A total of 1,234 patients with putative metabolic conditions and NAFLD were consecutively assessed in our outpatient clinic. Clinical and biochemical data were recorded, and then liver ultrasonography was performed annually for 5 years to detect HCC onset. For the analysis, the population was first divided according to HCC diagnosis; then a further subdivision of those who did not develop HCC was performed based on the presence or absence of liver fibrosis at time 0.
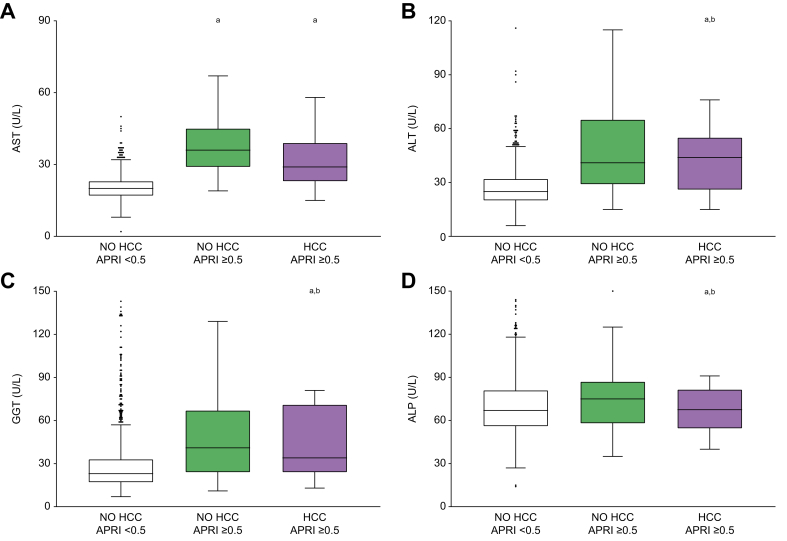
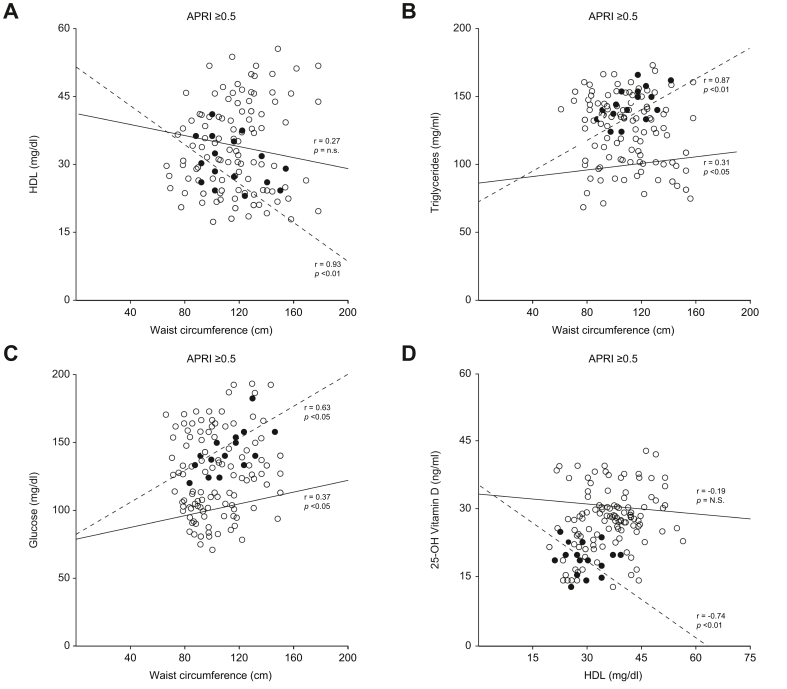
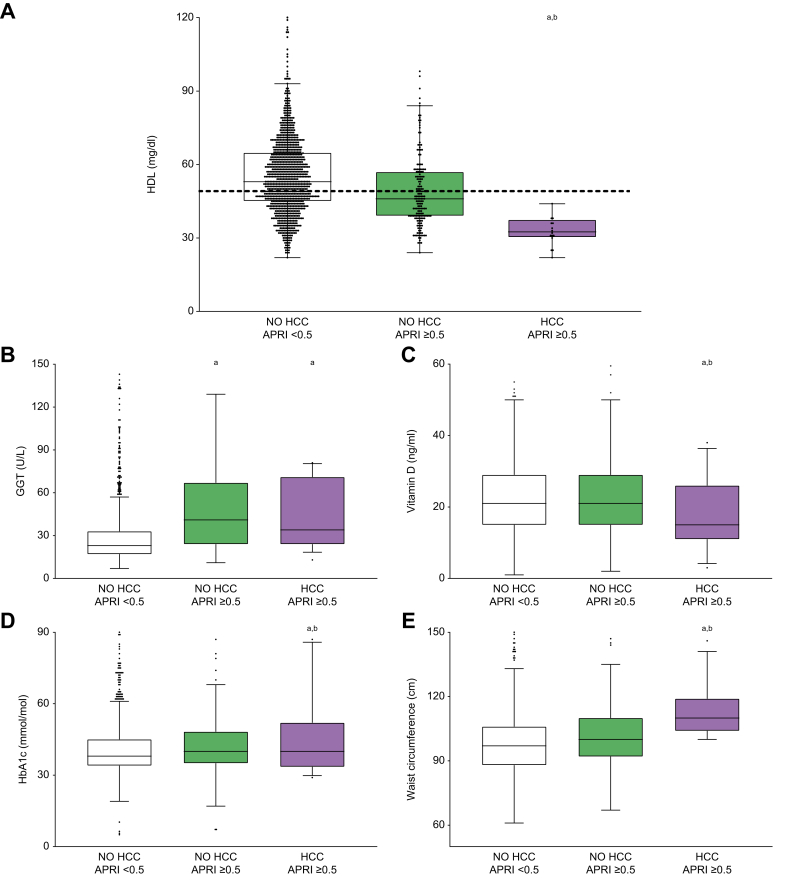
Results: Sixteen HCC cases were recorded in 5 years. None of our patients had been diagnosed with cirrhosis before HCC was detected. Compared to patients who did not develop HCC, those who did had higher liver transaminases and fibrosis scores at time 0 (p <0.001). In addition, they presented with increased glycated haemoglobin levels and lower 25-OH vitamin D levels (p <0.05). Intriguingly, patients with higher liver fibrosis scores who subsequently developed HCC had lower HDL-cholesterol (HDL-c) levels at time 0 (p <0.001). Furthermore, in the 484 patients presenting with lower HDL-c at baseline, we found that waist circumference, and then vitamin D and glycated haemoglobin levels, were significantly different in those who developed HCC, regardless of liver fibrosis (p <0.05).
Conclusions: This study identifies HDL-c as a bona fide novel marker to predict HCC in patients with NAFLD. Increased waist circumference and deranged metabolic pathways represent additional predisposing factors among patients with low HDL-c, highlighting the importance of studying cholesterol metabolism and integrating clinical approaches with dietary regimens and a healthy lifestyle to prevent HCC.
Impact and implications: Visceral adiposity and its associated conditions, such as chronic inflammation and insulin resistance, may play a pivotal role in hepatocellular carcinoma development in patients with non-alcoholic fatty liver disease. We provide new insights on the underlying mechanisms of its pathogenesis, shedding light on the involvement of low levels of "good" HDL-cholesterol. We recommend integrating dietary regimens and advice on healthy lifestyles into the clinical management of non-alcoholic fatty liver disease, with the goal of reducing the incidence of hepatocellular carcinoma.
Keywords: ALP, alkaline phosphatase; ALT, alanine aminotransferase; APRI score; APRI, AST-to-platelet ratio index; AST, aspartate aminotransferase; CVR, cardiovascular risk; FA, fatty acid; FIB-4, fibrosis-4; GGT, gamma-glutamyltransferase; HCC, hepatocellular carcinoma; HDL-c, HDL-cholesterol; HbA1c, glycated haemoglobin; LXRs, liver X receptors; MetS, metabolic syndrome; Metabolic syndrome; NAFLD; NAFLD, non-alcoholic fatty liver disease; NASH; NASH, non-alcoholic steatohepatitis; RCT, reverse cholesterol transport; TG, triglyceride; Vitamin D; WC, waist circumference; Waist circumference.
© 2022 The Author(s).
Conflict of interest statement
The authors declare no conflict of interest. Please refer to the accompanying ICMJE disclosure forms for further details.
Figures
References
-
- Forner A., Reig M., Bruix J. Hepatocellular carcinoma. The Lancet. 2018;391:1301–1314. - PubMed
-
- Calle E.E., Rodriguez C., Walker-Thurmond K., Thun M.J. Overweight, obesity, and mortality from cancer in a prospectively studied cohort of U.S. adults. N Engl J Med. 2003;348:1625–1638. - PubMed
-
- Chalasani N., Younossi Z., Lavine J.E., Charlton M., Cusi K., Rinella M., et al. The diagnosis and management of nonalcoholic fatty liver disease: practice guidance from the American Association for the Study of Liver Diseases. Hepatology. 2018;67:328–357. - PubMed
-
- Nderitu P., Bosco C., Garmo H., Holmberg L., Malmström H., Hammar N., et al. The association between individual metabolic syndrome components, primary liver cancer and cirrhosis: a study in the Swedish AMORIS cohort: association between individual MetS components, PLC and Cirrhosis. Int J Cancer. 2017;141:1148–1160. - PubMed
LinkOut - more resources
Full Text Sources
Miscellaneous
