

Mediating effect of pubertal stages on the family environment and neurodevelopment: An open-data replication and multiverse analysis of an ABCD Study®
- PMID: 36561641
- PMCID: PMC9770593
- DOI: 10.1016/j.ynirp.2022.100133
Mediating effect of pubertal stages on the family environment and neurodevelopment: An open-data replication and multiverse analysis of an ABCD Study®
Abstract
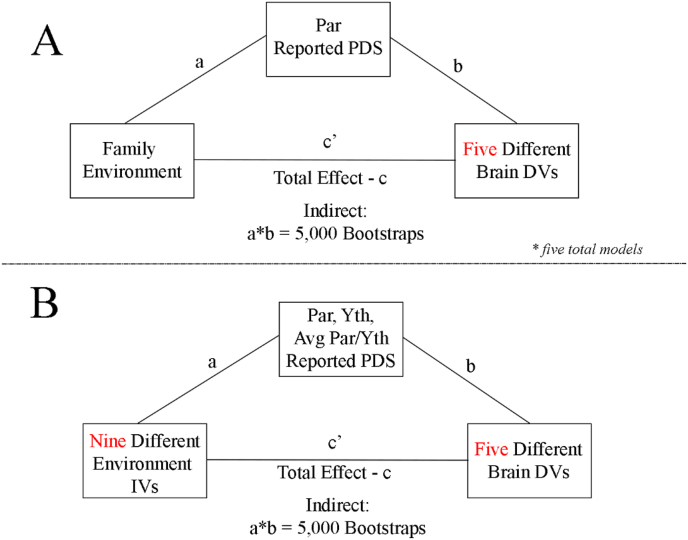
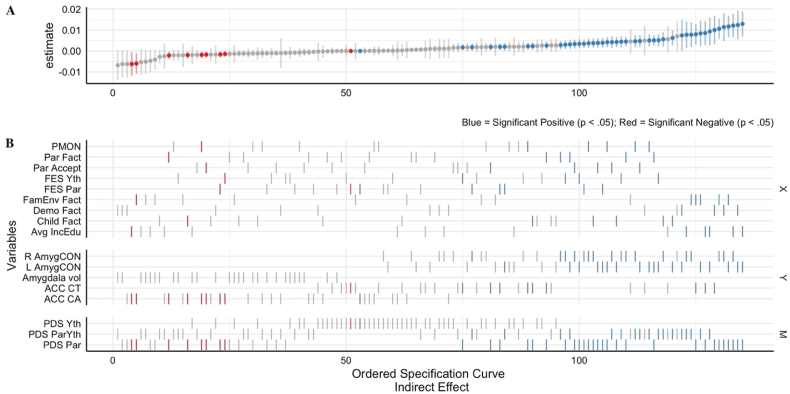
Increasing evidence demonstrates that environmental factors meaningfully impact the development of the brain (Hyde et al., 2020; McEwen and Akil, 2020). Recent work from the Adolescent Brain Cognitive Development (ABCD) Study® suggests that puberty may indirectly account for some association between the family environment and brain structure and function (Thijssen et al., 2020). However, a limited number of large studies have evaluated what, how, and why environmental factors impact neurodevelopment. When these topics are investigated, there is typically inconsistent operationalization of variables between studies which may be measuring different aspects of the environment and thus different associations in the analytic models. Multiverse analyses (Steegen et al., 2016) are an efficacious technique for investigating the effect of different operationalizations of the same construct on underlying interpretations. While one of the assets of Thijssen et al. (2020) was its large sample from the ABCD data, the authors used an early release that contained 38% of the full ABCD sample. Then, the analyses used several 'researcher degrees of freedom' (Gelman and Loken, 2014) to operationalize key independent, mediating and dependent variables, including but not limited to, the use of a latent factor of preadolescents' environment comprised of different subfactors, such as parental monitoring and child-reported family conflict. While latent factors can improve reliability of constructs, the nuances of each subfactor and measure that comprise the environment may be lost, making the latent factors difficult to interpret in the context of individual differences. This study extends the work of Thijssen et al. (2020) by evaluating the extent to which the analytic choices in their study affected their conclusions. In Aim 1, using the same variables and models, we replicate findings from the original study using the full sample in Release 3.0. Then, in Aim 2, using a multiverse analysis we extend findings by considering nine alternative operationalizations of family environment, three of puberty, and five of brain measures (total of 135 models) to evaluate the impact on conclusions from Aim 1. In these results, 90% of the directions of effects and 60% of the p-values (e.g. p > .05 and p < .05) across effects were comparable between the two studies. However, raters agreed that only 60% of the effects had replicated. Across the multiverse analyses, there was a degree of variability in beta estimates across the environmental variables, and lack of consensus between parent reported and child reported pubertal development for the indirect effects. This study demonstrates the challenge in defining which effects replicate, the nuance across environmental variables in the ABCD data, and the lack of consensus across parent and child reported puberty scales in youth.
Keywords: Environment; Pubertal development; Resting state MRI; Structural MRI; Youth.
Conflict of interest statement
Conflicts of interest The authors declare that they have no conflicts of interest.
Figures
Similar articles
-
Does pubertal stage mediate the association between family environment and structure and function of the amygdala-mPFC circuit? A replication study of the longitudinal ABCD cohort.Dev Cogn Neurosci. 2022 Aug;56:101120. doi: 10.1016/j.dcn.2022.101120. Epub 2022 Jun 10. Dev Cogn Neurosci. 2022. PMID: 35716638 Free PMC article.
-
The role of brain structure in the association between pubertal timing and depression risk in an early adolescent sample (the ABCD Study®): A registered report.Dev Cogn Neurosci. 2023 Apr;60:101223. doi: 10.1016/j.dcn.2023.101223. Epub 2023 Feb 24. Dev Cogn Neurosci. 2023. PMID: 36870214 Free PMC article.
-
Associations between resting state functional brain connectivity and childhood anhedonia: A reproduction and replication study.PLoS One. 2023 May 4;18(5):e0277158. doi: 10.1371/journal.pone.0277158. eCollection 2023. PLoS One. 2023. PMID: 37141274 Free PMC article.
-
Cognitive deficits in bipolar disorders: Implications for emotion.Clin Psychol Rev. 2018 Feb;59:126-136. doi: 10.1016/j.cpr.2017.11.006. Epub 2017 Nov 21. Clin Psychol Rev. 2018. PMID: 29195773 Free PMC article. Review.
-
The ABCD study: understanding the development of risk for mental and physical health outcomes.Neuropsychopharmacology. 2021 Jan;46(1):131-142. doi: 10.1038/s41386-020-0736-6. Epub 2020 Jun 15. Neuropsychopharmacology. 2021. PMID: 32541809 Free PMC article. Review.
Cited by
-
Childhood trauma, earlier pubertal timing, and psychopathology in adolescence: The role of corticolimbic development.Dev Cogn Neurosci. 2023 Feb;59:101187. doi: 10.1016/j.dcn.2022.101187. Epub 2022 Dec 9. Dev Cogn Neurosci. 2023. PMID: 36640624 Free PMC article.
-
A multi-sample evaluation of the measurement structure and function of the modified monetary incentive delay task in adolescents.Dev Cogn Neurosci. 2024 Feb;65:101337. doi: 10.1016/j.dcn.2023.101337. Epub 2023 Dec 28. Dev Cogn Neurosci. 2024. PMID: 38160517 Free PMC article.
-
ENIGMA's simple seven: Recommendations to enhance the reproducibility of resting-state fMRI in traumatic brain injury.Neuroimage Clin. 2024;42:103585. doi: 10.1016/j.nicl.2024.103585. Epub 2024 Mar 5. Neuroimage Clin. 2024. PMID: 38531165 Free PMC article. Review.
References
-
- Achenbach T.M., Rescorla L.A. University of Vermont, Research Center for Children; Youth, & Families: 2003. Manual for the ASEBA Adult Forms & Profiles. Burlington, VT.
-
- Argabright S.T., Visoki E., Moore T.M., Ryan D.T., DiDomenico G.E., Njoroge W.F.M., Taylor J.H., Guloksuz S., Gur R.C., Gur R.E., Benton T.D., Barzilay R. Association between discrimination stress and suicidality in preadolescent children. Focus. 2022;20(2):252–262. doi: 10.1176/appi.focus.22020005. - DOI - PMC - PubMed
-
- Barch D.M., Albaugh M.D., Avenevoli S., Chang L., Clark D.B., Glantz M.D., Hudziak J.J., Jernigan T.L., Tapert S.F., Yurgelun-Todd D., Alia-Klein N., Potter A.S., Paulus M.P., Prouty D., Zucker R.A., Sher K.J. Demographic, physical and mental health assessments in the adolescent brain and cognitive development study: rationale and description. Developmental Cognitive Neuroscience. 2018;32:55–66. doi: 10.1016/j.dcn.2017.10.010. - DOI - PMC - PubMed
Grants and funding
- U24 DA041147/DA/NIDA NIH HHS/United States
- U01 DA041120/DA/NIDA NIH HHS/United States
- U01 DA041093/DA/NIDA NIH HHS/United States
- U01 DA041156/DA/NIDA NIH HHS/United States
- U01 DA041025/DA/NIDA NIH HHS/United States
- U01 DA041089/DA/NIDA NIH HHS/United States
- U01 DA041106/DA/NIDA NIH HHS/United States
- U01 DA041117/DA/NIDA NIH HHS/United States
- U01 DA041148/DA/NIDA NIH HHS/United States
- U01 DA041174/DA/NIDA NIH HHS/United States
- T32 HD007109/HD/NICHD NIH HHS/United States
- U24 DA041123/DA/NIDA NIH HHS/United States
- U01 DA041134/DA/NIDA NIH HHS/United States
- U01 DA041022/DA/NIDA NIH HHS/United States
- U01 DA041028/DA/NIDA NIH HHS/United States
- U01 DA041048/DA/NIDA NIH HHS/United States
LinkOut - more resources
Full Text Sources