Conditional gene regulation models demonstrate a pro-proliferative role for growth hormone receptor in prostate cancer
- PMID: 36562110
- PMCID: PMC9974633
- DOI: 10.1002/pros.24474
Conditional gene regulation models demonstrate a pro-proliferative role for growth hormone receptor in prostate cancer
Abstract
Background: Humans with inactivating mutations in growth hormone receptor (GHR) have lower rates of cancer, including prostate cancer. Similarly, mice with inactivating Ghr mutations are protected from prostatic intraepithelial neoplasia in the C3(1)/TAg prostate cancer model. However, gaps in clinical relevance in those models persist. The current study addresses these gaps and the ongoing role of Ghr in prostate cancer using loss-of-function and gain-of-function models.
Methods: Conditional Ghr inactivation was achieved in the C3(1)/TAg model by employing a tamoxifen-inducible Cre and a prostate-specific Cre. In parallel, a transgenic GH antagonist was also used. Pathology, proliferation, and gene expression of 6-month old mouse prostates were assessed. Analysis of The Cancer Genome Atlas data was conducted to identify GHR overexpression in a subset of human prostate cancers. Ghr overexpression was modeled in PTEN-P2 and TRAMP-C2 mouse prostate cancer cells using stable transfectants. The growth, proliferation, and gene expression effects of Ghr overexpression was assessed in vitro and in vivo.
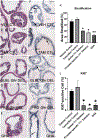
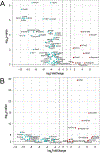
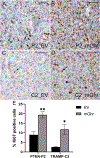
Results: Loss-of-function for Ghr globally or in prostatic epithelial cells reduced proliferation and stratification of the prostatic epithelium in the C3(1)/TAg model. Genes and gene sets involved in the immune system and tumorigenesis, for example, were dysregulated upon global Ghr disruption. Analysis of The Cancer Genome Atlas revealed higher GHR expression in human prostate cancers with ERG-fusion genes or ETV1-fusion genes. Modeling the GHR overexpression observed in these human prostate cancers by overexpressing Ghr in mouse prostate cancer cells with mutant Pten or T-antigen driver genes increased proliferation of prostate cancer cells in vitro and in vivo. Ghr overexpression regulated the expression of multiple genes oppositely to Ghr loss-of-function models.
Conclusions: Loss-of-function and gain-of-function Ghr models, including prostatic epithelial cell specific alterations in Ghr, altered proliferation, and gene expression. These data suggest that changes in GHR activity in human prostatic epithelial cells play a role in proliferation and gene regulation in prostate cancer, suggesting the potential for disrupting GH signaling, for example by the FDA approved GH antagonist pegvisomant, may be beneficial in treating prostate cancer.
Keywords: GH; GHR; IGF-1; Pten; RNA-seq; T-antigen.
© 2022 The Authors. The Prostate published by Wiley Periodicals LLC.
Conflict of interest statement
DISCLOSURES
The authors have no conflicts of interest to disclose.
Figures


Comment in
-
GHR expression and prostate cancer proliferation.Nat Rev Urol. 2023 Mar;20(3):131. doi: 10.1038/s41585-023-00740-3. Nat Rev Urol. 2023. PMID: 36781984 No abstract available.
Similar articles
-
GH Action in Prostate Cancer Cells Promotes Proliferation, Limits Apoptosis, and Regulates Cancer-related Gene Expression.Endocrinology. 2022 May 1;163(5):bqac031. doi: 10.1210/endocr/bqac031. Endocrinology. 2022. PMID: 35383352 Free PMC article.
-
Disruption of growth hormone signaling retards early stages of prostate carcinogenesis in the C3(1)/T antigen mouse.Endocrinology. 2005 Dec;146(12):5188-96. doi: 10.1210/en.2005-0607. Epub 2005 Sep 1. Endocrinology. 2005. PMID: 16141391
-
Growth hormone (GH) receptors in prostate cancer: gene expression in human tissues and cell lines and characterization, GH signaling and androgen receptor regulation in LNCaP cells.Mol Cell Endocrinol. 2004 May 31;220(1-2):109-23. doi: 10.1016/j.mce.2004.03.004. Mol Cell Endocrinol. 2004. PMID: 15196705
-
Morphogenic and tumorigenic potentials of the mammary growth hormone/growth hormone receptor system.Mol Cell Endocrinol. 2002 Nov 29;197(1-2):153-65. doi: 10.1016/s0303-7207(02)00259-9. Mol Cell Endocrinol. 2002. PMID: 12431808 Review.
-
Growth hormone (GH) binding and effects of GH analogs in transgenic mice.Proc Soc Exp Biol Med. 1994 Jul;206(3):190-4. doi: 10.3181/00379727-206-43740. Proc Soc Exp Biol Med. 1994. PMID: 8016152 Review.
Cited by
-
GH-dependent growth of experimentally induced carcinomas in vivo.Endocr Relat Cancer. 2023 Mar 29;30(5):e220403. doi: 10.1530/ERC-22-0403. Print 2023 May 1. Endocr Relat Cancer. 2023. PMID: 36826838 Free PMC article. Review.
-
From pituitary cells to prostate gland in health and disease: direct and indirect endocrine connections.Rev Endocr Metab Disord. 2025 Apr;26(2):187-203. doi: 10.1007/s11154-025-09948-7. Epub 2025 Feb 6. Rev Endocr Metab Disord. 2025. PMID: 39910005 Free PMC article. Review.
-
GHR expression and prostate cancer proliferation.Nat Rev Urol. 2023 Mar;20(3):131. doi: 10.1038/s41585-023-00740-3. Nat Rev Urol. 2023. PMID: 36781984 No abstract available.
-
Elevated LAMTOR4 Expression Is Associated with Lethal Prostate Cancer and Its Knockdown Decreases Cell Proliferation, Invasion, and Migration In Vitro.Int J Mol Sci. 2024 Jul 25;25(15):8100. doi: 10.3390/ijms25158100. Int J Mol Sci. 2024. PMID: 39125671 Free PMC article.
References
-
- Ferlay J, Soerjomataram I, Dikshit R, Eser S, Mathers C, Rebelo M, Parkin DM, Forman D, Bray F. Cancer incidence and mortality worldwide: sources, methods and major patterns in GLOBOCAN 2012. Int J Cancer. 2015;136(5):E359–386. - PubMed
-
- Data from: A Study to Evaluate the Biological Activity of R1507 in Women With Operable Breast Cancer. Identifier NCT00882674 July 2009-December 2010. https://ClinicalTrials.gov/show/NCT00882674.
-
- Data from: A Multiple Ascending Dose Study of R1507 in Children and Adolescents With Advanced Solid Tumors. Identifier NCT00560144 December 2007-December 2011. https://ClinicalTrials.gov/show/NCT00560144.
-
- Data from: A Study of R1507 in Combination With Multiple Standard Chemotherapy Treatments in Patients With Advanced Solid Tumors. Identifier NCT00811993 February 2009-December 2012. https://ClinicalTrials.gov/show/NCT00811993.
Publication types
MeSH terms
Substances
Grants and funding
LinkOut - more resources
Full Text Sources
Medical
Molecular Biology Databases
Research Materials
Miscellaneous

