. 2023 Jan 20;18(1):91-101.
doi: 10.1021/acschembio.2c00727. Epub 2022 Dec 23.

Widespread, Reversible Cysteine Modification by Methylglyoxal Regulates Metabolic Enzyme Function

Affiliations

Widespread, Reversible Cysteine Modification by Methylglyoxal Regulates Metabolic Enzyme Function

John S Coukos et al. ACS Chem Biol. .

Abstract

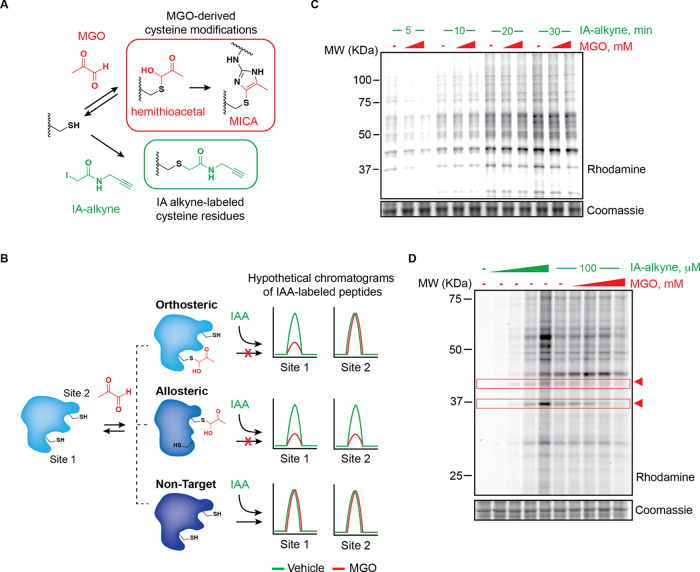
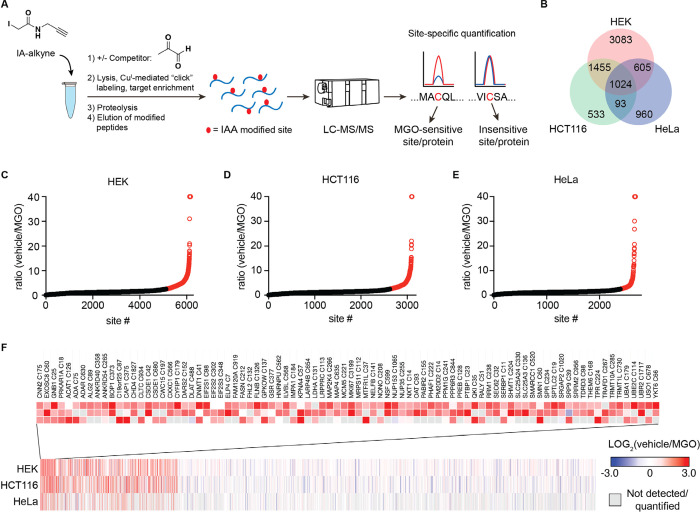
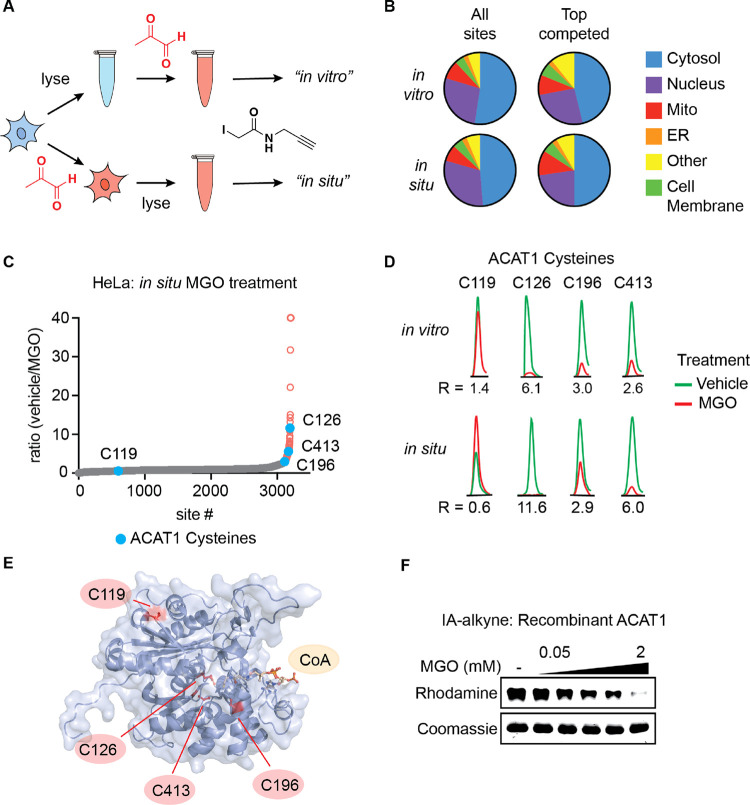
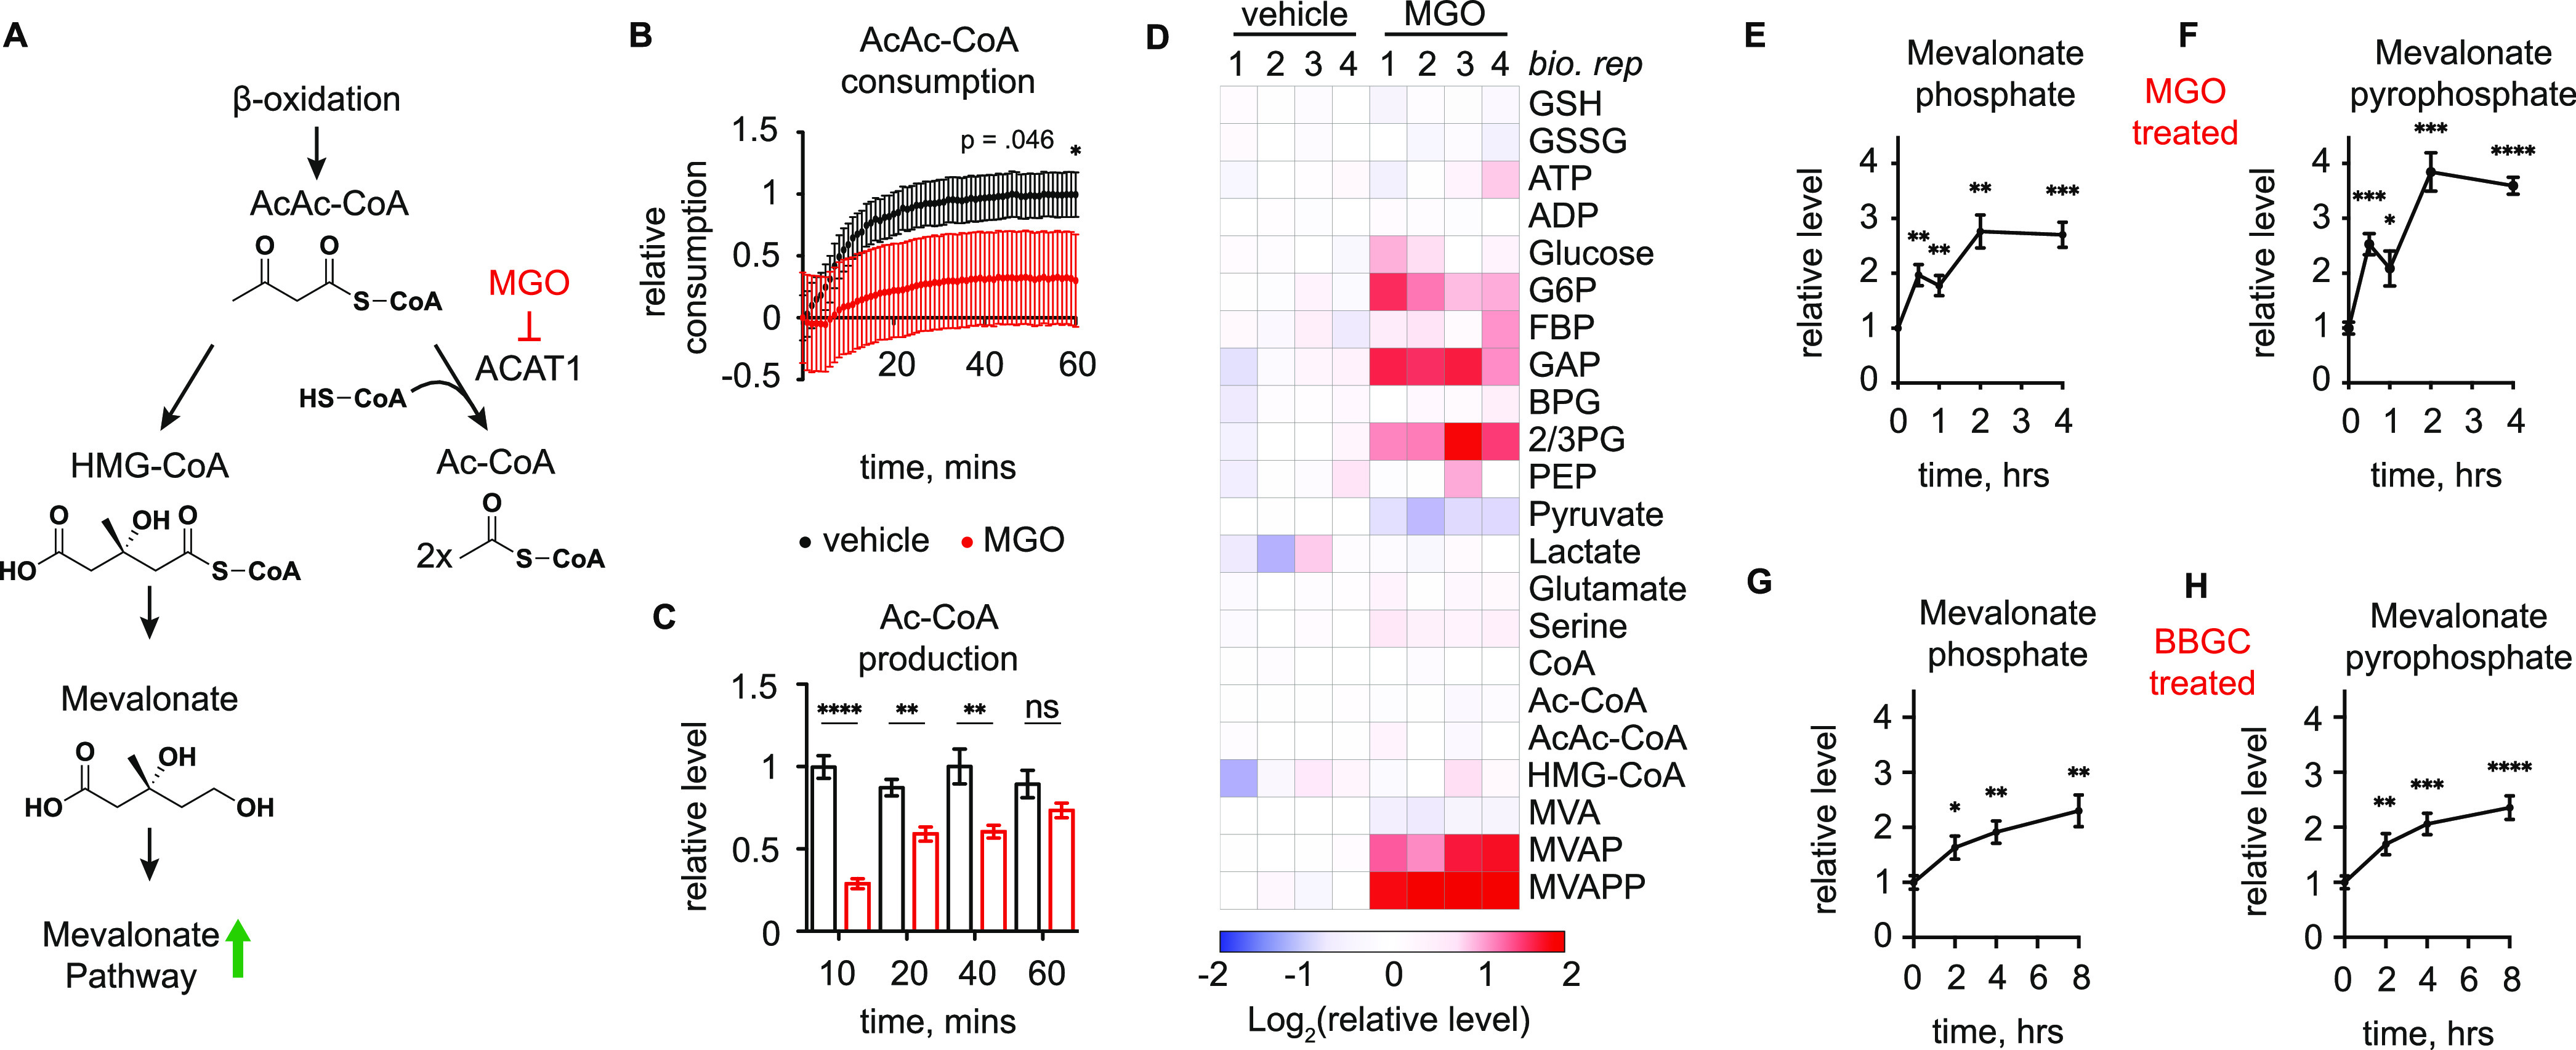
Methylglyoxal (MGO), a reactive metabolite byproduct of glucose metabolism, is known to form a variety of posttranslational modifications (PTMs) on nucleophilic amino acids. For example, cysteine, the most nucleophilic proteinogenic amino acid, forms reversible hemithioacetal and stable mercaptomethylimidazole adducts with MGO. The high reactivity of cysteine toward MGO and the rate of formation of such modifications provide the opportunity for mechanisms by which proteins and pathways might rapidly sense and respond to alterations in levels of MGO. This indirect measure of alterations in glycolytic flux would thereby allow disparate cellular processes to dynamically respond to changes in nutrient availability and utilization. Here we report the use of quantitative LC-MS/MS-based chemoproteomic profiling approaches with a cysteine-reactive probe to map the proteome-wide landscape of MGO modification of cysteine residues. This approach led to the identification of many sites of potential functional regulation by MGO. We further characterized the role that such modifications have in a catalytic cysteine residue in a key metabolic enzyme and the resulting effects on cellular metabolism.


Conflict of interest statement

The authors declare no competing financial interest.

Figures

Figure 1
Figure 1
Chemoproteomic detection of MGO modifications on protein cysteines. (A) Indirect cysteine reactivity profiling with iodoacetamide alkyne (IA-alkyne). Methylglyoxal (MGO)-modified cysteines, i.e., reversible hemithioacetal or stable MICA modifications, do not engage with the IA-alkyne probe. (B) Schematic depicting the possible modes of MGO-regulated cysteine engagement with the IA-alkyne probe. (C) Fluorescent gel electrophoresis of HeLa lysates pretreated with 0.25 or 1 mM MGO for 1 h followed by IA-alkyne probe (100 μM) treatment for the indicated time points. (D) Fluorescent gel electrophoresis of HeLa lysates treated with IA-alkyne probe (0–200 μM) for 1 h (left) or pretreated with MGO (0–1 mM) followed by IA-alkyne (100 μM, 1 h; right). Arrowheads highlight bands competed by MGO in a dose-dependent manner. Lysates in C and D were labeled with rhodamine azide for in-gel fluorescence visualization. Coomassie staining was performed as a loading control.
Figure 2
Figure 2
Proteome-wide profiling of MGO-IA-alkyne competition at functional cysteines. (A) Workflow of IA-alkyne SILAC LC–MS/MS profiling experiments to quantify MGO regulation of cysteine residues in a proteome-wide manner. (B) Venn diagram of unique, quantified cysteine residues in lysates from HEK293, HCT116, and HeLa cancer cells. (C–E) Waterfall plots of IA-alkyne-labeled cysteine residue SILAC ratios for HEK293 (C), HCT116 (D), and HeLa (E) lysates treated for 2 h with 1 mM MGO or vehicle at 37 °C. Data points shown are mean SILAC ratio derived from n = 4 biological replicates each. (F) Heatmap of the ratios of all unique sites quantified in lysates from multiple cell lines in IA-alkyne SILAC proteomic profiling experiments. Sites that showed a SILAC ratio of vehicle over MGO treated >2.5 in more than one cell line are highlighted. Gray boxes denote no data for that site/condition pair.
Figure 3
Figure 3
MGO modifies active site cysteine residues of metabolic enzyme ACAT1. (A) Schematic depicting comparative MGO treatment workflow for “in vitro” vs “in situ” proteomics samples. (B) Distribution of all cysteines and top competed cysteine residues with a ratio >2.5 in IA-alkyne SILAC experiments with HeLa lysate (“in vitro”) and HeLa cells (“in situ”) treated with MGO or vehicle across proteins localized to the indicated subcellular compartments. (C) Waterfall plot graphs of IA-alkyne-labeled cysteine residue SILAC ratios for HeLa cells treated for 2 h with 2 mM MGO or vehicle at 37 °C with cysteine residues from ACAT1 highlighted. (D) Representative chromatograms of labeled peptides of ACAT1 from IA-alkyne SILAC experiments with HeLa lysate and HeLa cells treated with MGO or vehicle. (E) Structure of ACAT1 active site, depicting acetylated C126 with cysteine residues quantified in IA-alkyne proteomics experiments highlighted (PDB accession: 2F2S). (F) Dose-dependent competition of ACAT1 and IA-alkyne by MGO in vitro. Recombinant ACAT1 (0.05 mg/mL) was pretreated with indicated concentrations of MGO for 2 h followed by IA-alkyne treatment for 30 min.
Figure 4
Figure 4
Methylglyoxal modification regulates ACAT1 activity. (A) Connections between ACAT1 and mevalonate pathway, as well as a proposed model of mevalonate pathway metabolite accumulation as a result of MGO inhibition of ACAT1 activity. (B) Relative consumption of AcAc-CoA by recombinant ACAT1 treated with 2 mM MGO (red) or vehicle (black). (C) LC–MS quantification of Ac-CoA produced by recombinant ACAT1 within time course studies after pretreatment with 2 mM MGO or vehicle. (D) LC–MS quantification of indicated metabolites in HeLa cells treated with MGO (2 mM) or vehicle for 4 h. (E,F) LC–MS quantification of mevalonate-5-phosphate (E) and mevalonate-5-pyrophosphate (F) in HeLa cells treated with MGO (2 mM) at the indicated time points. (G,H) LC–MS quantification of mevalonate-5-phosphate (G) and mevalonate-5-pyrophosphate (H) in HeLa cells treated with GLO1 inhibitor BBGC (20 μM) at the indicated time points. Data are mean ± S.E.M. from n = 8 (B,G,H) or 4 (C,E,F) independent biological replicates. Statistical analysis in B and C is by one-sided unpaired Student’s t-test. Statistical analysis in E–H is by two-sided unpaired Student’s t-test comparing individual timepoints to their corresponding 0-h control. *p < 0.05; **p < 0.01; ***p < 0.001; and ****p < 0.0001.

References

    1. Krymkiewicz N. Reactions of methylglyoxal with nucleic acids. FEBS Lett. 1973, 29, 51–54. 10.1016/0014-5793(73)80013-4. - DOI - PubMed
    1. Ahmed N.; Thornalley P. J. Chromatographic assay of glycation adducts in human serum albumin glycated in vitro by derivatization with 6-aminoquinolyl-N-hydroxysuccinimidyl-carbamate and intrinsic fluorescence. Biochem. J. 2002, 364, 15–24. 10.1042/bj3640015. - DOI - PMC - PubMed
    1. Salomón T.; Sibbersen C.; Hansen J.; Britz D.; Svart M. V.; Voss T. S.; Møller N.; Gregersen N.; Jørgensen K. A.; Palmfeldt J.; Poulsen T. B.; Johannsen M. Ketone Body Acetoacetate Buffers Methylglyoxal via a Non-enzymatic Conversion during Diabetic and Dietary Ketosis. Cell Chem. Biol. 2017, 24, 935–943. 10.1016/j.chembiol.2017.07.012. - DOI - PubMed
    1. Coukos J. S.; Moellering R. E. Methylglyoxal Forms Diverse Mercaptomethylimidazole Crosslinks with Thiol and Guanidine Pairs in Endogenous Metabolites and Proteins. ACS Chem. Biol. 2021, 16, 2453–2461. 10.1021/acschembio.1c00553. - DOI - PMC - PubMed
    1. Henle T. W.; Walter A. W.; Haeßner R.; Klostermeyer H. Detection and identification of a protein-bound imidazolone resulting from the reaction of arginine residues and methylglyoxal. Z. Lebensm.-Unters Forsch. 1994, 199, 55–58. 10.1007/BF01192954. - DOI

Publication types