. 2023 Mar 6;222(3):e202209127.
doi: 10.1083/jcb.202209127. Epub 2022 Dec 23.

CLEMSite, a software for automated phenotypic screens using light microscopy and FIB-SEM

Affiliations

CLEMSite, a software for automated phenotypic screens using light microscopy and FIB-SEM

José M Serra Lleti et al. J Cell Biol. .

Abstract

In recent years, Focused Ion Beam Scanning Electron Microscopy (FIB-SEM) has emerged as a flexible method that enables semi-automated volume ultrastructural imaging. We present a toolset for adherent cells that enables tracking and finding cells, previously identified in light microscopy (LM), in the FIB-SEM, along with the automatic acquisition of high-resolution volume datasets. We detect the underlying grid pattern in both modalities (LM and EM), to identify common reference points. A combination of computer vision techniques enables complete automation of the workflow. This includes setting the coincidence point of both ion and electron beams, automated evaluation of the image quality and constantly tracking the sample position with the microscope's field of view reducing or even eliminating operator supervision. We show the ability to target the regions of interest in EM within 5 µm accuracy while iterating between different targets and implementing unattended data acquisition. Our results demonstrate that executing volume acquisition in multiple locations autonomously is possible in EM.


Conflict of interest statement

Disclosures: J.M Serra Lleti reported non-financial support from Zeiss Microscopy during the conduct of the study. “Since the developed work required control of the microscope hardware used for the experiments described in the manuscript, there was an agreement with Zeiss, that Fibics Incorporated, a third-party company from Zeiss, would provide a developer’s API able to command certain aspects of the microscope (details are described in the manuscript). The provided developer’s API was experimental and required technical support from Fibics Incorporated side. There were also meetings to discuss technical details about the operation of the microscope in the context of the project, where we benefited from the company’s expertise in FIB-SEM technology. For this reason, the API developers that provided such support are cited as co-authors (David Unrau and Mike Holtstrom).” No other disclosures were reported.

Figures
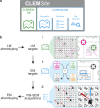
Figure 1.
Figure 1.
Schematic representation of the correlative light and electron microscopy software CLEMSite. (a) Overview of the different elements of CLEMSite, CLEMSite-LM, and CLEMSite-EM. CLEMSite-EM is divided into three modules: the Navigator, which allows to store and move to different positions in the SEM, then Multisite, which drives the FIB-SEM acquisitions, and the Run Checker, which controls and reports during the FIB-SEM runs. (b) Workflow for the automated acquisition of multiple correlated datasets. Light microscopy is performed to find specific phenotypes (“LM phenotyping”). From them, individual cells are selected (“LM targets”) and their corresponding landmarks and positions are recorded using CLEMSite-LM. (i) This scheme illustrates that for “LM targets, the low magnification overview shows the selected cellular targets (green circles), the landmarks (pink circles) used for correlating across imaging modalities, and the alphanumeric coordinate system that is patterned on the cell culture dish. On the right, a higher magnification image shows more clearly the Golgi as the cellular target (green circle), and the landmark used (pink circle) provided by the patterned culture dish, whose position is referred to the closest alphanumeric coordinates of the culture dish. (ii) Inside the FIB-SEM, “EM targets” refers to the process of obtaining the positions of the cells in the EM (stage coordinates). For that, a transformation matrix T is calculated based on the respective landmark positions of LM and EM (LM landmarks list in pink and EM landmarks list in black). This matrix transforms an LM Target list (cell positions in LM stage coordinates in green) into an EM target list (cell positions in EM stage coordinates in orange). On the right, the blue trapezoid and rectangle represent the milled and targeted region on the surface of the sample, inside the FIB-SEM. The black circle indicates the target coordinates in EM for the landmark, which should have its equivalent pink circle on LM stage coordinates. All of this correlation work is performed using the Navigator. (iii) Finally, in “FIB-SEM acquisitions,” cell image volumes are acquired at the “EM target” positions using Multisite and Run Checker. At each location of interest, the focused ion beam (red arrowhead) and the electron beam (blue arrowhead) are iteratively used to acquire datasets. The acquired data is finally analyzed to characterize different phenotypes (“EM phenotyping”).
Figure 2.
Figure 2.
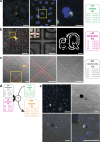
Coordinate system mapping and automatic detection for the correlation strategy. (a) Cell of interest selected using fluorescence microscopy by scanning low magnification images (first and second image). In our experiments, we targeted the Golgi apparatus center of mass (a, third image, white cross). The image position is translated to stage position coordinates and stored in the “LM targets list” (green). (b) Simultaneously, reflected light images (b, first image) are stored, and later used to extract the stage coordinates of landmarks (LM landmarks list, pink). The image is analyzed and a line detector is applied (red lines). The intersection of the lines is used to find grid bar crossings (b, second image including inset). The corresponding detected edges are converted to lines that automatically mark 4 points (b, second image, red dots). Those points are used to determine the center point (second image, yellow dot), and they will be part of the “LM landmarks list.” By convention, the top left corner (yellow arrowhead) is named by associating its unique center point (yellow dot) with the alphanumeric identifier imprinted onto the glass dish bottom. To identify the alphanumeric character on the image, the reflected light image is automatically thresholded and cleaned (b, third right image) using a combination of traditional image analysis pipelines (see Fig. S1) and then passed through a convolutional neural network for classification, in this case, 8Q. (c) In the FIB-SEM, the strategy of mapping is repeated: scan images are taken by the Navigator module (c, first image), and the grid bar crossings are detected to calculate the center point (red marks). In SEM, it is difficult to do automatic detection of the alphanumeric character (indicated by a dotted black line, not the process of automatic detection). For this reason, the first character must be identified by the user and then given as input to the map. Each grid bar crossing surrounding the character is imaged (yellow remark at the bottom). Here, a different convolutional neural network is used to evaluate the probabilities of being a line on each crossing (c, second image, red marks). The identification of the center position of the crossing is very similar to the one in LM, here the intersections (c, third image, red dots) are identified after line detection, and the center point is stored as a position (c, third image, yellow dot). This process continues at each predicted landmark to give a list of landmarks (EM landmarks list). (d) A transformation is computed to register the positions from the LM and the EM landmarks lists (pink, black), which is then applied to the LM targets list (green) to predict the respective EM targets list (orange) across the sample at the FIB-SEM. (e) At the end of the experiment, the position of the cell can be validated using manual registration. FM (first image, top left) and SEM (second image, top right) images were superimposed manually using the cell contours. For this, the FM images were flipped, rotated, and scaled (first image, bottom left). The position of the LM target (white cross) is then compared with the predicted target in the SEM (black cross) (second image, bottom right). This overlay of SEM with LM images was repeated for each experiment, obtaining a final targeting accuracy of 5 ± 3 µm (RMSD over n = 10). Scale bars: (a) 200, 25, 25 µm; (b) 200, 100 µm with small window upper left corner 25, 50 µm; (c) all 100 µm; (e) all 50 µm.
Figure S1.
Figure S1.
Line detection and landmark recognition in LM and SEM. (a) Schematic of the line detection algorithm. Each step is illustrated with the corresponding output image: (1) Reflected light image (LM) of the coordinate system is smoothed and the brightness and contrast are automatically balanced with adaptive histogram equalization. (2) Automatic edge detection is performed using Canny edge detection and non-maxima suppression (NMS). (3) Image edges are enhanced with stroke width transform, which analyzes all gradients to keep only the ones belonging to the imprinted grid. Thus, the image is cleaned to facilitate the recognition of the alphanumerical pattern. (4) Pixel gradient orientations (from Sobel operators) are extracted and homogenized in superpixels (SLIC algorithm), where similar orientations get clustered to the same superpixel. (5) The image resulting from 4 is convolved by every angle from 0 to 180°, and all the rows of the image are added to form a vector projection. Vectors are arranged in a matrix from 0 to 180. (6) From 5, peaks are found using non-maxima suppression and the repetition and spacing pattern are tested to find the best fit to the grid dimensions according to the manufacturer. Each peak is the result of a line detected in the image and in this way it can be plotted back in the original image. With the line detected, by calculating all the intersections between lines, the grid bar crossings can be found. (7) For each bar crossing, a refinement is applied. First, the area surrounding the crossing area is cropped, and the patch is analyzed again (same line detection algorithm) to validate the previous detection of the lines. When the distance between intersections is not fitting the expected separations of the grid pattern (i.e., 20 μm thickness for the border and 580 μm for the square with the alphanumeric pattern, with some additional tolerance), the landmark is not accepted. (8) This might happen when dirt or scratches make the detection algorithm fail. The final result of this process is, first the list of references based on the detected central positions of the grid bar crossings (landmarks), and the cropped character (as shown in Fig. 2 b). The cropped character is passed to a convolutional neural network, and the alphanumeric character is automatically identified (for details about this, see supplementary materials notebooks 1 and 2: https://github.com/josemiserra/CLEMSite_notebooks). Each landmark is then renamed based on the corresponding detected character. (b) Schematic of the algorithm used by the Navigator module to find landmarks in the SEM, to build a map based on the grid. (1) In the first step, the SEM is positioned at a random square in the MatTek grid. The software detects the corners (black dots) by detecting the line intersections of the square edges (yellow points). The process is the same as the one explained in (a). (2) Each corner is refined by applying the line detection (red lines) in a higher magnification view. To optimize the process and reduce the amount of SEM images of the sample surface, the detection procedure is applied to only a group of randomly selected landmarks in the MatTek grid. (3) By getting a 40% of total landmarks, and sampling them with a uniform random distribution, it can be achieved with similar accuracy as when scanning the full dish. If the line detection fails, autofocus is applied once. If after a second round, the detection fails, the landmark position is flagged as blocked. In this way, landmark positions that fall outside the sample or are too damaged, are discarded from the final landmark map. Once a new position is saved in the map, if it is considered a valid position (not blocked), then local and global transformations are recomputed and updated. Scale bars: (a; 1–4) 200 µm; (7, 8) 25 µm; (b; 1) 100 µm, (2) 50 µm.
Figure S2.
Figure S2.
Examples of landmark detection on SEM images (SE detector) from surfaces of different samples. Cracks, scratches, and dirt on the surface make landmark detection difficult and more error-prone. For each square, the left image shows the final detection, with the yellow dot representing the detected center position of the crossing and the red points the corners of the crossing. The right image is the same with inverted brightness and contrast, with red pixels representing the probability of being a grid edge as detected by the neural network. The probability map from the neural network is the result of the network inference, with the set of images used during training different from the images used as input during the experiment, which is shown here. We observe that the neural network can generalize very well the detection of the grid patterns in the resin surface. Here we exemplify the common cases that can lead to an error in the detection of a landmark. (a) The sample is in a perfect state. (b) A crack present in the upper part might affect the predicted accuracy of the overall map, even if the detection is identified as good (or close to it). (c) Scratches can be the cause of false positives for the grid detection, in this case, scratches parallel to the grid bar. Even if this specific error was later corrected by taking also into account the length of the line stroke, we presume that longer scratches than the ones shown in the exemplary image could cause the same problem again. (d) In other cases, dirt and other material residues, e.g., from silver painting (used around the sample border to derive charges), might mislead the detection algorithm and increase the final error. The detection problems might change on a sample basis. A detailed analysis of the error detection is shown in the supplementary material in notebook 2 (https://github.com/josemiserra/CLEMSite_notebooks). Scale bars: all 100 µm.
Figure 3.
Figure 3.
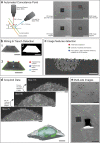
Schematics of some of the implemented components to achieve FIB-SEM automation and its results. (a) Automated Coincidence Point routine is illustrated schematically. When not tuned, the two beams are usually pointing at different positions of the sample surface (green plane, blue point for FIB center, red point for SEM center). The orange plane below shows the case where the ideal position (yellow point) is achieved for both FIB and SEM beams. In the software routine, a square is sputtered with the ion beam on the sample surface. The offset between the two beams is calculated based on the difference between the center of the sputtered mark in the SEM and FIB images (dy, distance between red and blue positions in the green plane). The z height (dz) of the stage is then corrected, and a further refinement using the SEM beam shift is performed by calculating the translation of the square mark between FIB (50 pA image) and SEM images. (b) Milling & Trench Detection: (1) After finding the coincidence point, a trench is milled to expose a cross-section at the region of interest. (2) The trench is detected to accurately position the field of view. First, three-level thresholding is applied to the image, followed by the detection of the biggest connected component that fits a trapezoid shape. From the final binary shape, boundaries of the trapezoid are found (3): the top corners (red circles), the trapezoid top center (blue circle), and the trapezoid center (light blue circle). (c) Image features detection: The image of the cross-section surface is analyzed and scored for the best focus positions to perform autofocus and autostigmatism. Features inside the image are found by using Harris corner detection and the variance of a small region surrounding each detected corner position. The initial features (red points) highlight the high contrast and complex areas of the imaging surface which usually cluster on cellular structures. Features are clustered and their centroids (green dots) are then filtered and prioritized to detect the first 6 ones suitable for AFAS (blue points). Due to the brightness/contrast settings to make the cell visible well inside the cross-section, the top surface of the sample above the cellular edge, which is covered with a gold coat, is only faintly visible. This region is excluded from the analysis of the cross-section to prevent autofocus outside the proper field of view. (d) Acquired data: Images are acquired at 200 nm intervals (in z) throughout the Golgi apparatus region. The resulting stack is used for 3D render and quantifications. (e) Multi-site images: Result of an experiment, where multiple targets had been acquired automatically across the full surface of the sample. Scale bars: (a) all 50 µm; (b) all 25 µm; (c) 5 µm; (d) slices all 2 µm, model 5 µm; (e) 500, 50 µm.
Figure S3.
Figure S3.
Automatic workflow setup for data acquisition in the FIB-SEM (Multisite). (a) Flow diagram of the algorithm used before each target cell is acquired. The boxed part (dotted line) indicates instructions belonging to the coincidence point (CP) calculation. “WD” refers to Working Distance (distance to the focused object on the z-axis). “Grab” refers to commanding the microscope to acquire an image of the surface of the sample. (x, y) indicates that the action takes place in respective stage coordinates in the x, y-axis. “dz” is the difference in z position, SEM x, SEM y—stage position coordinates x and y using the SEM detector. FIB x, FIB y stage position coordinates x and y using the FIB detector. In both cases, pixel coordinates from the image are translated to stage position coordinates given by the center position of the image. Upon completion, when a stored map of landmarks is present (there are surrounding grid bar crossings to the cell target), the closest 8 landmarks are used to compute a local transformation that will re-estimate the cell position with higher accuracy. (b) Flow diagram of the algorithm used for Milling & Trench Detection. Numbers (1), (2), and (3) correspond with images (1), (2), and (3) in Fig. 3 b. After the trench is milled, a quick routine examines if the B&C (brightness and contrast) is good enough to differentiate the trench from the background. If not, the user is prompted to adjust the B&C until the trench is visible. Since simple thresholding is usually not enough, the detection of the trench is repeated on the new image using a three-level thresholding algorithm after a slight blur. This algorithm is fast and identifies and groups pixels as belonging to three categories. The darkest category is usually the trench. The thresholded object is then identified if its geometry has a trapezoidal shape, to differentiate it from other confounding objects. If several trapezoids are present (from previous acquisitions), the closest to the center is taken as a reference. In the trapezoid, the top center position can be used as a reference to focus the FOV (field of view). (c) Flowchart of the routine used for setting the conditions before the acquisition, after (b). In the automation routine, the user must decide the brightness and contrast (B&C) of the sample only for the first cell acquired (n = 1). Values of B&C will be stored for future acquisitions. After choosing an optimal B&C, the goal is to start with a crisp image with a good focus and stigmatism set of values. The core AFAS routine is provided by ZEISS Atlas 5 software and is triggered in a reduced window from the full field of view (FOV) at different magnifications, from lower to higher. At each magnification, high complexity regions are found to be the center of the window where the AFAS is applied. If this routine fails to find a good focus before starting to acquire, which could happen in exceptionally damaged samples, the user is prompted to focus manually and the values of focus are taken as reference for the next acquisition.
Figure S4.
Figure S4.
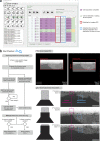
CLEMSite-EM interface and Run Checker details. (a) Screenshot of the CLEMSite-EM interface to outline the details of the software User Interface (UI). In the top left panel, a map depicts targets (green) and landmarks (blue if SEM stage coordinates are matched with light microscopy stage coordinates, red if no match is present). Bottom left: A messaging console is used to display the communications with the server and which instructions are sent to the microscope. The right panel displays the list of all the targets to be acquired. The list presents which targets are already acquired (purple) and which ones are intact (green). Targets can be selected or deselected by ticking the “To Do” checkbox in the first column. For each target, it is possible to decide on a rectangular field of view of the cross-section in x and y and assign it here to each phenotype according to its expected size (ROI, red outline). In the last modifiable column, the ZEISS Atlas 5 recipes for the actual acquisition, which includes the size of the section imaged from the total 3D volume milled by the FIB-SEM (Setup, blue outline). The last two columns show the individual folder where the acquisition is saved and the percentage of progression during the acquisition. (b) Flowchart of the logic applied by the Run Checker module. This module becomes active once a run starts and triggers a script each time a newly acquired image is stored in the folder. During the progression of the acquisition, the FOV carries a translational shift that has to be tracked and corrected continuously. In this module, a routine calculates the translation between two consecutive frames, and given the incremental shift, it decides to move the imaging ROI if the sample has drifted with respect to the image acquired at the beginning of the acquisition (1). The reference used to track is the upper coating, which cannot be drifted more than a tolerance (one-fourth of the image height). If that happens, the FOV is moved up or down respectively. The same principle is applied to the position of the autotune box (small window where the AFAS is applied, magenta and blue squares) which is moved into a new position before a new AFAS is executed (2). In this case, the image is analyzed to find optimal positions for the autotune box, first executing the same algorithm as used in Fig. 3 c, but now with the hard constraint that the position must be in the upper part of the image (half of the image height) and below the upper coating. The image coordinates are translated to FOV coordinates and the autotune box is repositioned.
Figure 4.
Figure 4.
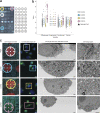
Automated screen of 14 siRNAs after 72 h solid-phase transfection knockdown. (a) Transmitted light image of one Petri dish with the 32 siRNA spots (left), where each siRNAs transfection mix is placed in the culture dish following a definite arrangement, see Table S2 for further details (right). (b) Morphological features of the Golgi apparatus scoring tubularity, diffuseness, fragmentation, and condensation for COPB1 (n = 26), COPB2 (n = 34), COPG1(n = 88) in comparison to negative control (Neg9, n = 305). Values of each feature are normalized with respect to the mean of the control. During the light microscopy workflow, cells transfected with COP siRNAs display a phenotype that can be identified because of their high value in diffuseness. As an example, we selected one cell of each COP-related siRNA (black triangles), to display in (c) the final result of the correlative experiment. (c) Selected correlated cells control (Neg9), COPB1, COPB2, and COPG1 (top to bottom): overview merged fluorescent, reflected light image and image of the siRNA spot (LM merged overview), the fluorescent image of a selected cell (LM selection target cell), a cross-section through the selected cell in the region of the Golgi apparatus acquired automatically with the FIB-SEM (EM single slice from FIB-SEM volume) and a zoom into the Golgi region (EM Golgi region). Three corner siRNA spots are highlighted with fluorescent gelatine (Alexa 594), shown as a red outline, whereas the last corner siRNA spot is highlighted with gelatine (Oregon green) shown as a green outline to make the orientation always recognizable. Scale bars: (c) left to right, 100, 10, 1, 1 µm.
Figure S5.
Figure S5.
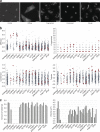
Phenotype description and stereological quantification of chosen cells for the entire workflow. (a) Illustrations of the different Golgi phenotypes revealed by the GalNac-T2-GFP signal: control, diffuse (COPG1), fragmented (DNM1), condensed (ACTR3), and tubular (IPO8). Scale bars: control, 5 µm, rest, 10 µm. (b) Scatter plots of computed features measuring the strength for each phenotype. Each gray dot represents the feature value associated with one cell normalized respect to the mean. The x-axis displays the corresponding siRNA treatment (ACTR3 n = 183, ARHGAP44 n = 282, C1S n = 179, COPB1 n = 26, COPB2 n = 34, COPG1 n = 88, DNM1 n = 137, FAM177B n = 252,GPT n = 260, IPO8 n = 194, NT5C n = 115, XWNeg9 n = 305, PTBP1 n = 357, SRSF1 n = 115). Diffuseness, condensation, and tubularity values are normalized with respect to the control (Neg9). Fragmentation illustrates the number of fragments detected in the Golgi apparatus. Red triangles highlight each one of the selected cells for the CLEM experiment (a total of 33). (c) Stereological quantification was applied on FIB-SEM images of the corresponding cells to measure the number of cisternae (left) and the volume (right) of the Golgi apparatus. Each bar represents the value measured for one cell, grouped by siRNA treatment. Since the sample size is very small (n = 2 or n = 3 per treatment), the screen was oriented exclusively to find large effects. Knockdowns of the COP proteins (COPB1, COPB2, COPG1), revealed a disappearance of the Golgi stacks (thus, no cisternal volume can be measured) replaced by a large accumulation of small vesicles. No obvious morphological differences were found in other siRNA treatments with respect to the control cells.
Figure 5.
Figure 5.
Automated screen on COPB1 cells in light and electron microscopy 48 h after liquid phase transfection knockdown. (a) Overview of 25 selected cells in a screen for COPB1 knockdown. Light microscopy images (green is GFP GalNAc-T2 Golgi apparatus and blue is DAPI for the nucleus, top) and the corresponding electron microscopy images (bottom). (b) Top: Selected control cell (treated with XWNeg9 siRNA) in light microscopy (left), electron microscopy (middle), and a reconstructed model from the FIB-SEM stack (right) showing the 3D model of the nucleus in blue, the model of the Golgi stacks in green and a surface rendering of the cell surface in transparent green. Bottom: Selected COPB1 cell (treated with COPB1 siRNA) in light microscopy (left), electron microscopy (middle), and a reconstructed model (right). (c) Detailed electron microscopy images of the Golgi apparatus region in a control cell (left) and four different variations of a disturbed Golgi apparatus in different selected cells of the COPB1 knockdown. Scale bars: (a) LM—10 µm, EM—5 µm, (b) left to right—10, 2, 5 µm, (c) 1 µm.

References

    1. Altschuler, S.J., and Wu L.F.. 2010. Cellular heterogeneity: Do differences make a difference? Cell. 141:559–563. 10.1016/j.cell.2010.04.033 - DOI - PMC - PubMed
    1. Beckwith, M.S., Beckwith K.S., Sikorski P., Skogaker N.T., Flo T.H., and Halaas Ø.. 2015. Seeing a mycobacterium-infected cell in nanoscale 3D: Correlative imaging by light microscopy and FIB/SEM tomography. PLoS One. 10:e0134644. 10.1371/JOURNAL.PONE.013464410.1371/journal.pone.0134644 - DOI - PMC - PubMed
    1. Bray, M.A., and Carpenter A.E.. 2018. Quality control for high-throughput imaging experiments using machine learning in cellprofiler. Methods Mol. Biol. 1683:89–112. 10.1007/978-1-4939-7357-6_7 - DOI - PMC - PubMed
    1. Carpenter, A.E., Jones T.R., Lamprecht M.R., Clarke C., Kang I.H., Friman O., Guertin D.A., Chang J.H., Lindquist R.A., Moffat J., et al. . 2006. CellProfiler: Image analysis software for identifying and quantifying cell phenotypes. Genome Biol. 7:R100. 10.1186/gb-2006-7-10-r100 - DOI - PMC - PubMed
    1. Colombelli, J., Tängemo C., Haselman U., Antony C., Stelzer E.H.K., Pepperkok R., and Reynaud E.G.. 2008. A correlative light and electron microscopy method based on laser micropatterning and etching. Methods Mol. Biol. 457:203–213. 10.1007/978-1-59745-261-8_15 - DOI - PubMed

Publication types

MeSH terms