. 2022 Dec 23;8(51):eadc9245.
doi: 10.1126/sciadv.adc9245. Epub 2022 Dec 23.

Circulating hemopexin modulates anthracycline cardiac toxicity in patients and in mice

Affiliations

Circulating hemopexin modulates anthracycline cardiac toxicity in patients and in mice

Jing Liu et al. Sci Adv. .

Abstract

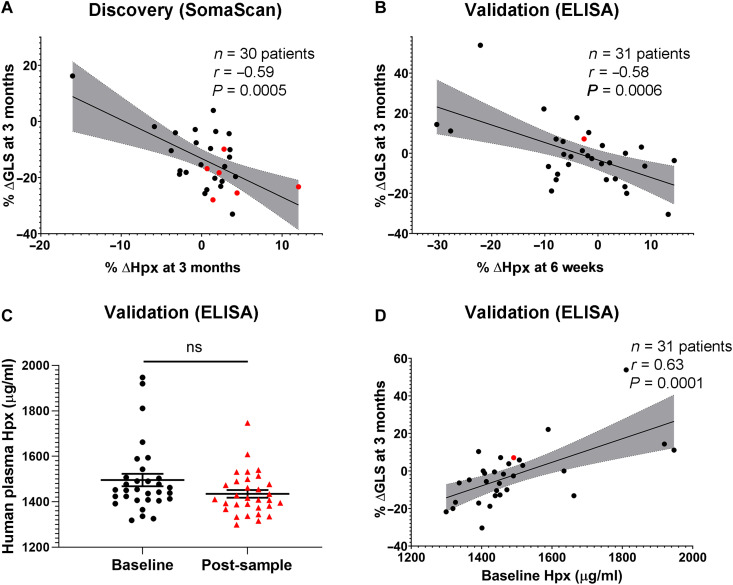
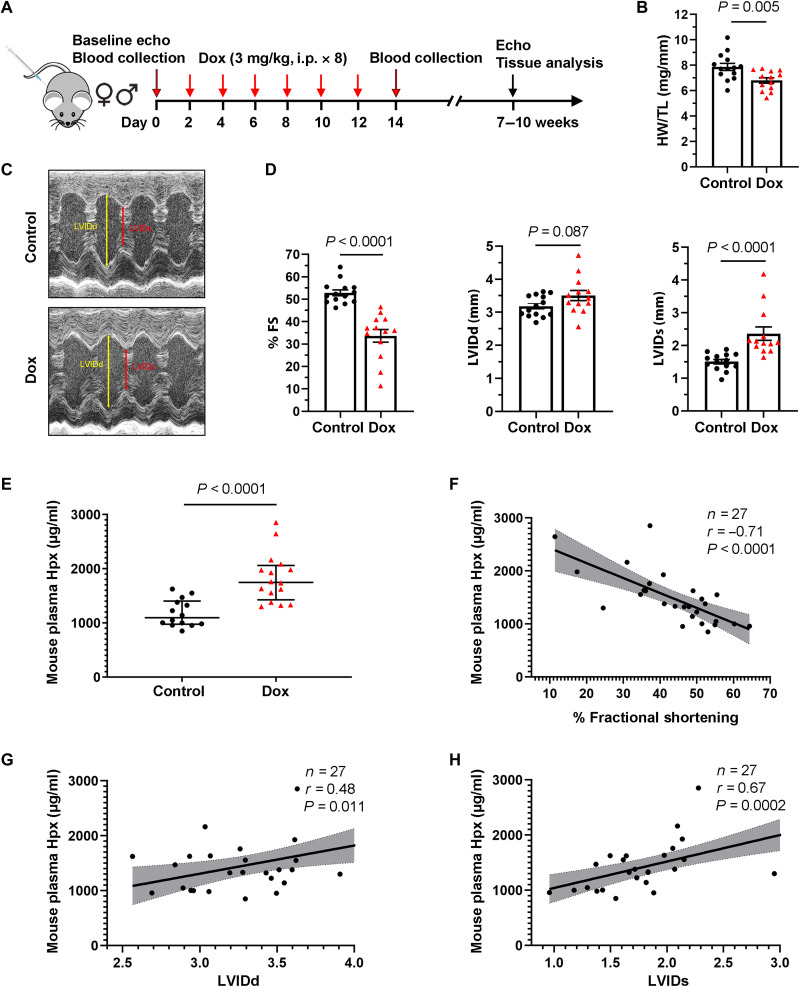
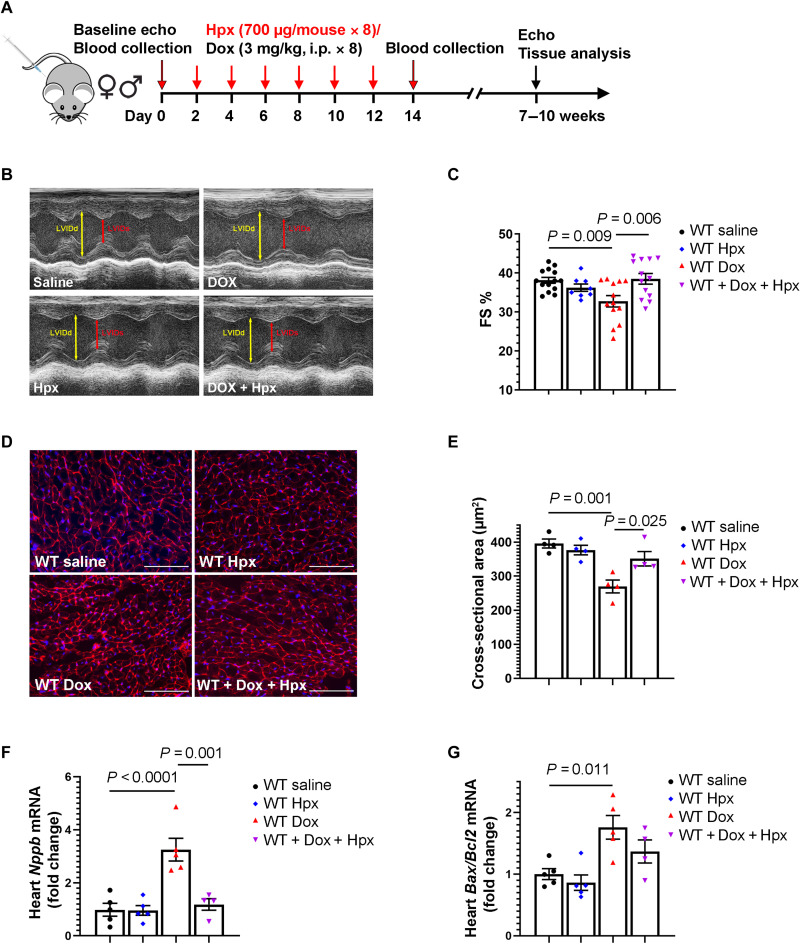
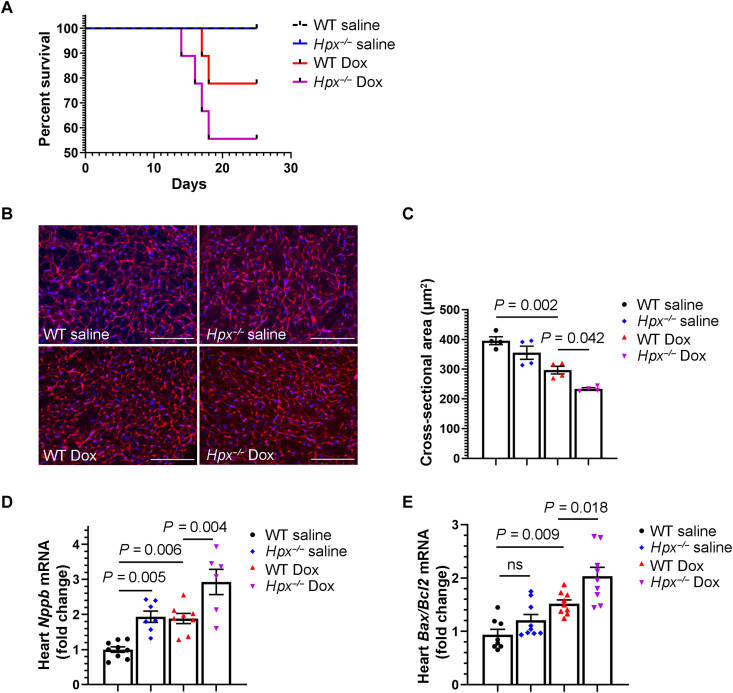
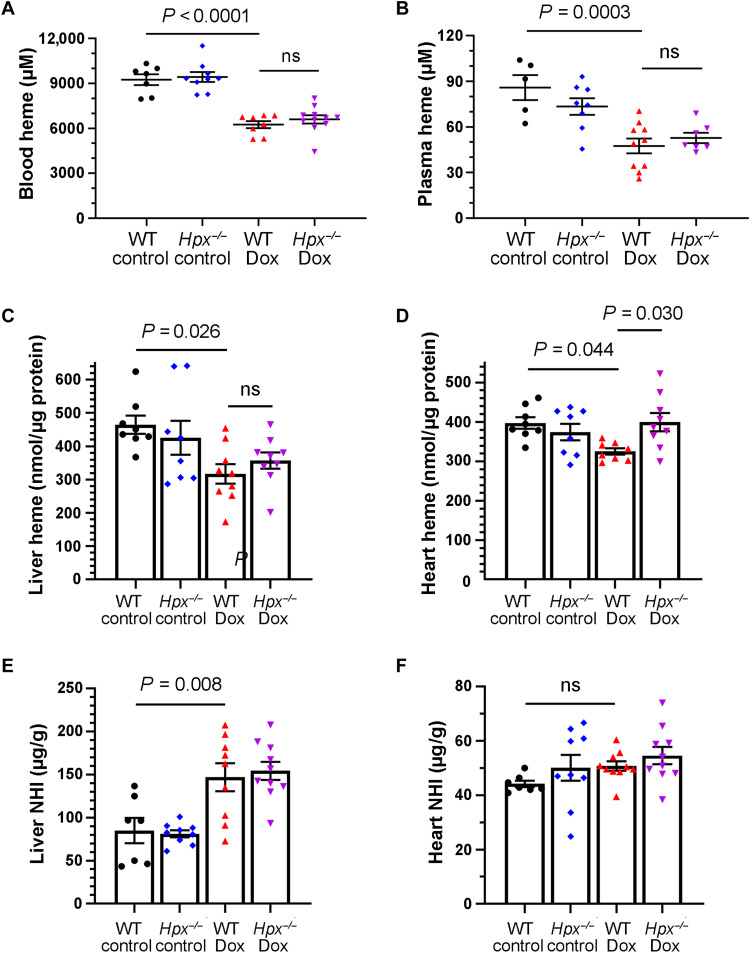
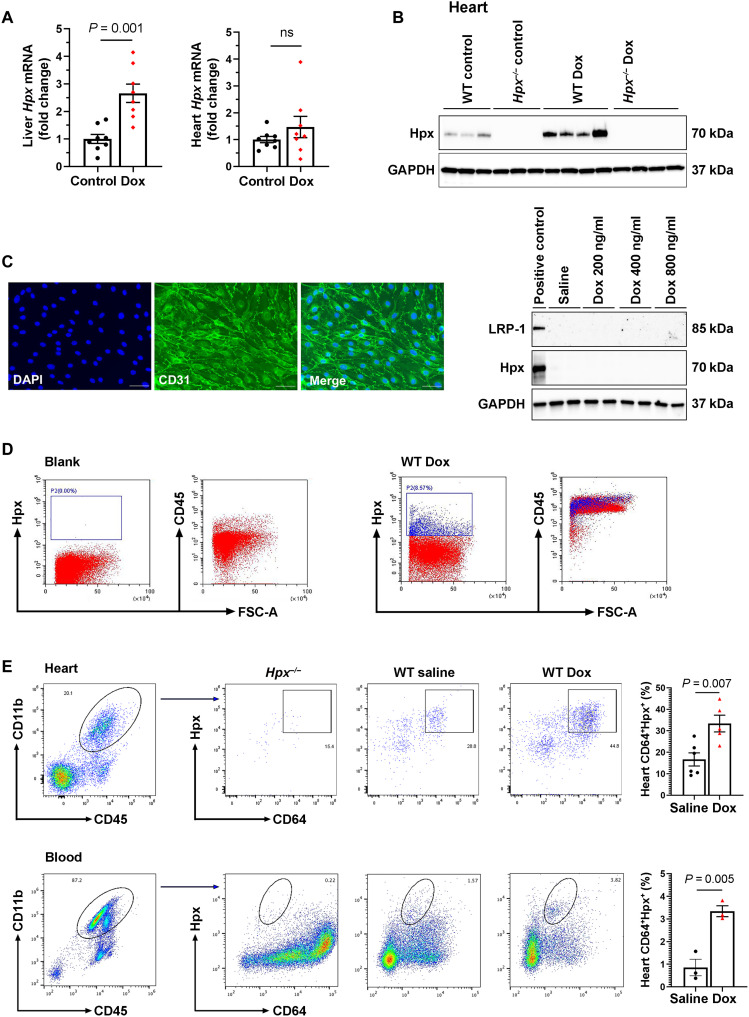
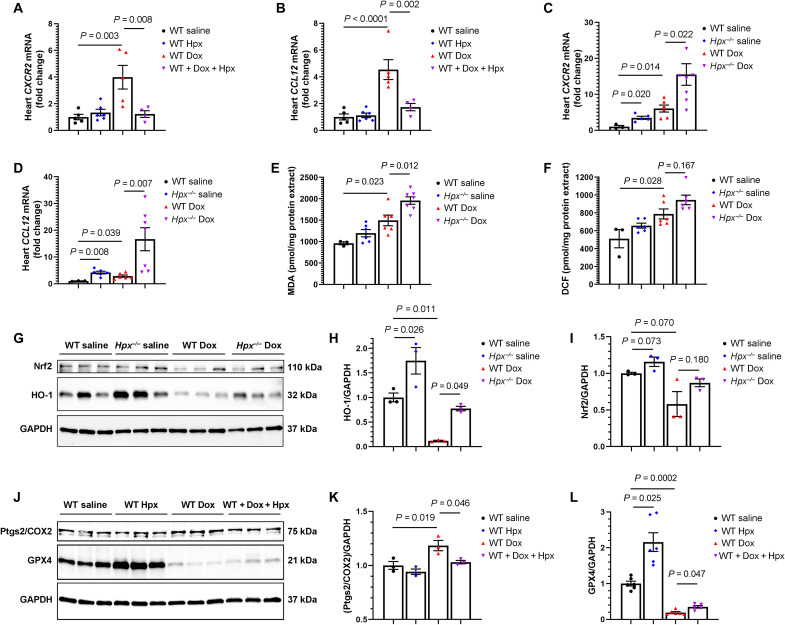
Anthracyclines such as doxorubicin (Dox) are effective chemotherapies, but their use is limited by cardiac toxicity. We hypothesized that plasma proteomics in women with breast cancer could identify new mechanisms of anthracycline cardiac toxicity. We measured changes in 1317 proteins in anthracycline-treated patients (n = 30) and replicated key findings in a second cohort (n = 31). An increase in the heme-binding protein hemopexin (Hpx) 3 months after anthracycline initiation was associated with cardiac toxicity by echocardiography. To assess the functional role of Hpx, we administered Hpx to wild-type (WT) mice treated with Dox and observed improved cardiac function. Conversely, Hpx-/- mice demonstrated increased Dox cardiac toxicity compared to WT mice. Initial mechanistic studies indicate that Hpx is likely transported to the heart by circulating monocytes/macrophages and that Hpx may mitigate Dox-induced ferroptosis to confer cardioprotection. Together, these observations suggest that Hpx induction represents a compensatory response during Dox treatment.


Figures

Fig. 1.
Fig. 1.. Circulating Hpx levels in two patient cohorts.
(A and B) Change in plasma Hpx as measured between 6 weeks and 3 months following initiation of anthracyclines was associated with change in GLS (absolute value) at 3 months in patients with breast cancer enrolled in the discovery and validation cohorts, respectively. (C) Absolute value of plasma Hpx at baseline (before anthracyclines) and at 6 weeks following the initiation of anthracyclines in the validation cohort, as measured by ELISA. (D) Baseline plasma Hpx concentration was associated with change in GLS at 3 months. All patients were treated with dose-dense doxorubicin and cyclophosphamide (ddAC). Patients denoted in red developed symptoms of heart failure. Pearson’s correlation coefficient was used to compare percent change in ∆Hpx or baseline Hpx to percent change in ∆GLS. ns indicates that there was no significant difference between the groups.
Fig. 2.
Fig. 2.. Circulating Hpx is elevated in mice treated with Dox.
(A) Dox-induced chronic cardiomyopathy model in mice. i.p., intraperitoneally. (B) Heart weight (HW)/tibia length (TL) ratio in saline-treated (control) and Dox-treated (Dox) groups. (C) Representative images of control and Dox mice obtained during conscious echocardiography. (D) Cardiac function at 5 to 8 weeks after Dox treatment: FS, LVIDd, and LVIDs in control and Dox groups. FS, fractional shortening. (E) Absolute levels of mouse plasma Hpx following treatment in control and Dox groups. (F to H) Absolute levels of mouse plasma Hpx after treatment were associated with change in % FS, LVIDd, and LVIDs. Data were expressed as means ± SEM. Welch’s t test was used to compare the difference between control (n = 14) and Dox-treated (n = 13) groups. Pearson’s correlation coefficient was used in (F) to (H).
Fig. 3.
Fig. 3.. Treatment with exogenous Hpx protects against anthracycline cardiac toxicity.
(A) Mouse treatment protocol. (B) Representative images obtained during sedated echocardiography. (C) FS % at 5 weeks after Dox or Hpx treatment. n = 15 for WT saline group, n = 9 for WT/Hpx group, n = 13 for WT/Dox group, and n = 13 for WT/Dox + Hpx group. (D) Representative images of WGA staining in the heart. Scale bars, 100 μm. (E) Cardiomyocyte cross-sectional area in WT mice treated with saline, Hpx, Dox, or Dox + Hpx. n = 4 per group. (F and G) Cardiac Nppb (n = 5, 5, 5, and 4, respectively) and Bax/Bcl2 ratio (n = 5, 5, 5, and 4, respectively) measured by reverse transcription quantitative polymerase chain reaction (RT-qPCR) within 24 hours after completion of the 2-week Dox regimen. Data were expressed as means ± SEM. Ordinary one-way analysis of variance (ANOVA) followed by the Tukey-Kramer test was used to compare the means of experimental groups.
Fig. 4.
Fig. 4.. Hpx deficiency exacerbates anthracycline cardiac toxicity.
(A) Survival curves of WT and Hpx−/− mice treated with saline or Dox. (B) Representative images of WGA staining in the heart. Scale bars, 100 μm. (C) Cardiomyocyte cross-sectional area in WT mice or Hpx−/− mice treated with saline or Dox, respectively. n = 4 per group. (D and E) Cardiac Nppb (n = 9, 7, 8, and 6, respectively) and Bax/Bcl2 ratio (n = 8, 9, 9, and 9, respectively) measured by RT-qPCR within 24 hours after completion of the 2-week Dox regimen. Data were expressed as means ± SEM. Ordinary one-way ANOVA followed by the Tukey-Kramer test was used to compare the means of experimental groups.
Fig. 5.
Fig. 5.. Regulation of heme and NHI in Dox cardiac toxicity.
(A to D) Heme levels in whole blood (n = 7 to 11 per group) (A), plasma (n = 5 to 10 per group) (B), liver (n = 7 to 10 per group) (C), and heart (n = 8 to 9 per group) (D) as measured within 24 hours after completion of the 2-week Dox regimen in mice. (E and F) NHI in the liver (n = 7 to 10 per group) (E) and heart (n = 7 to 10 per group) (F) within 24 hours after completion of the 2-week Dox regimen in mice. Data were expressed as means ± SEM. Ordinary one-way ANOVA followed by the Tukey-Kramer test was used to compare the means of experimental groups.
Fig. 6.
Fig. 6.. Hpx may be transported to the heart by circulating macrophages.
(A) Hpx mRNA levels in the liver and heart in mice treated with saline (control; n = 8) and Dox (n = 8) mice within 24 hours after completion of the 2-week regimen. (B) Cardiac Hpx protein level within 24 hours after completion of the 2-week regimen (n = 8). (C) Glyceraldehyde-3-phosphate dehydrogenase (GAPDH), Hpx, and LRP-1 detected by Western blot in adult MHECs treated with saline (control) or Dox at a concentration of 200, 400, and 800 ng/ml for 48 hours. The left-most lane is a liver sample that was used as a positive control. DAPI, 4′,6-diamidino-2-phenylindole. (D) Circulating Hpx-expressing cells were CD45+ immune cells, as determined by fluorescence-activated cell sorting (FACS). FSC-A, forward scatter area. (E) Hpx-expressing cells were CD11b+CD64+ macrophages in the heart and circulation as determined by FACS. Data were expressed as means ± SEM. Welch’s t test was used to compare the difference between control and Dox-treated groups.
Fig. 7.
Fig. 7.. Hpx modulates Dox cardiac toxicity via suppression of the inflammatory macrophage phenotype and ferroptosis.
(A and B) Cardiac CXCR2 and CCL12 mRNA levels in the heart in WT mice treated with saline (n = 5), Hpx (n = 6), Dox (n = 5), and cotreatment of Dox and Hpx (n = 4). (C and D) CXCR2 and CCL12 mRNA levels in the heart in WT or Hpx−/− mice treated with saline (n = 3 and 6) or Dox (n = 6 and 7). (E and F) Malondialdehyde (MDA) levels and DCF fluorescence in the heart in WT or Hpx−/− mice treated with saline (n = 3 and 6) or Dox (n = 6 and 7). (G) Cardiac HO-1 and Nrf2 detected by Western blot in WT or Hpx−/− mice treated with saline or Dox (n = 3 per group). (H and I) Quantification of HO-1 and Nrf2. (J) Cardiac Ptgs2/COX2 and GPX4 detected by Western blot in WT mice treated with saline, Hpx, Dox, and cotreatment of Dox and Hpx (n = 3 per group). (K and L) Quantification of Ptgs2/COX2 and GPX4. GAPDH was used as loading control. All samples were harvested within 24 hours after completion of the 2-week Dox regimen. Data were expressed as means ± SEM. Ordinary one-way ANOVA followed by the Tukey-Kramer test was used to compare the means of experimental groups.

References

    1. P. Vejpongsa, E. T. Yeh,Prevention of anthracycline-induced cardiotoxicity: Challenges and opportunities. J. Am. Coll. Cardiol. 64,938–945 (2014). - PubMed
    1. D. Cardinale, A. Colombo, G. Bacchiani, I. Tedeschi, C. A. Meroni, F. Veglia, M. Civelli, G. Lamantia, N. Colombo, G. Curigliano, C. Fiorentini, C. M. Cipolla,Early detection of anthracycline cardiotoxicity and improvement with heart failure therapy. Circulation 131,1981–1988 (2015). - PubMed
    1. G. H. Oliveira, M. Dupont, D. Naftel, S. L. Myers, Y. Yuan, W. H. Tang, G. Gonzalez-Stawinski, J. B. Young, D. O. Taylor, R. C. Starling,Increased need for right ventricular support in patients with chemotherapy-induced cardiomyopathy undergoing mechanical circulatory support: Outcomes from the INTERMACS Registry (Interagency Registry for Mechanically Assisted Circulatory Support). J. Am. Coll. Cardiol. 63,240–248 (2014). - PubMed
    1. D. Cardinale, M. T. Sandri, A. Colombo, N. Colombo, M. Boeri, G. Lamantia, M. Civelli, F. Peccatori, G. Martinelli, C. Fiorentini, C. M. Cipolla,Prognostic value of troponin I in cardiac risk stratification of cancer patients undergoing high-dose chemotherapy. Circulation 109,2749–2754 (2004). - PubMed
    1. B. G. Demissei, R. A. Hubbard, L. Zhang, A. M. Smith, K. Sheline, C. McDonald, V. Narayan, S. M. Domchek, A. DeMichele, P. Shah, A. S. Clark, K. Fox, J. Matro, A. R. Bradbury, H. Knollman, K. D. Getz, S. H. Armenian, J. L. Januzzi, W. H. W. Tang, P. Liu, B. Ky,Changes in cardiovascular biomarkers with breast cancer therapy and associations with cardiac dysfunction. J. Am. Heart Assoc. 9,e014708 (2020). - PMC - PubMed