. 2022 Dec 23;7(78):eadd0665.
doi: 10.1126/sciimmunol.add0665. Epub 2022 Dec 23.

Neutrophils and macrophages drive TNF-induced lethality via TRIF/CD14-mediated responses

Affiliations

Neutrophils and macrophages drive TNF-induced lethality via TRIF/CD14-mediated responses

Hayley I Muendlein et al. Sci Immunol. .

Abstract

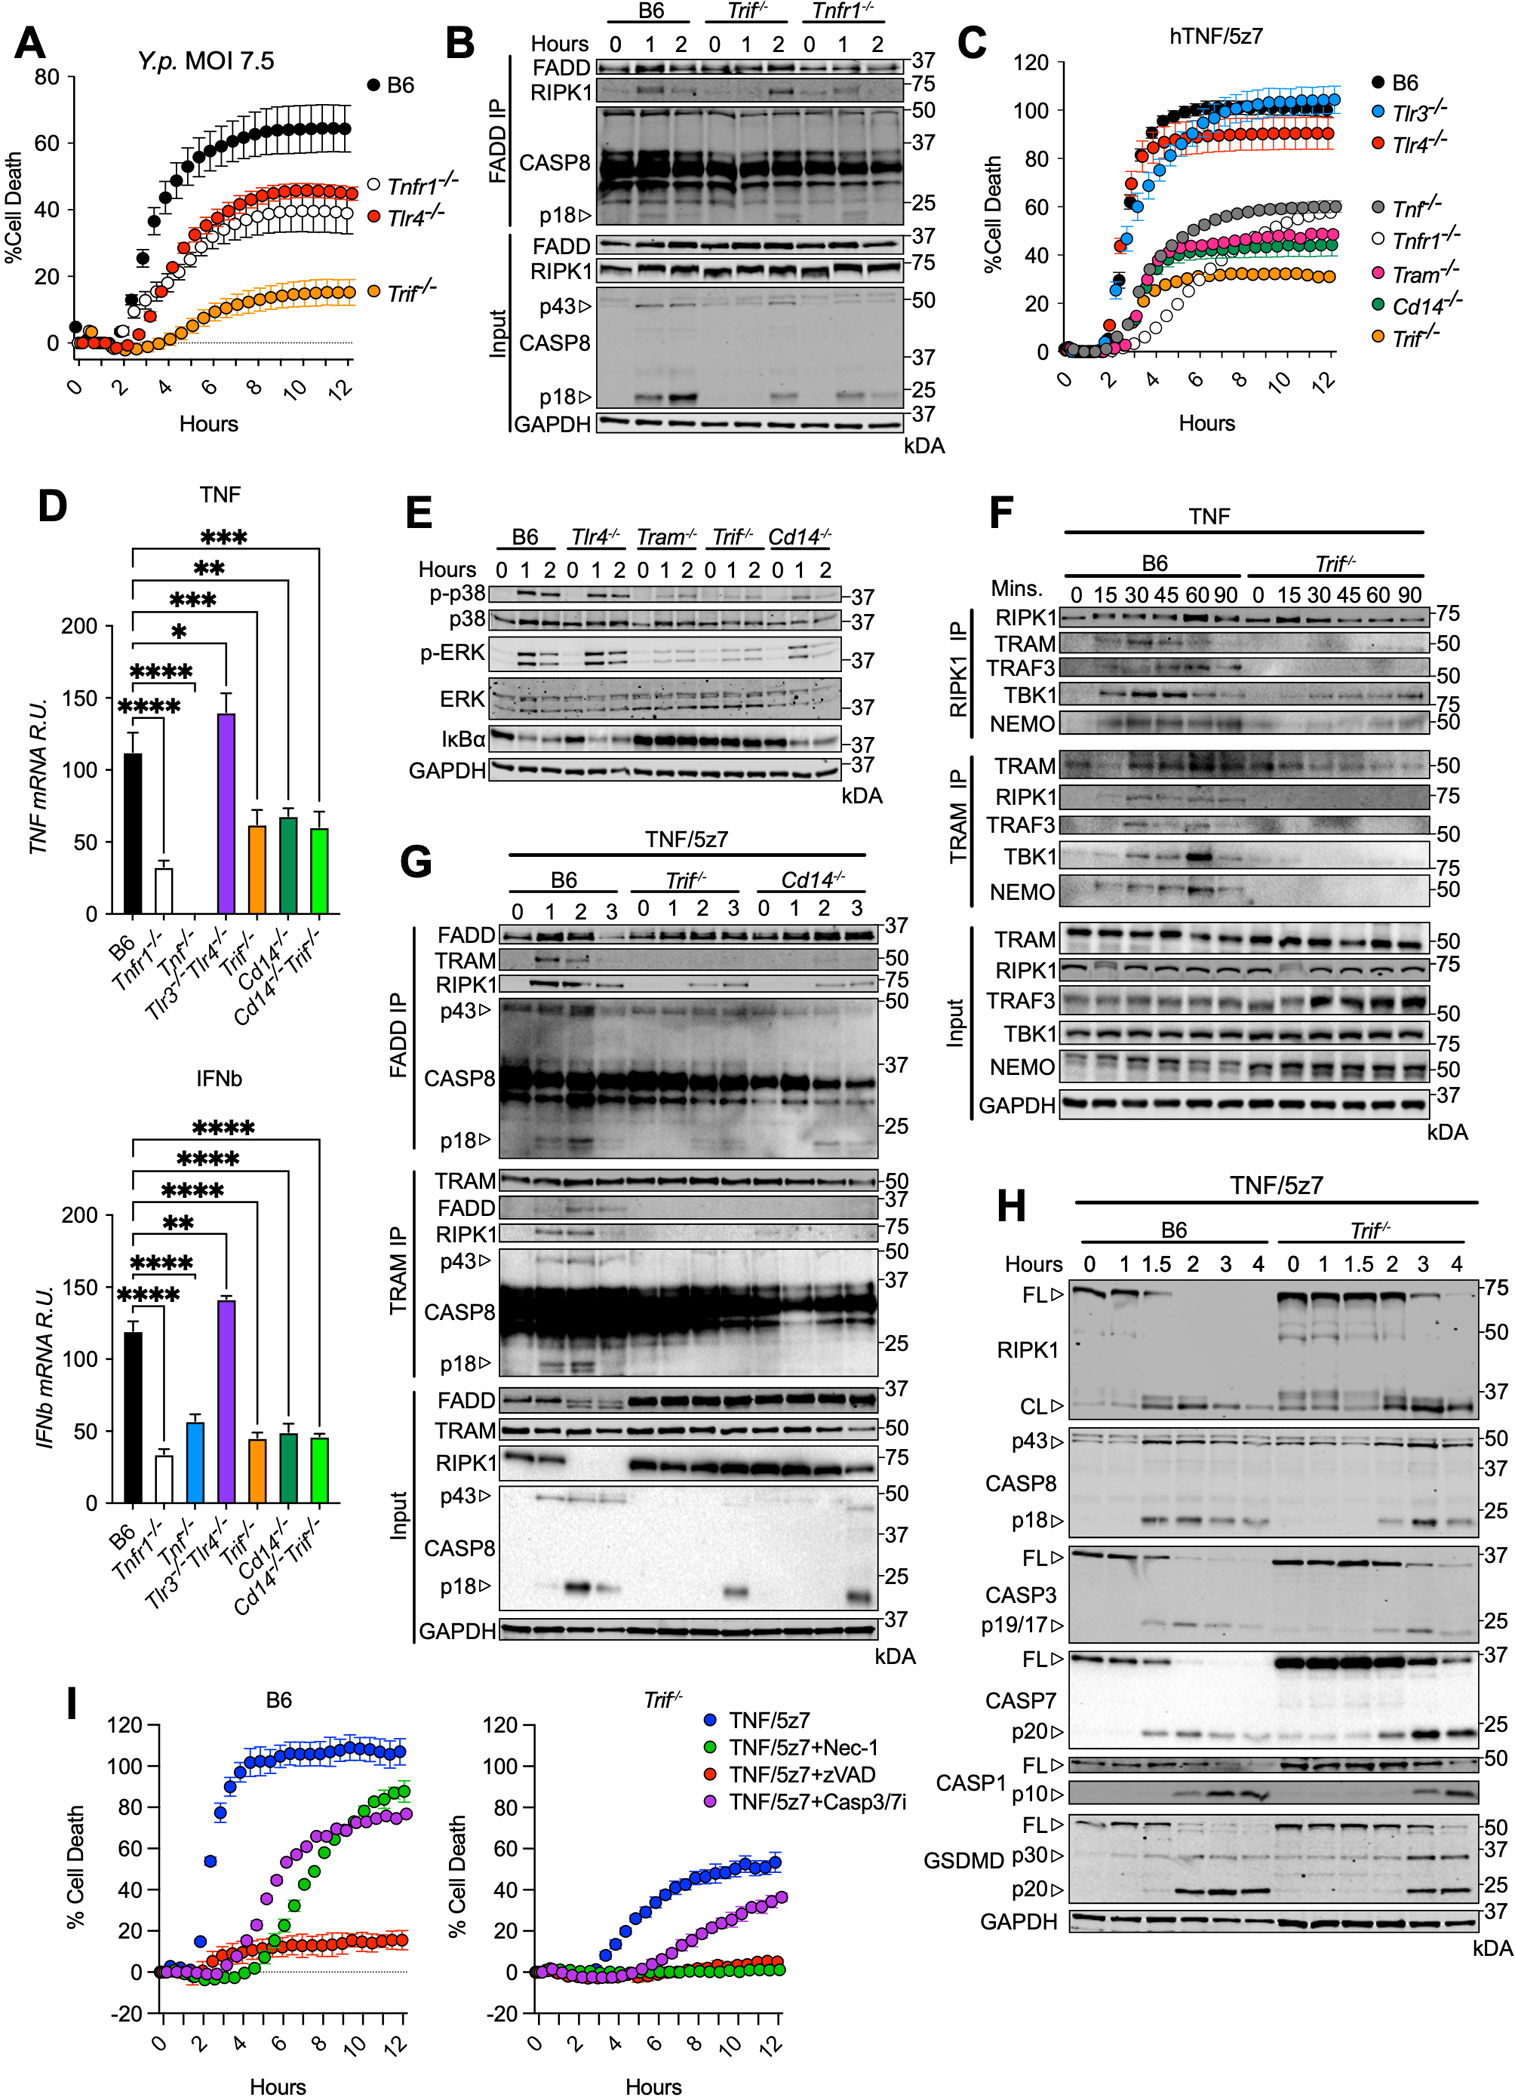
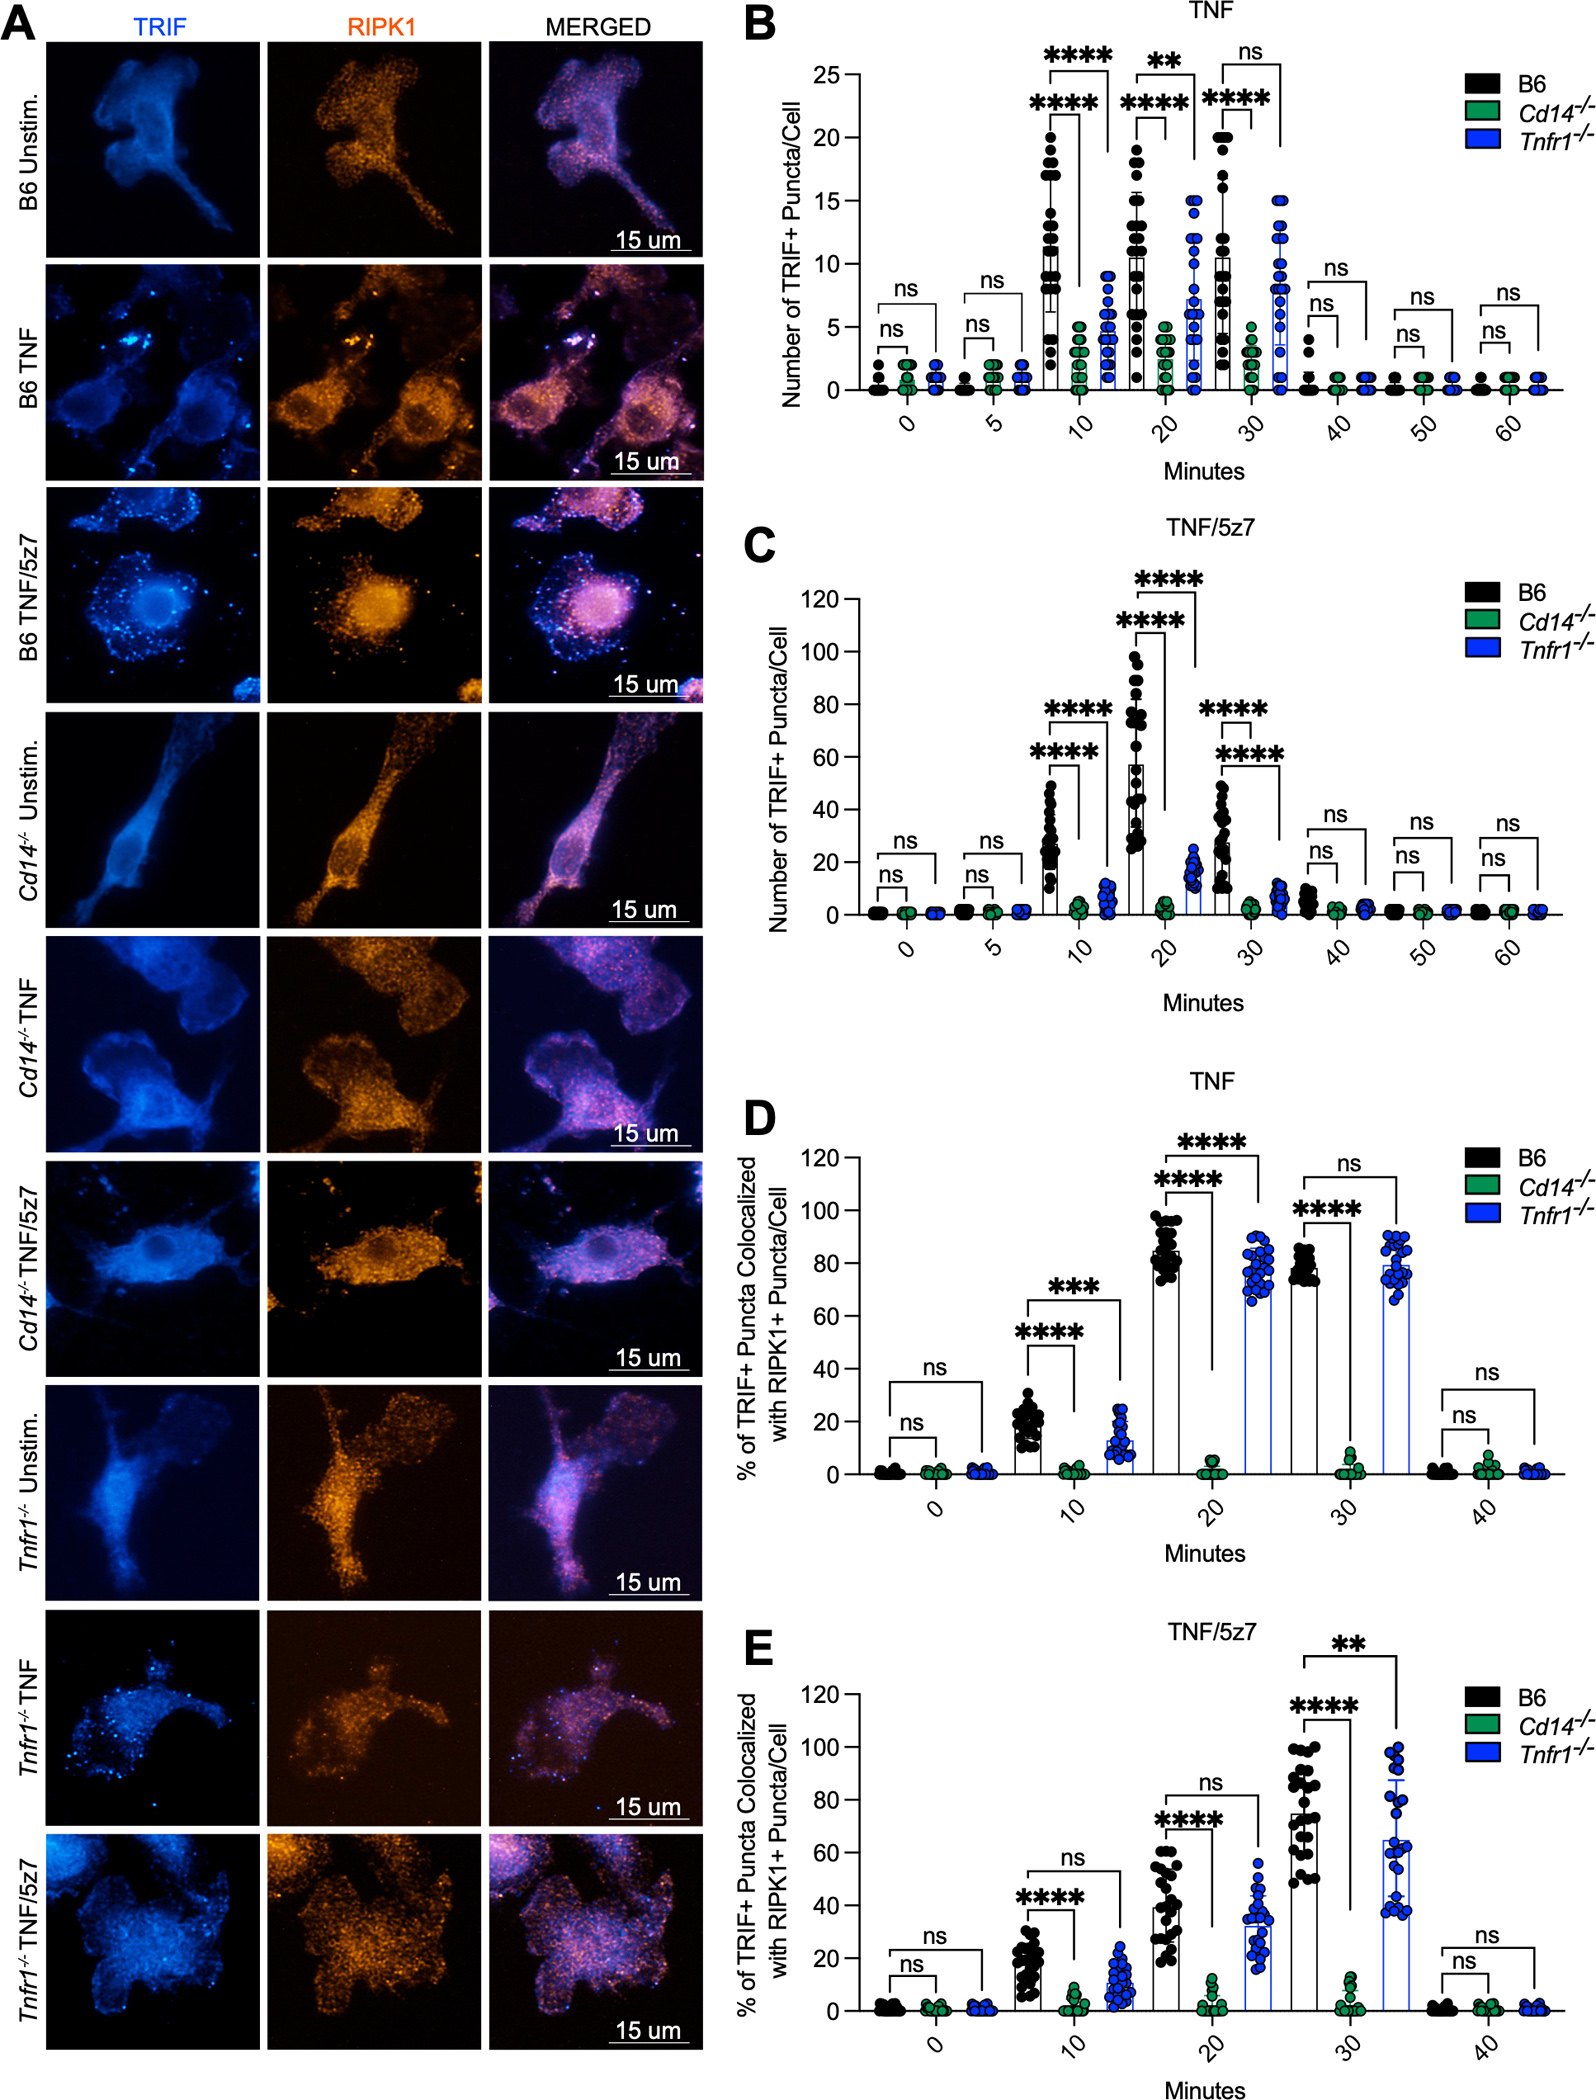
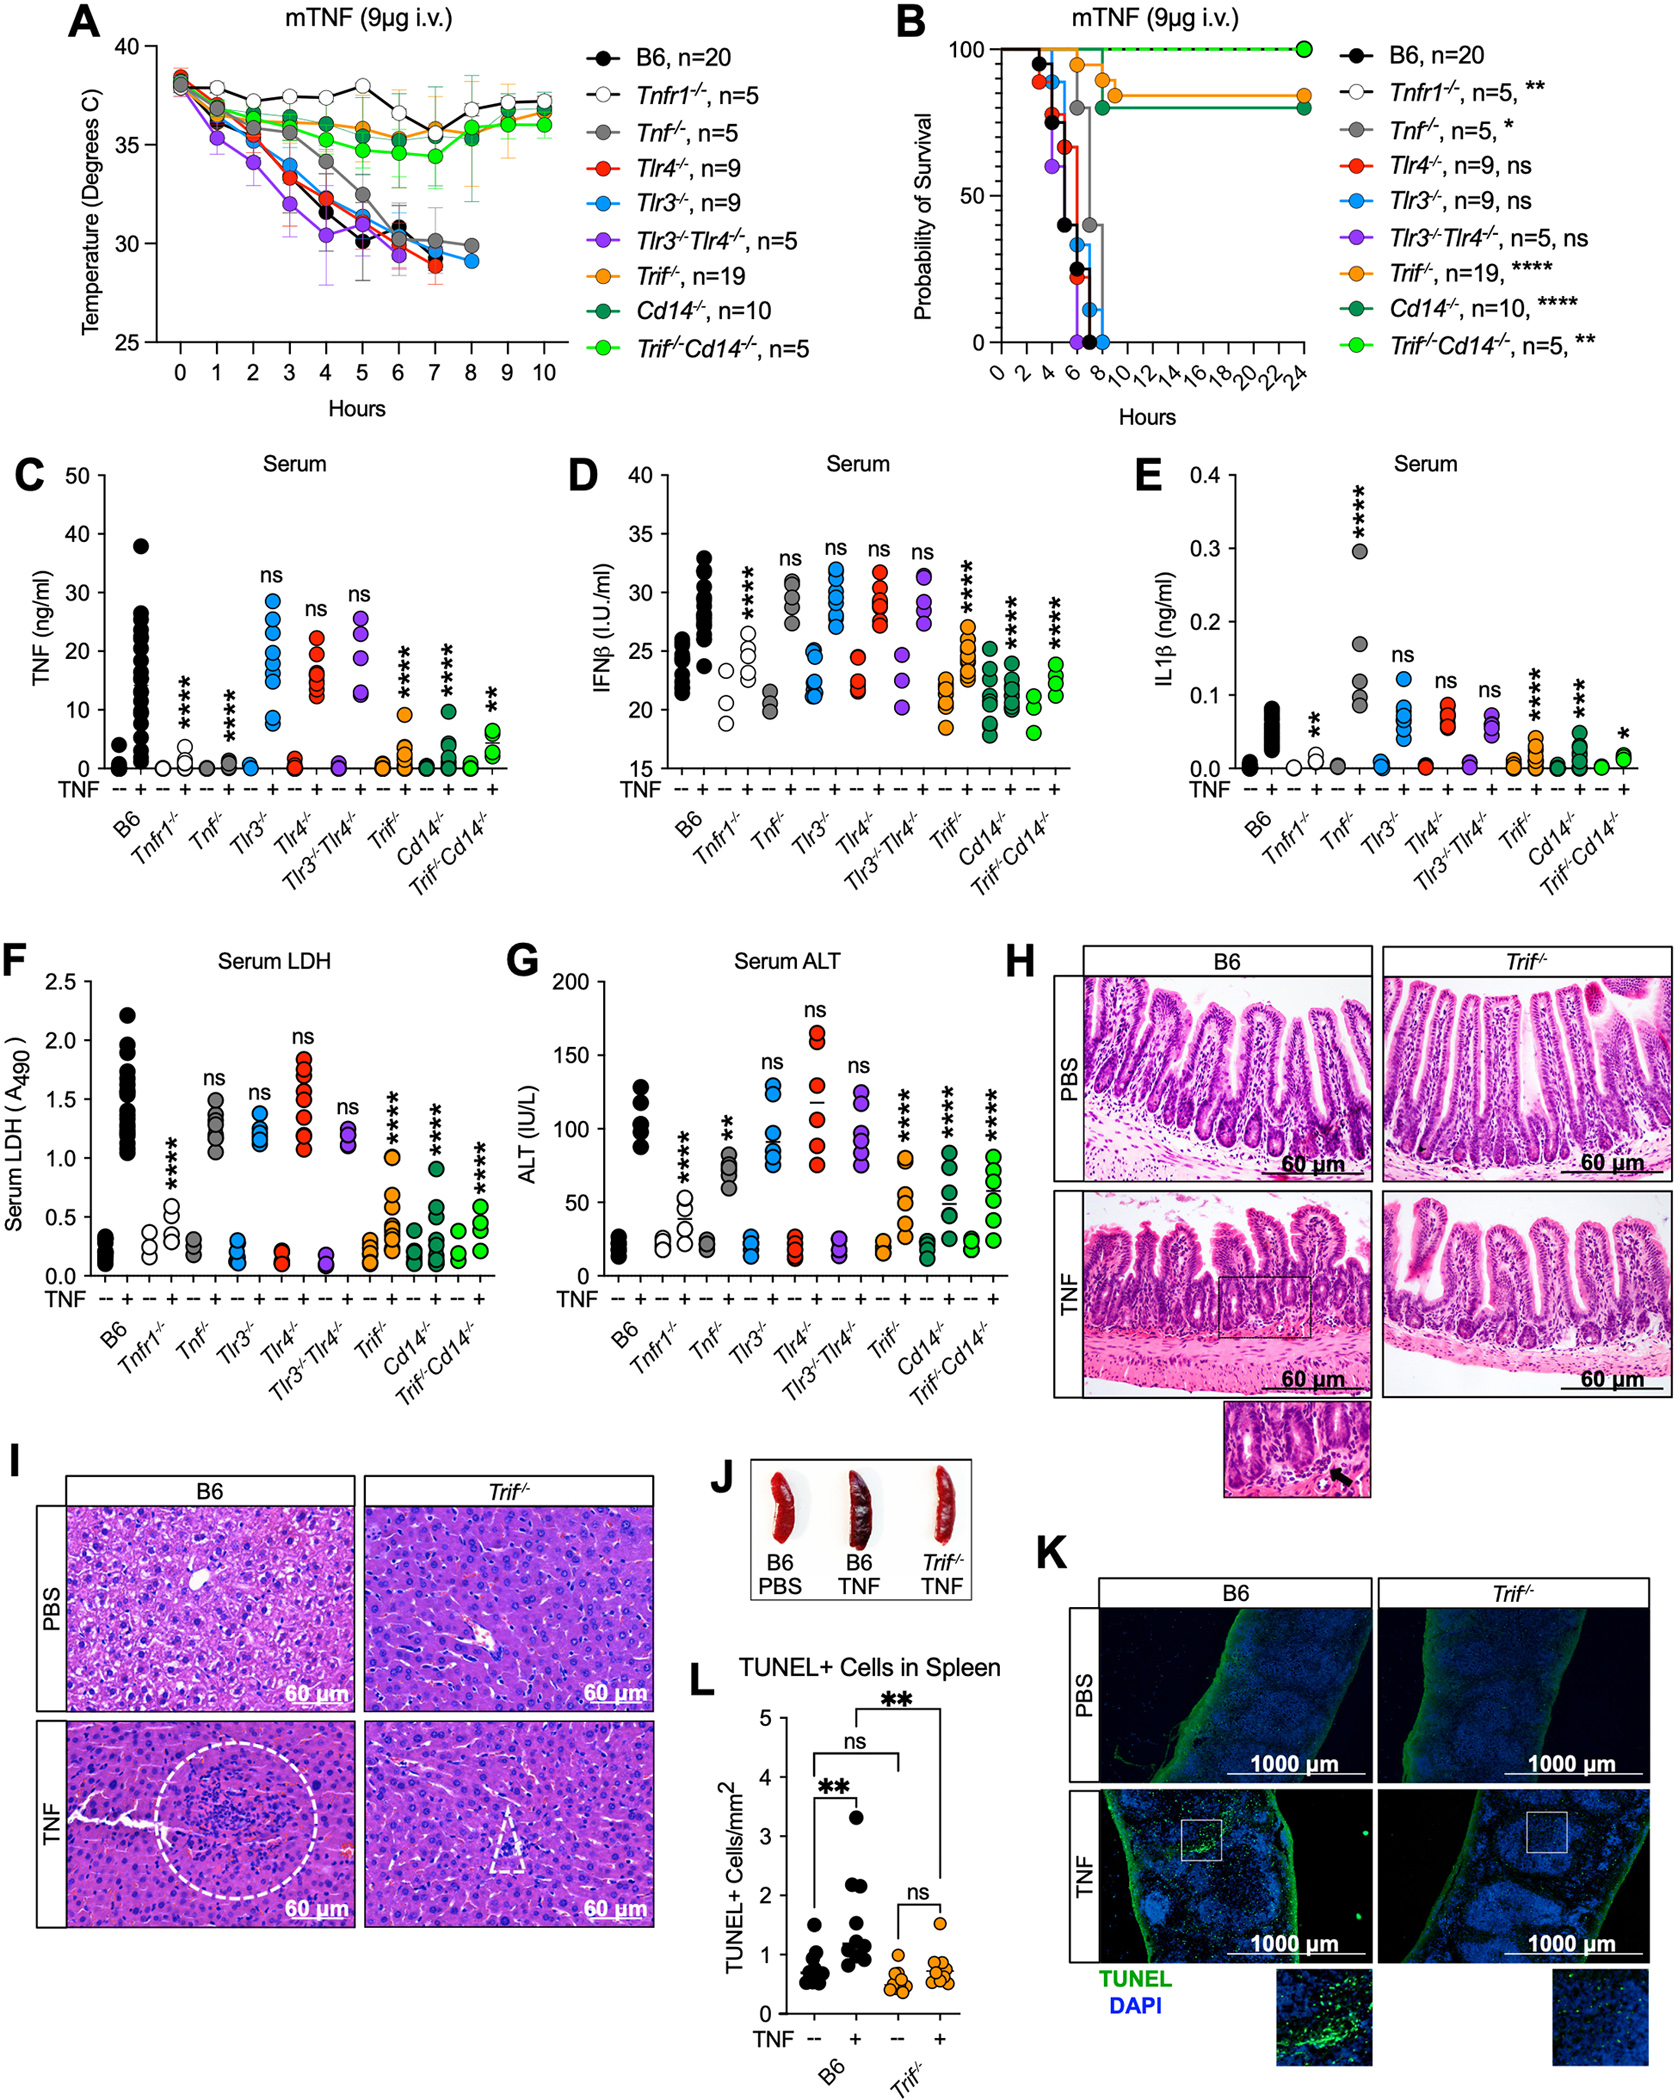
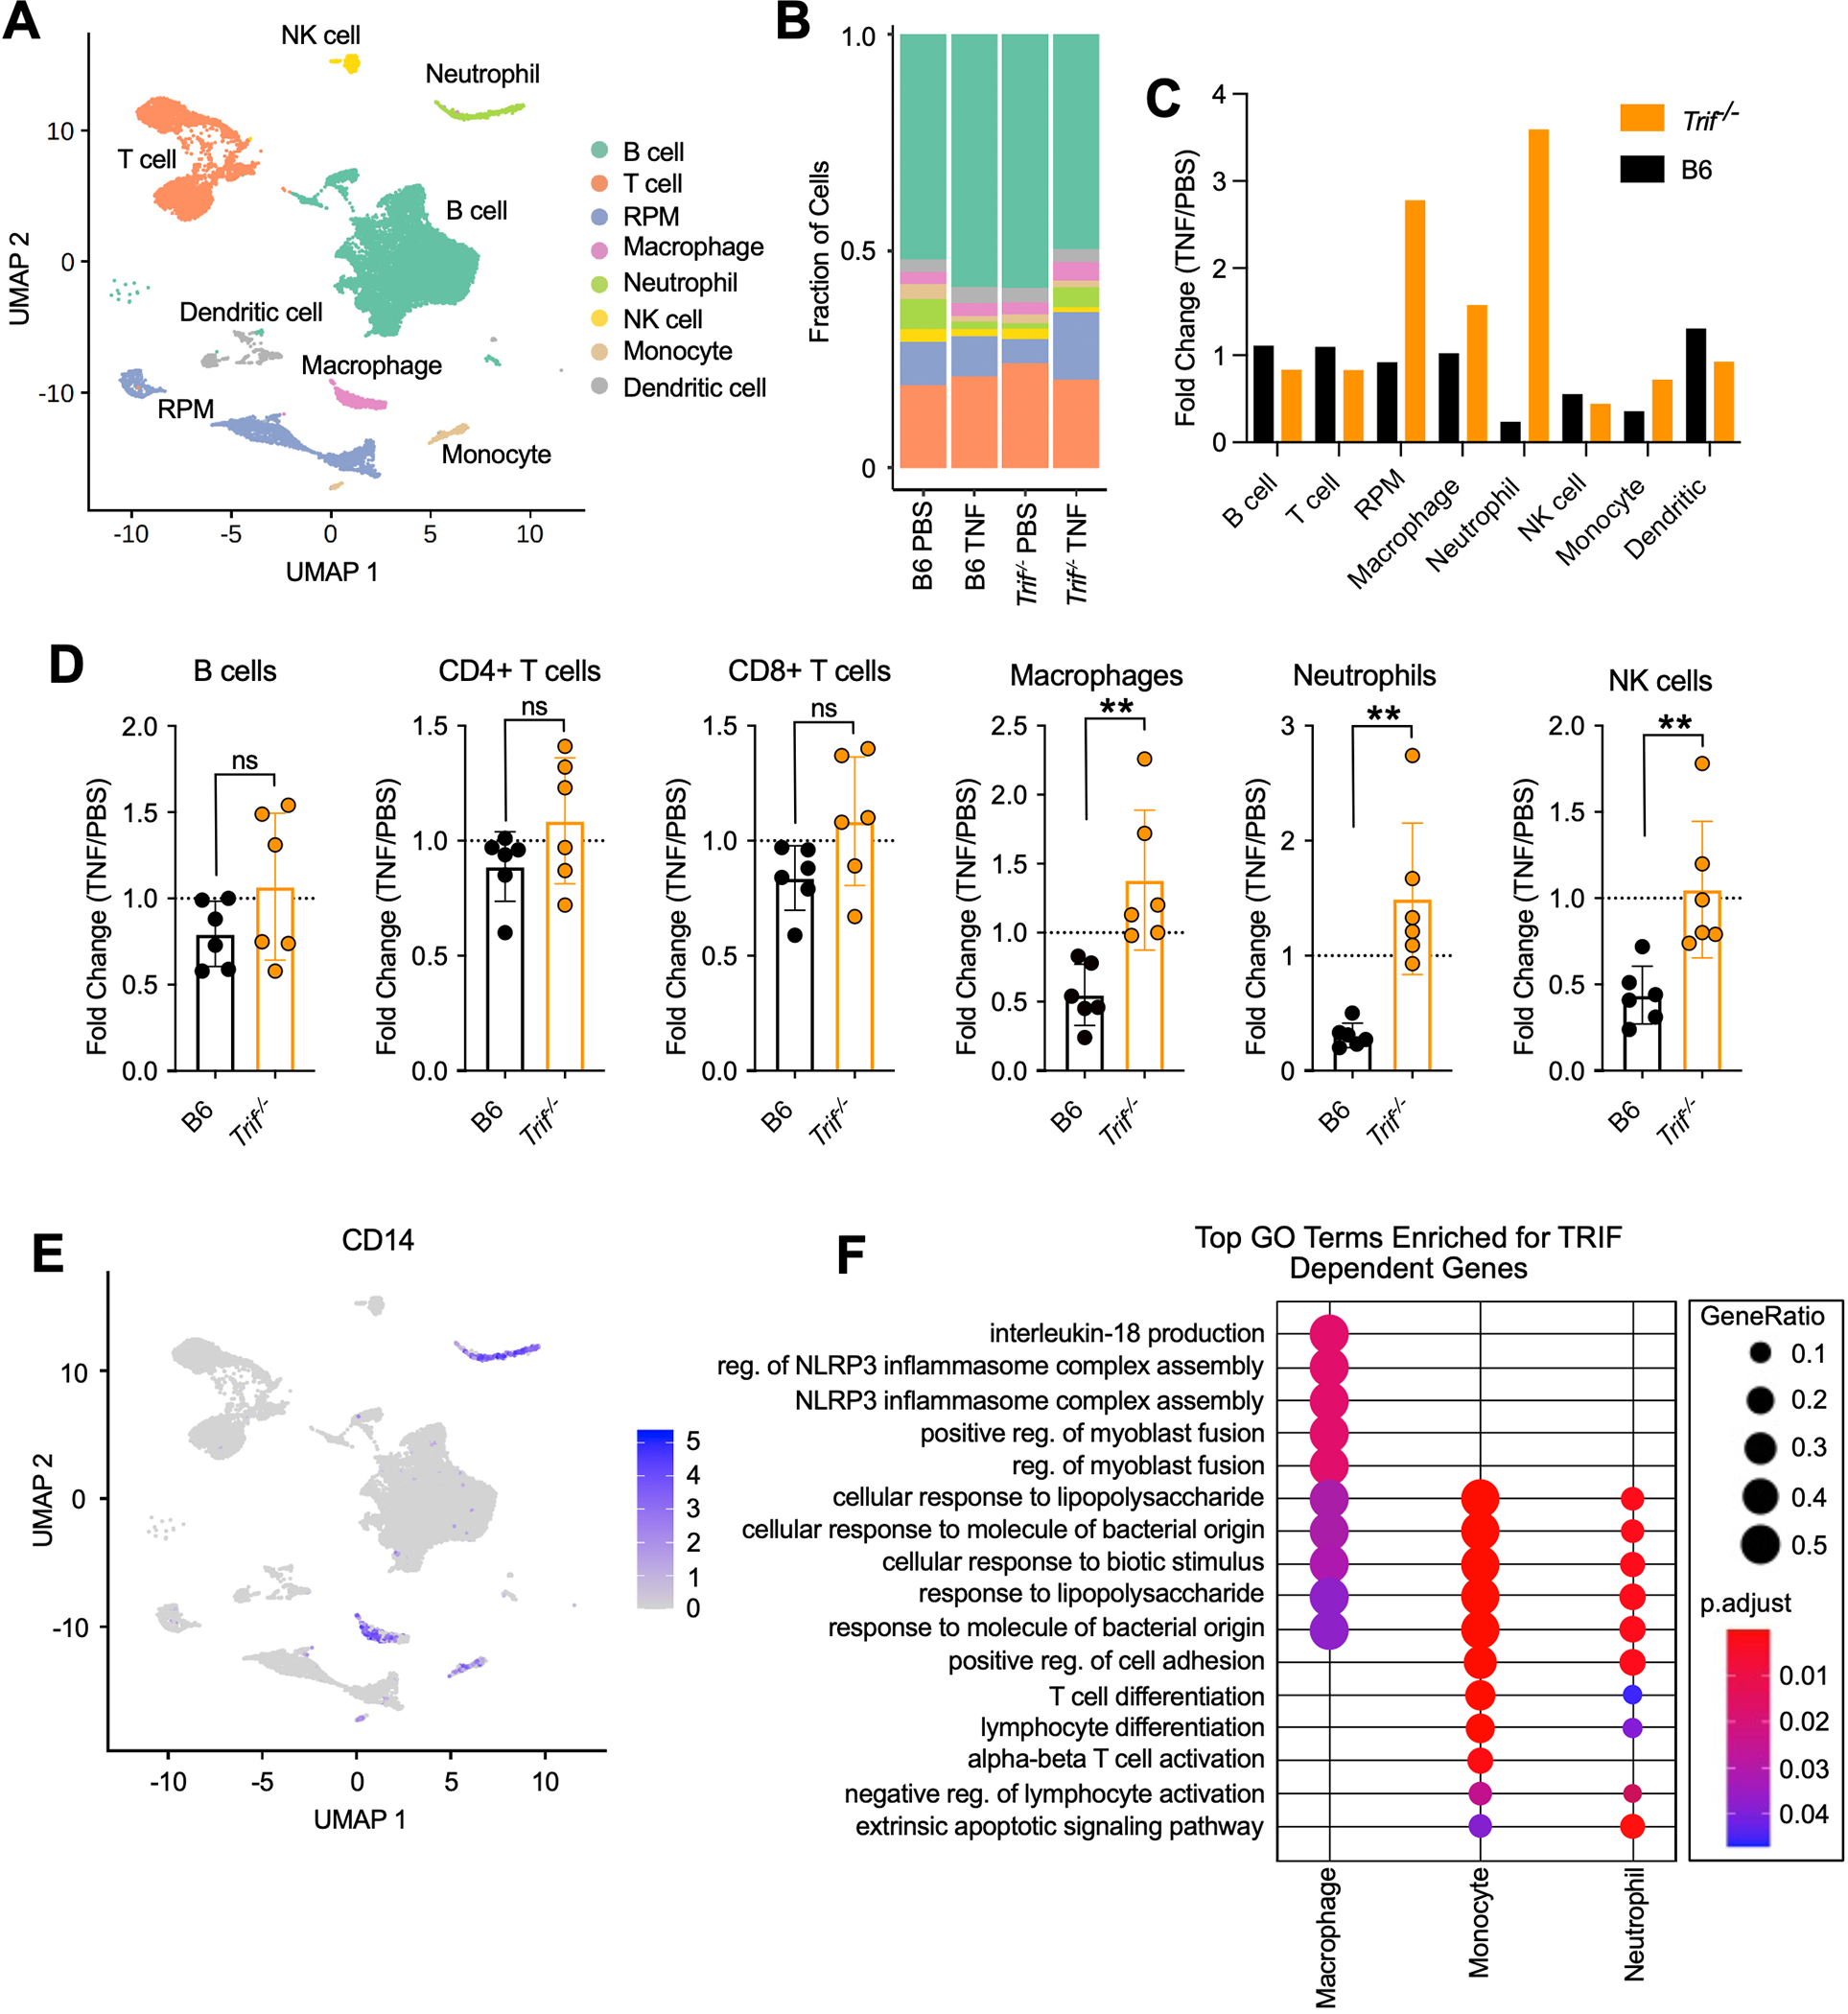
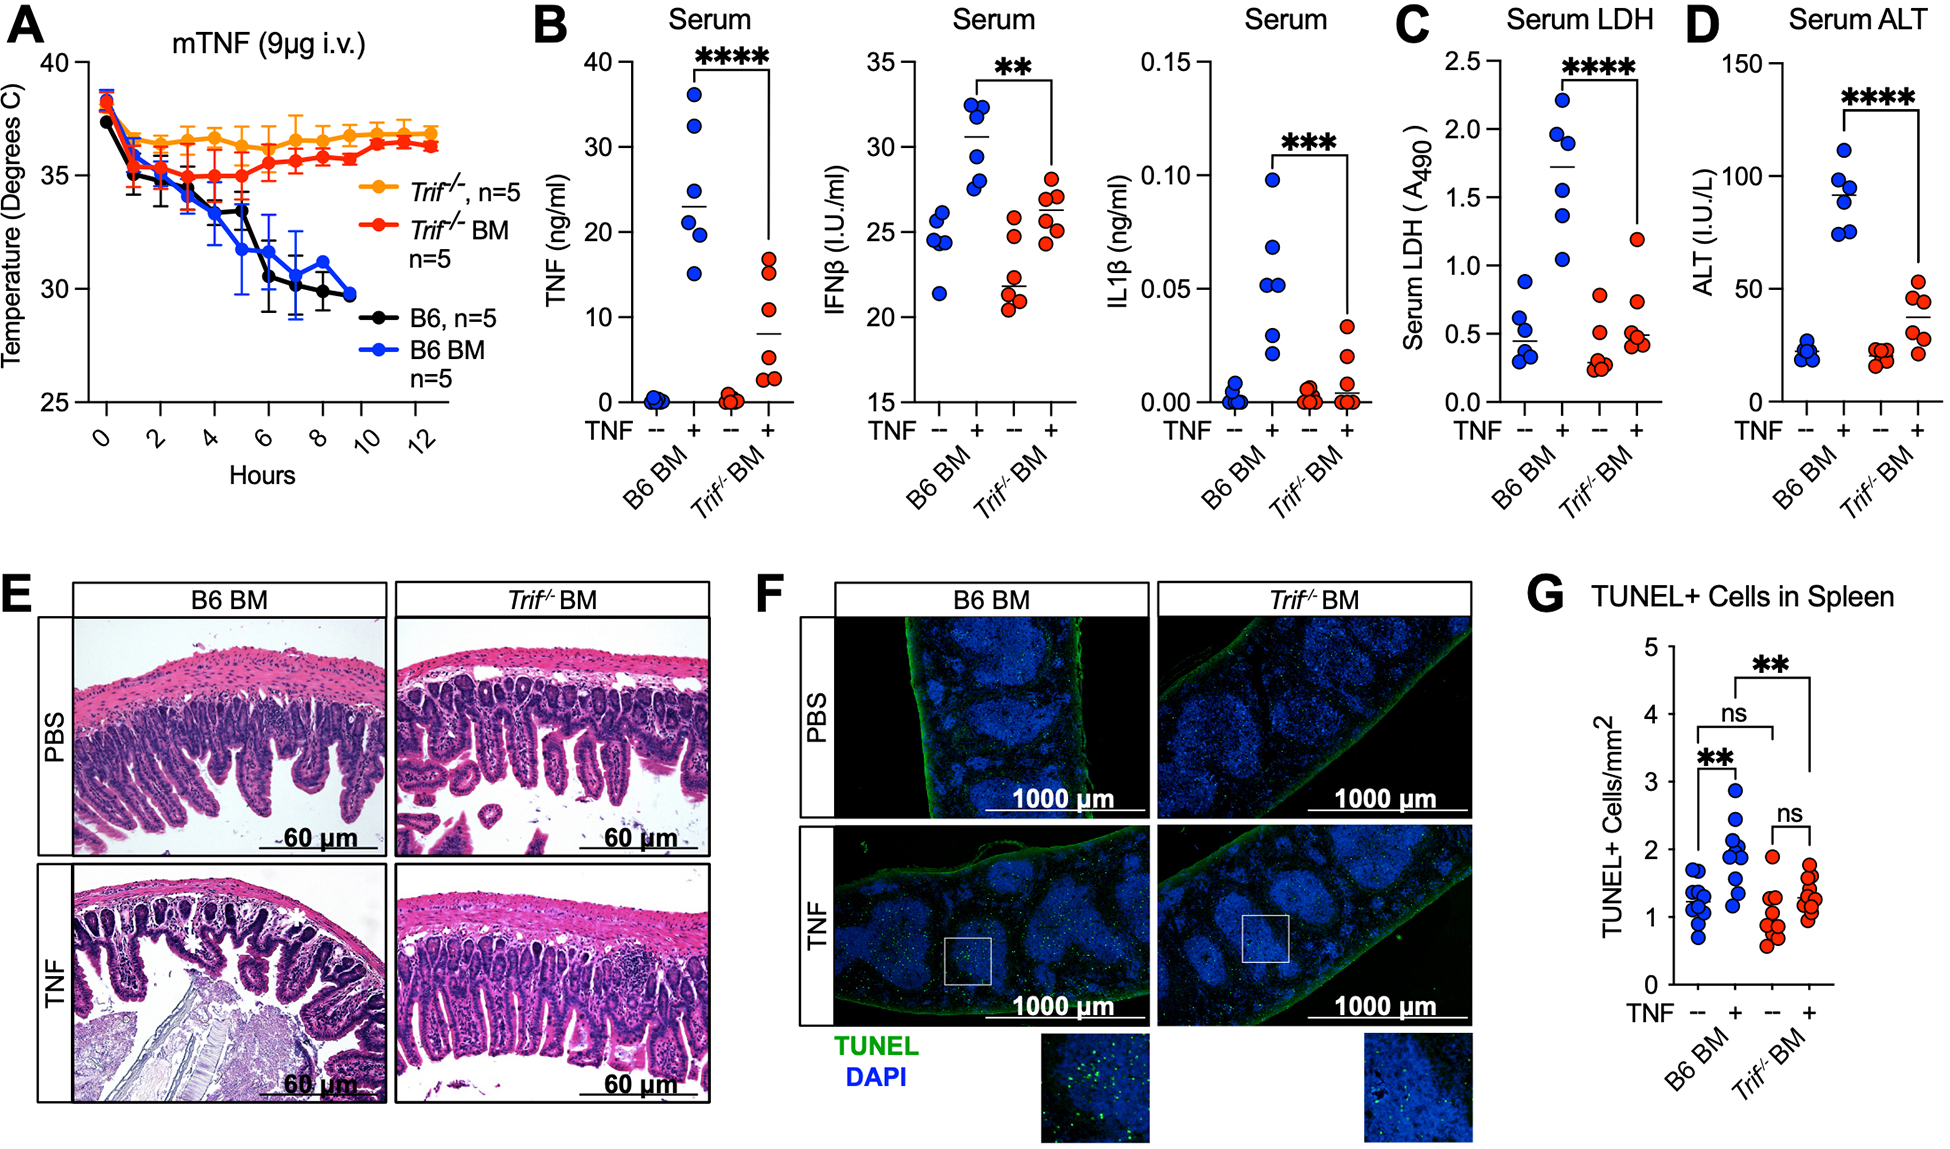
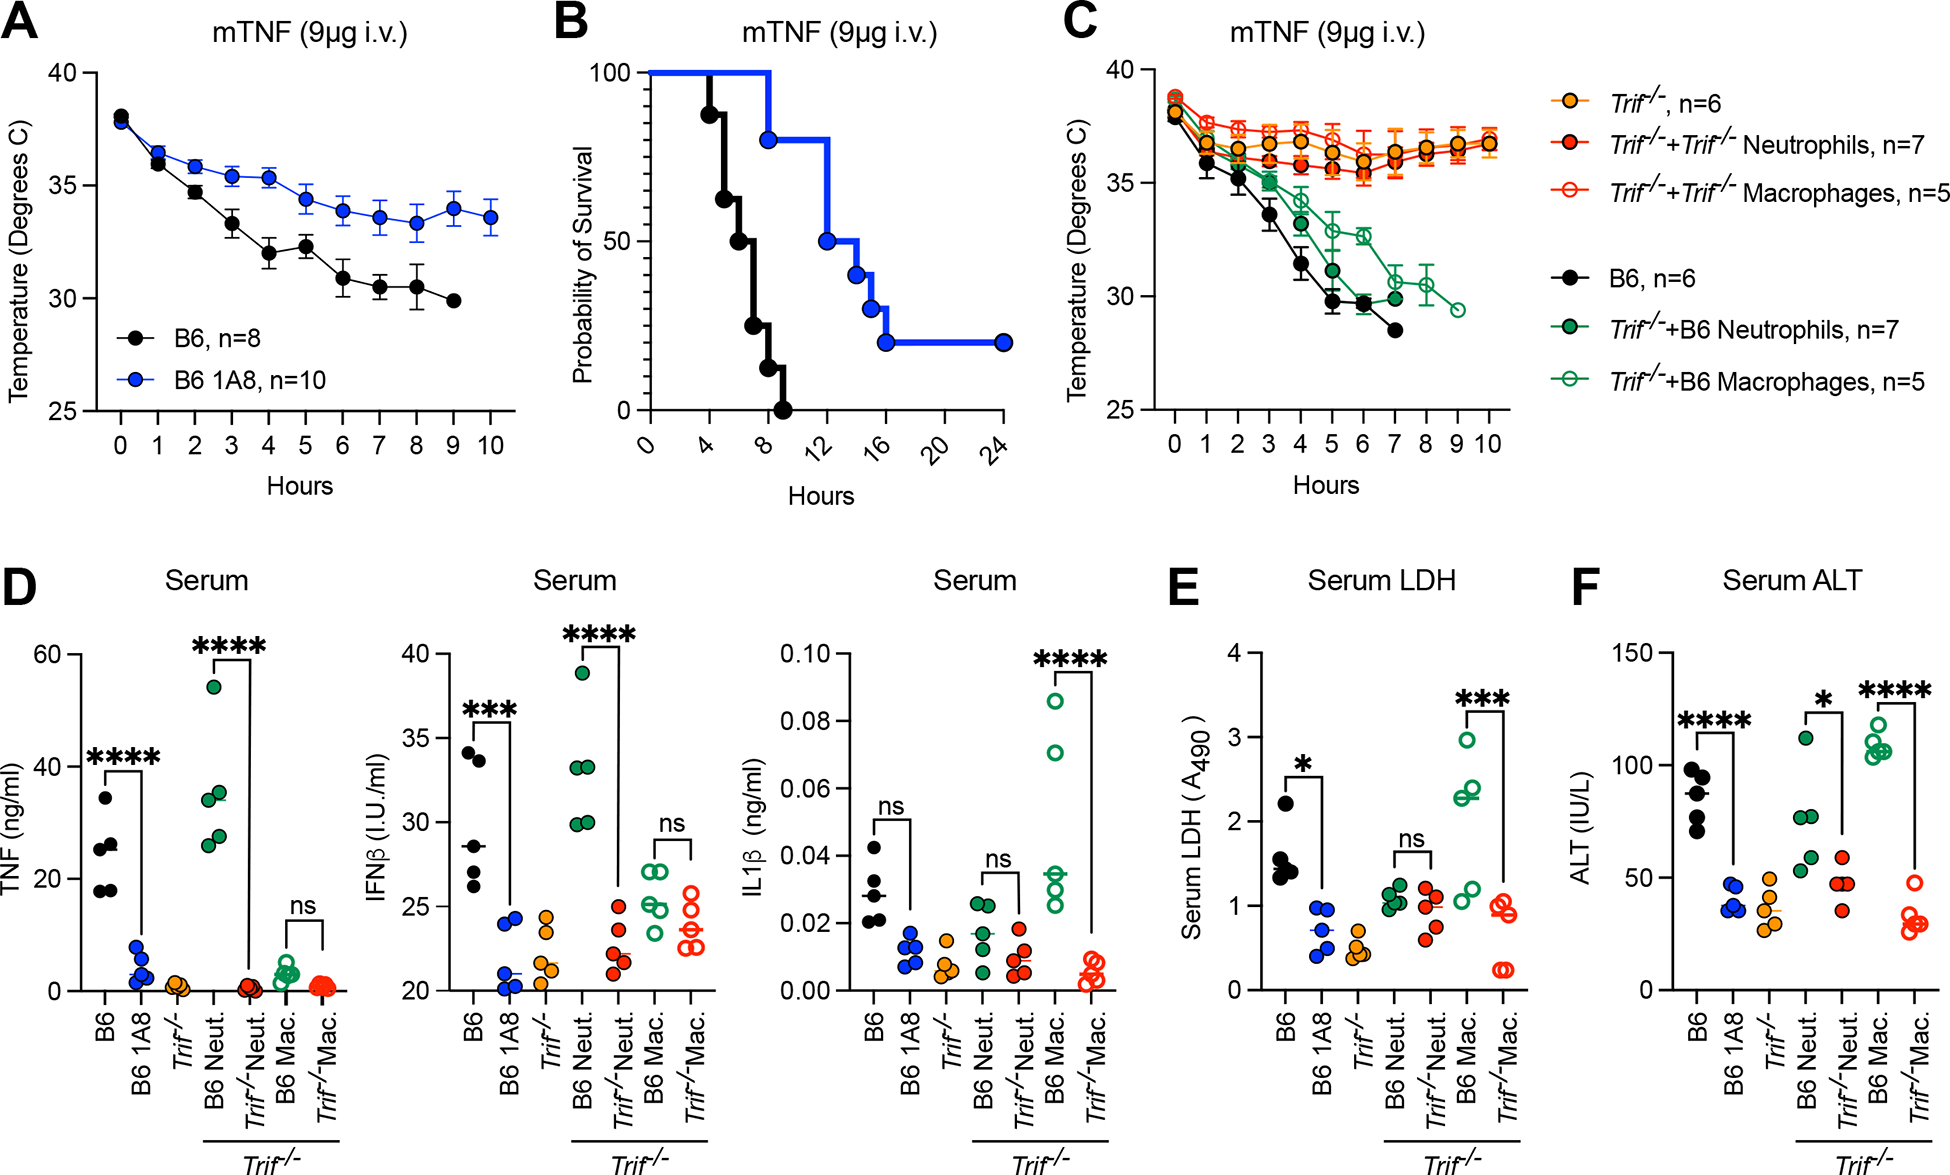
TNF mediates a variety of biological processes including cellular proliferation, inflammatory responses, and cell death and is therefore associated with numerous pathologies including autoinflammatory diseases and septic shock. The inflammatory and cell death responses to TNF have been studied extensively downstream of TNF-R1 and are believed to rely on the formation of proinflammatory complex I and prodeath complex II, respectively. We recently identified a similar multimeric complex downstream of TLR4, termed the TRIFosome, that regulates inflammation and cell death in response to LPS or Yersinia pseudotuberculosis. We present evidence of a role for the TRIFosome downstream of TNF-R1, independent of TLR3 or TLR4 engagement. Specifically, TNF-induced cell death and inflammation in murine macrophages were driven by the TLR4 adaptor TRIF and the LPS co-receptor CD14, highlighting an important role for these proteins beyond TLR-mediated immune responses. Via immunoprecipitation and visualization of TRIF-specific puncta, we demonstrated TRIF- and CD14-dependent formation of prodeath and proinflammatory complexes in response to TNF. Extending these findings, in a murine TNF-induced sepsis model, TRIF and CD14 deficiency decreased systemic inflammation, reduced organ pathology, and improved survival. The outcome of TRIF activation was cell specific, because TNF-induced lethality was mediated by neutrophils and macrophages responding to TNF in a TRIF-dependent manner. Our findings suggest that in addition to their crucial role in TNF production, myeloid cells are central to TNF toxicity and position TRIF and CD14 as universal components of receptor-mediated immune responses.


Conflict of interest statement

Competing interests: Authors declare no competing interests.

Figures

Fig. 1.
Fig. 1.. The TRIFosome potentiates TNF-induced inflammation and cell death in macrophages
(A) Cell death overtime as measured by propidium iodide incorporation in indicated bone marrow derived macrophages (BMDMs) infected with Yersinia pseudotuberculosis (Y.p.). (B) FADD immunoprecipitation in B6, Trif−/−, and Tnfr1−/− BMDMs infected with Y.p. (7.5 MOI) for indicated timepoints. (C) Cell death overtime as measured by propidium iodide incorporation in indicated BMDMs activated with hTNF/5z7. (D) Relative TNF and IFNb mRNA levels, normalized to β-Actin in response to mTNF for 4 hours in indicated BMDMs. (E) Levels of total and phospho-p38, -ERK and IκBα over time in indicated BMDMs stimulated with mTNF for indicated timepoints. (F) RIPK1 and TRAM immunoprecipitations in B6 and Trif−/− BMDMs stimulated with mTNF for indicated timepoints. (G) FADD and TRAM immunoprecipitation in B6, Trif−/−, and Cd14−/− BMDMs stimulated with mTNF/5z7 for indicated timepoints. (H) B6 and Trif−/− BMDMs stimulated with mTNF/5z7 for indicated timepoints and probed for RIPK1, indicated caspases and GSDMD. (I) Cell death overtime as measured by propidium iodide incorporation in B6 and Trif−/− BMDMs stimulated as indicated. Data from cell death assays and immunoblots are representative of three or more independent experiments, cell death data are presented as the mean ± SD of triplicate wells (~10,000 cells/field of view). qPCR data are presented as the mean ± SD for triplicate wells from three or more independent experiments. Analysis of variance (ANOVA) was used for comparison between groups: ns, nonsignificant (p>0.05); *p<0.05; **p<0.01; ***p<0.001; ****p<0.0001.
Fig. 2.
Fig. 2.. CD14-mediated internalization of TNF-R1 promotes TRIF-RIPK1 colocalization in macrophages
(A) Representative 60X images of TRIF or RIPK1 staining and colocalization in B6, Cd14−/− and Tnfr1−/−macrophages stimulated with mTNF or mTNF/5z7 for 20 minutes. (B, C) Quantification of the number of TRIF+ puncta/cell over time in response to (B) mTNF or (C) mTNF/5z7 in B6, Cd14−/− and Tnfr1−/−macrophages. (D, E) Quantification of the percentage of TRIF+ puncta colocalized with RIPK1+ puncta/cell over time in response to (D) mTNF or (E) mTNF/5z7 in B6, Cd14−/− and Tnfr1−/−macrophages. Data from imaging experiments are representative of three or more independent experiments, data points indicate individual cells, n=25. Analysis of variance (ANOVA) was used for comparison between groups: ns, nonsignificant (p>0.05); *p<0.05; **p<0.01; ***p<0.001; ****p<0.0001.
Fig. 3.
Fig. 3.. TRIF and CD14 mediate TNF-induced lethality
(A, B) Mouse body temperature (A) and survival (B) over time in B6, Tnfr1−/−, Tnf−/−, Trif−/−, Cd14−/−, Trif−/−Cd14−/− Tlr3−/−, Tlr4−/− and Tlr3−/−Tlr4−/− mice after intravenous injection with 9ug mTNF. (C-G) Serum levels of (C) TNF, (D) IFNβ, (E) IL-1β, (F) relative lactate dehydrogenase (LDH) and (G) Alanine Aminotransferase (ALT) in indicated mice 4 hours after i.v. injection with 9ug mTNF. Data points indicate individual mice tested (B6 PBS, n=13; Tnfr1−/− PBS, n=3; Tnf−/− PBS, n=3; Trif−/− PBS, n=10; Cd14−/− PBS, n=7; Trif−/−Cd14−/− PBS, n=3; Tlr4−/− PBS, n=6; Tlr3−/− PBS; n=9; Tlr3−/−Tlr4−/− PBS, n=3 B6 mTNF, n=22; Tnfr1−/− TNF, n=5; Tnf−/− TNF, n=5, Trif−/− mTNF, n=14; Cd14−/− mTNF, n=10; Trif−/−Cd14−/− TNF, n=5; Tlr4−/− mTNF, n=9; Tlr3−/− mTNF, n=9; Tlr3−/−Tlr4−/− TNF, n=5 ). (H, I) H&E staining of (H) ileum and (I) liver sections from B6 and Trif−/− mice 4 hours after injection with 9ug mTNF or PBS. Dotted boxes indicate areas of leukocyte recruitment. (J) Representative image of spleens from B6 and Trif−/− mice injected with 9ug TNF or PBS 6 hours after injection. (K) TUNEL staining and (L) quantification of TUNEL+cells/mm2 in the spleen of B6 and Trif−/− mice 4 hours after injection with 9ug mTNF. Each point represents 1 field of view across 3 biological replicates. Analysis of variance (ANOVA) was used for comparison between groups: ns, nonsignificant (p>0.05); *p<0.05; **p<0.01; ***p<0.001; ****p<0.0001.
Fig. 4.
Fig. 4.. A cell-specific requirement for TRIF in the regulation of immune responses to TNF
(A) UMAP of splenocytes from B6 and Trif−/− mice 4 hours after intravenous injection with 9ug mTNF or PBS. Colors represent cell type annotations. (B) Fraction of cells corresponding to each cell type annotation in B6 and Trif−/− mice 4 hours after intravenous injection with 9ug mTNF or PBS. (C) Fold change (TNF/PBS) in proportion of cells corresponding to each cell type annotation in B6 and Trif−/− mice 4 hours after intravenous injection. (D) Fold change in the number of immune cells in the spleen 4 hours after injection with TNF compared to PBS in B6 and Trif−/− mice. Data points indicate individual mice tested (B6 TNF, n=6; Trif−/− TNF, n=6). Bars represent the mean ± SD. Analysis of variance (ANOVA) was used for comparison between groups: ns, nonsignificant (P>0.05); *P<0.05; **P<0.01; ***P<0.001; ****P<0.0001. (E) UMAP showing CD14 expression in splenocytes from B6 and Trif−/− mice. (F) Top Gene Ontology (GO) Biological Process categories enriched for genes that were significantly upregulated in B6 mice in response to TNF, but significantly less upregulated in Trif−/− mice in indicated cell types. GeneRatio: The ratio of the number of genes in the query set that are annotated by the GO ID and the number of genes in the query set that are annotated in the database of all GO IDs. p.adjust calculated using the Benjamini-Hochberg method.
Fig. 5.
Fig. 5.. Hematopoietic cells are the effectors of TRIF-dependent responses to TNF
(A) Mouse body temperature over time in B6, Trif−/−, and lethally irradiated B6 mice reconstituted with B6 (B6 BM) or Trif−/− (Trif−/− BM) bone marrow followed by intravenous injection with 9ug mTNF. (B-D) Serum (B) TNF, IFNβ and IL-1β protein levels (C) relative lactate dehydrogenase (LDH) levels and (D) Alanine Aminotransferase levels (ALT) in indicated mice 4 hours after injection with 9ug mTNF. Data points indicate individual mice tested, n=6 (E) H&E staining of ileum sections from B6 BM and Trif−/− BM mice 4 hours after injection with 9ug mTNF. *indicate areas of villus blunting and edema. (F) TUNEL staining and (G) quantification of TUNEL+cells/mm2 in the spleen of B6 BM and Trif−/− BM mice 4 hours after injection with 9ug mTNF. Each point represents 1 field of view across 3 biological replicates. Analysis of variance (ANOVA) was used for comparison between groups: ns, nonsignificant (p>0.05); *p<0.05; **p<0.01; ***p<0.001; ****p<0.0001.
Fig. 6.
Fig. 6.. In the context of TNF-lethality, neutrophils control TRIF-dependent inflammatory responses while macrophages mediate cell death
(A, B) Mouse body temperature (A) and survival (B) over time in neutrophil depleted (Ly6G antibody, 1A8, 24 hours) and isotype control treated B6 mice after injection with 9ug mTNF. (C) Mouse body temperature over time and serum (D) TNF, IFNβ and IL-1β protein levels (E) relative lactate dehydrogenase (LDH) levels and (F) Alanine Aminotransferase levels (ALT) 4 hours after injection with 9ug mTNF in Trif−/− mice reconstituted with 1×10⁶ macrophages or neutrophils from B6 or Trif−/− donors. Data points indicate individual mice tested, n=5. Analysis of variance (ANOVA) was used for comparison between groups: ns, nonsignificant (p>0.05); *p<0.05; **p<0.01; ***p<0.001; ****p<0.0001.

References

    1. Wajant H, Siegmund D, TNFR1 and TNFR2 in the Control of the Life and Death Balance of Macrophages. Front. Cell Dev. Biol. 7, 1–14 (2019). - PMC - PubMed
    1. Mcdermott MF, Aksentijevich I, Mcdermott EM, Ogunkolade BW, Centola M, Mansfield E, Gadina M, Karenko L, Pettersson T, Mccarthy J, Frucht DM, Aringer M, Torosyan Y, Teppo A, Wilson M, Karaarslan HM, Wan Y, Todd I, Wood G, Schlimgen R, Kumarajeewa TR, Cooper SM, Vella JP, Amos CI, Mulley J, Quane KA, Molloy MG, Ranki A, Powell RJ, Hitman GA, Shea JJO, Kastner DL, Germline Mutations in the Extracellular Domains of the 55 kDa TNF Receptor, TNFR1, Define a Family of Dominantly Inherited Autoinflammatory Syndromes. Cell 97, 133–144 (1999). - PubMed
    1. Seymour HE, Worsley A, Smith JM, Thomas SHL, Anti-TNF agents for rheumatoid arthritis. Br J Clin Pharmacol 51, 201–208 (2001). - PMC - PubMed
    1. Garcia-carbonell R, Wong J, Kim JY, Close LA, Boland BS, Wong TL, Harris PA, Ho SB, Das S, Ernst PB, Sasik R, Sandborn WJ, Bertin J, Gough PJ, Chang JT, Kelliher MA, Boone D, Guma M, Karin M, Elevated A20 promotes TNF-induced and RIPK1- dependent intestinal epithelial cell death. PNAS 115, 9192–9200 (2018). - PMC - PubMed
    1. Del Valle DM, Kim-schulze S, Huang H, Beckmann ND, Nirenberg S, Wang B, Lavin Y, Swartz TH, Madduri D, Stock A, Marron TU, Xie H, Patel M, Tuballes K, Van Oekelen O, Rahman A, Kovatch P, Aberg JA, Schadt E, Jagannath S, Mazumdar M, Charney AW, Firpo-Betancourt A, Mendu DR, Jhang J, Reich D, Sigel K, Cordon-Cardo C, Feldmann M, Parekh S, Merad M, Gnjatic S, An inflammatory cytokine signature predicts COVID-19 severity and survival. Nat. Med. 26, 1636–1643 (2020). - PMC - PubMed

Publication types

Substances