. 2022 Dec 22;185(26):4921-4936.e15.
doi: 10.1016/j.cell.2022.11.023.

Mobile genetic elements from the maternal microbiome shape infant gut microbial assembly and metabolism

Affiliations

Mobile genetic elements from the maternal microbiome shape infant gut microbial assembly and metabolism

Tommi Vatanen et al. Cell. .

Abstract

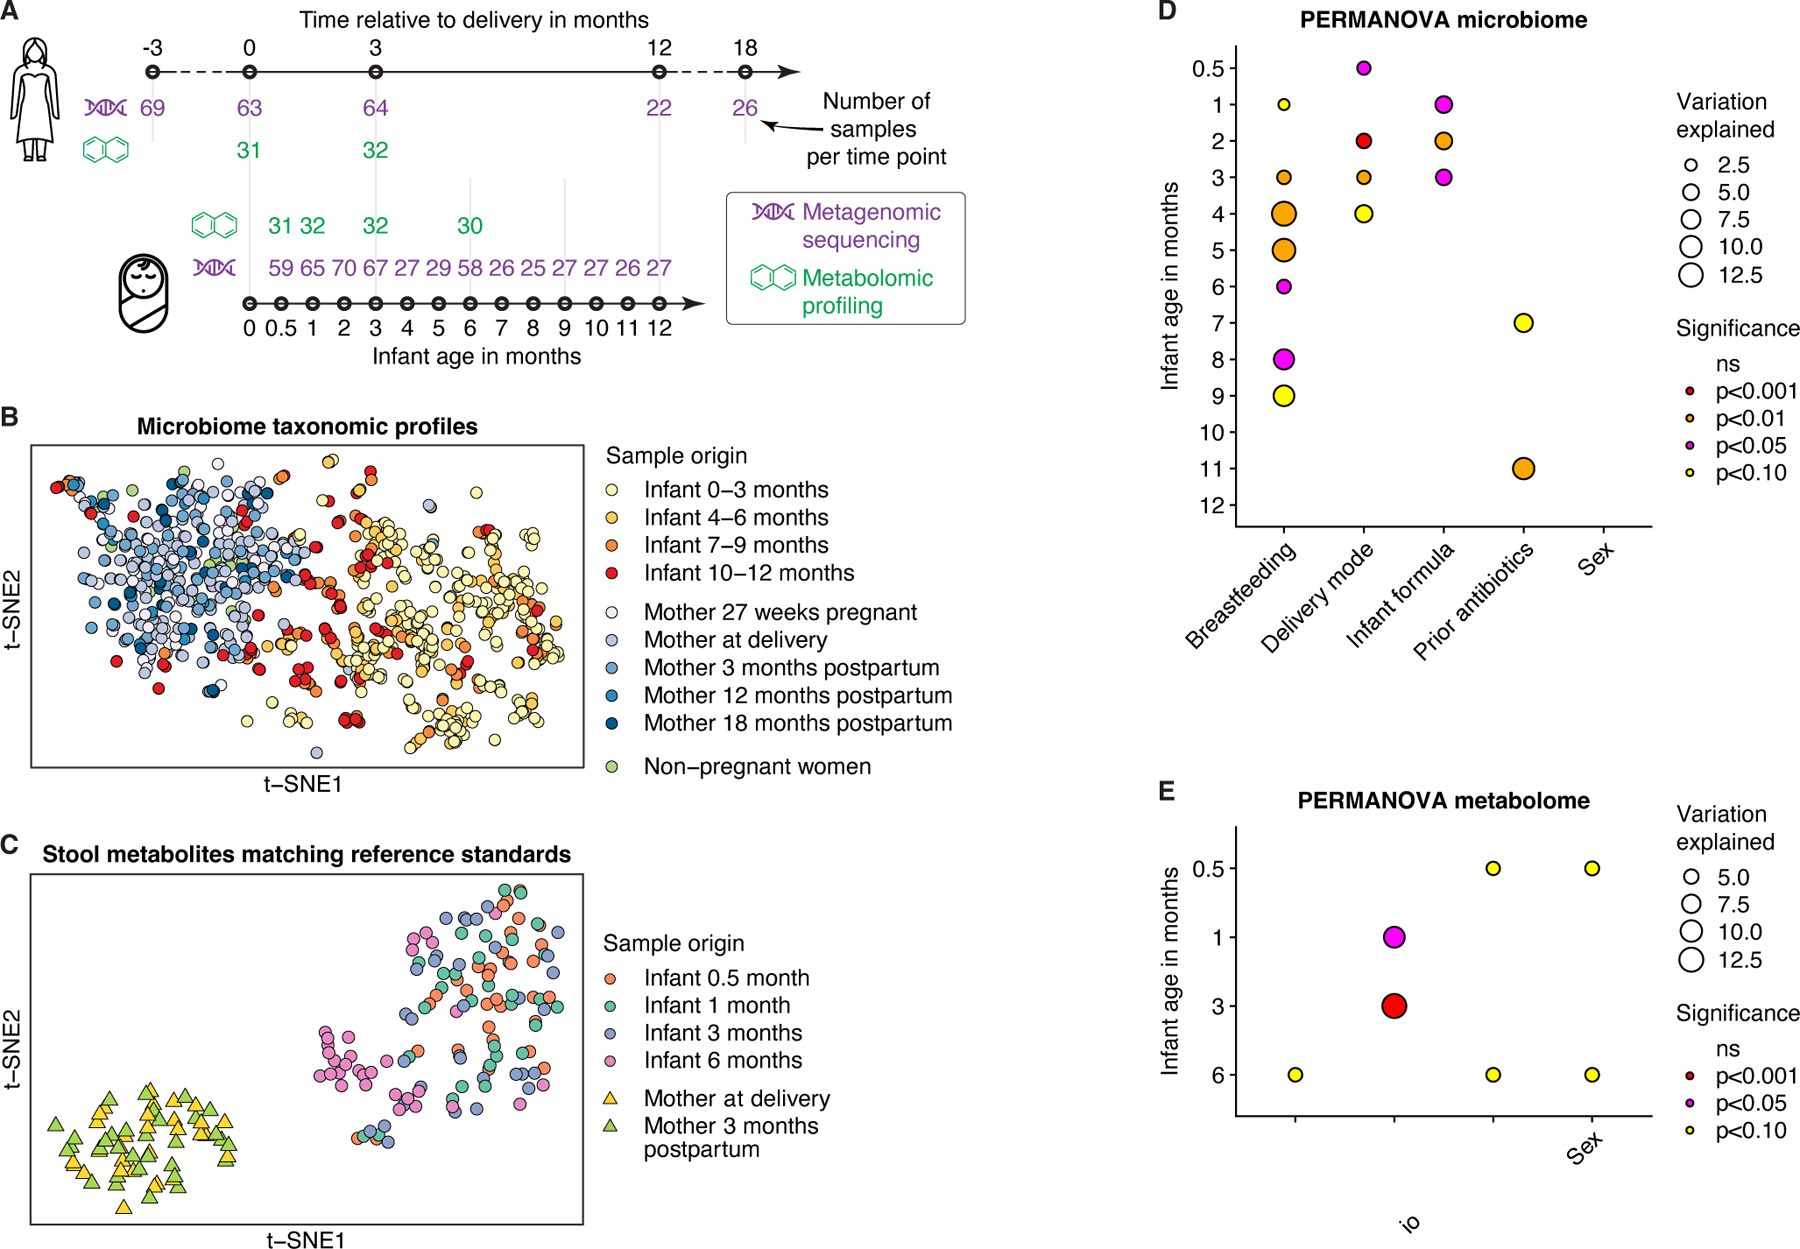
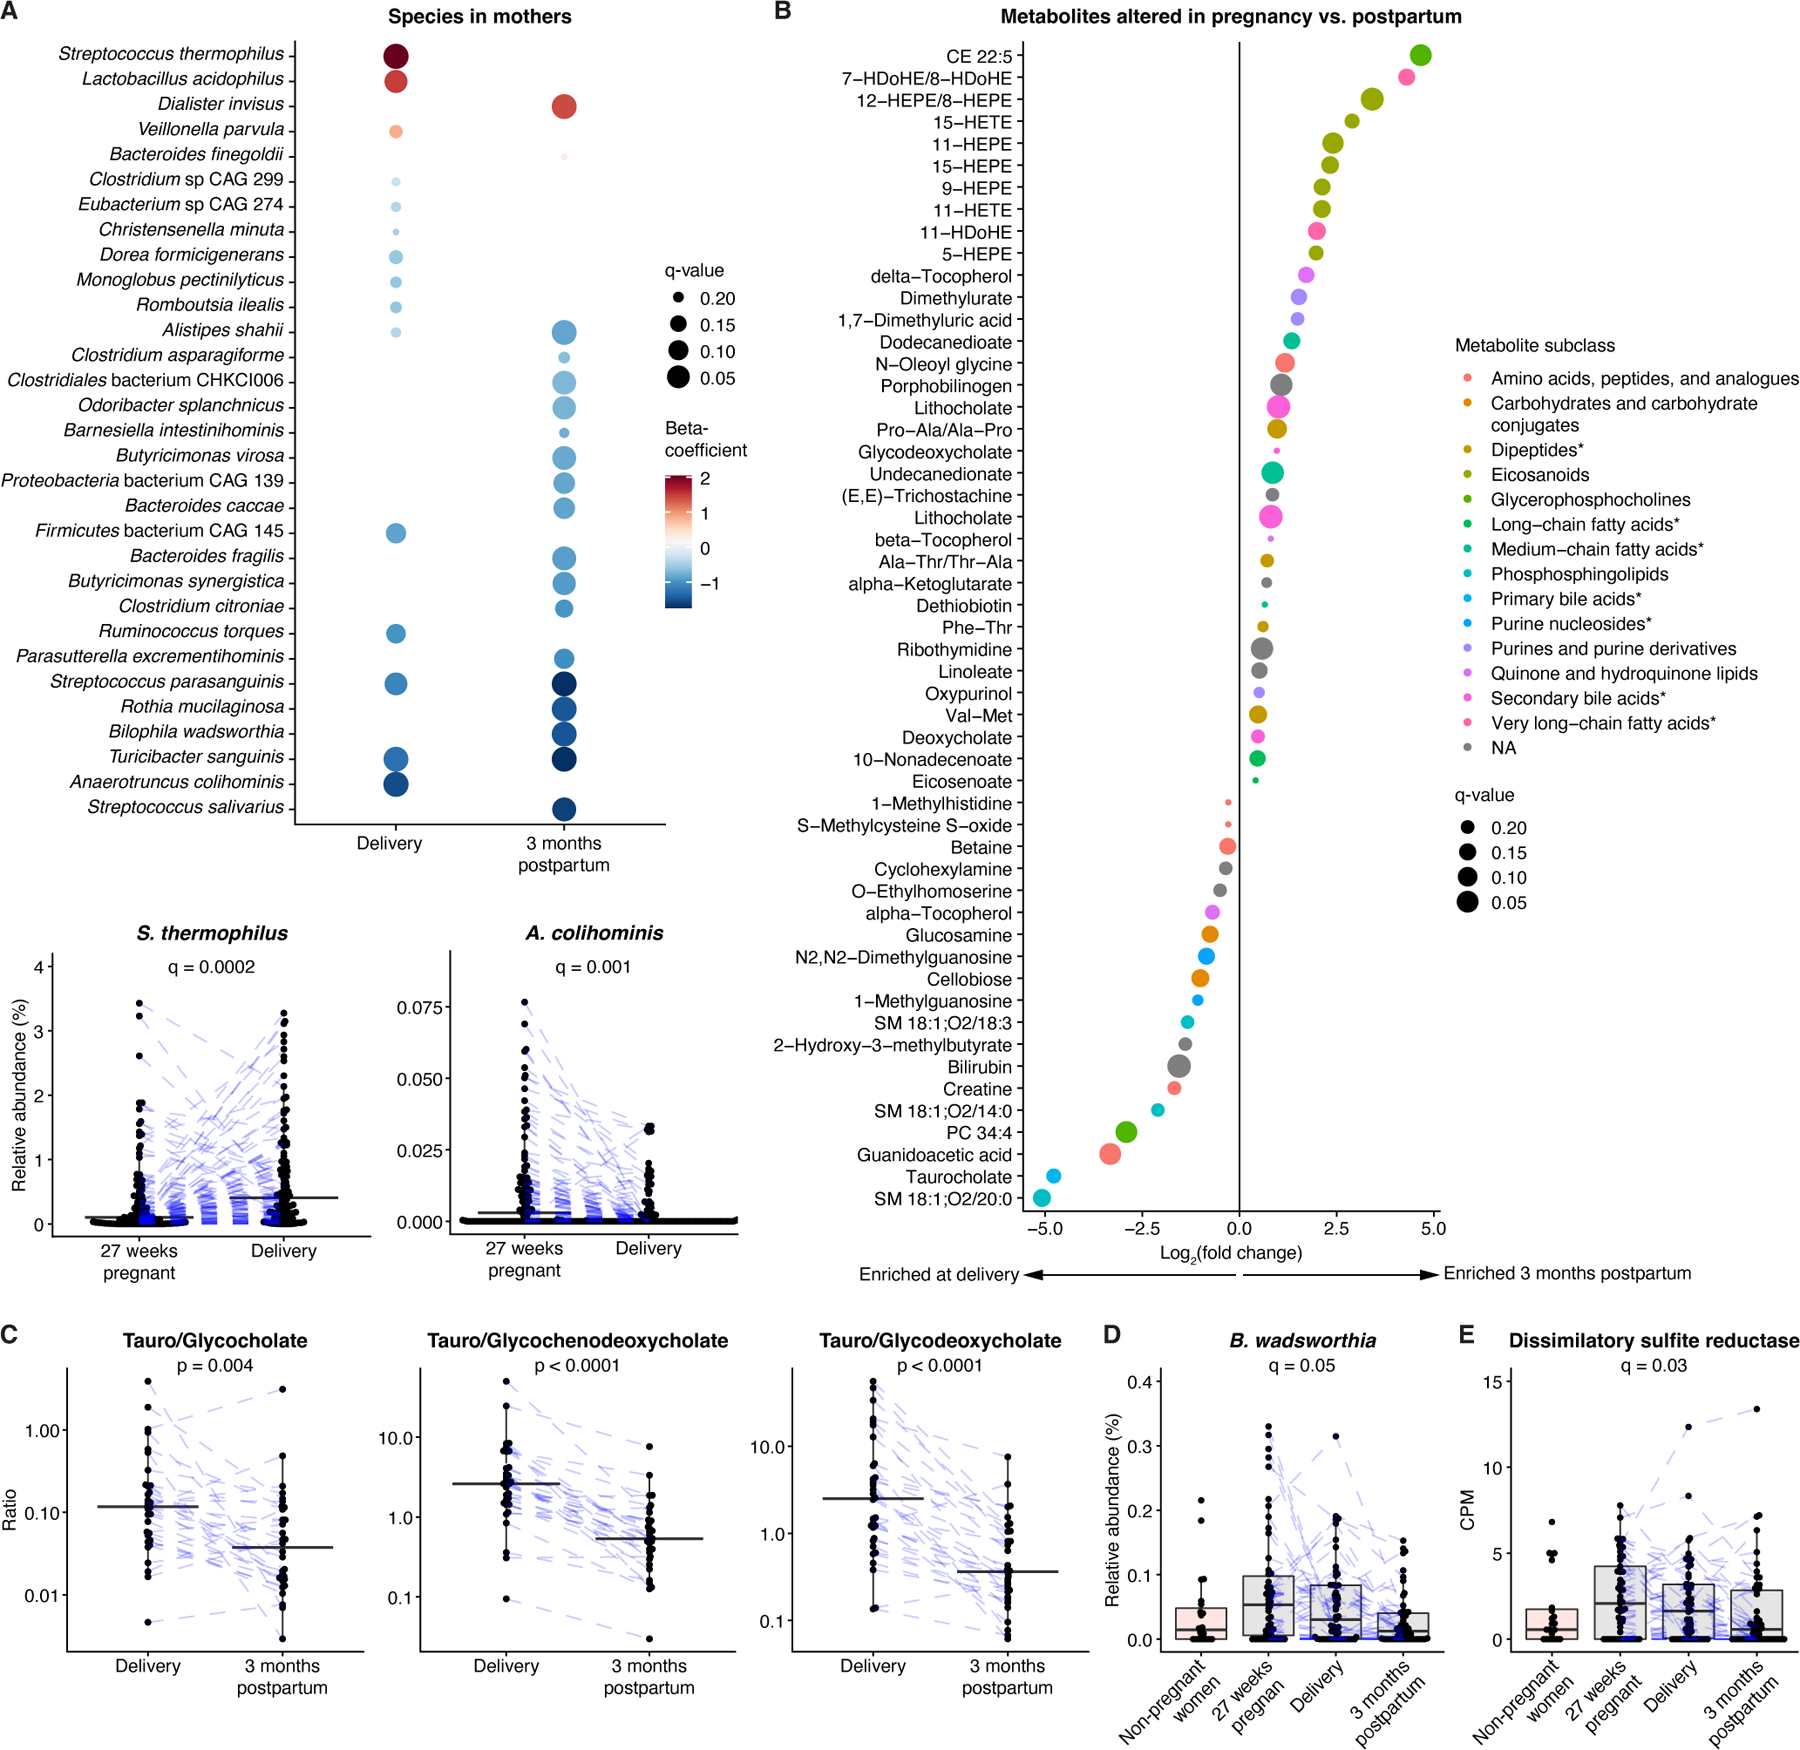
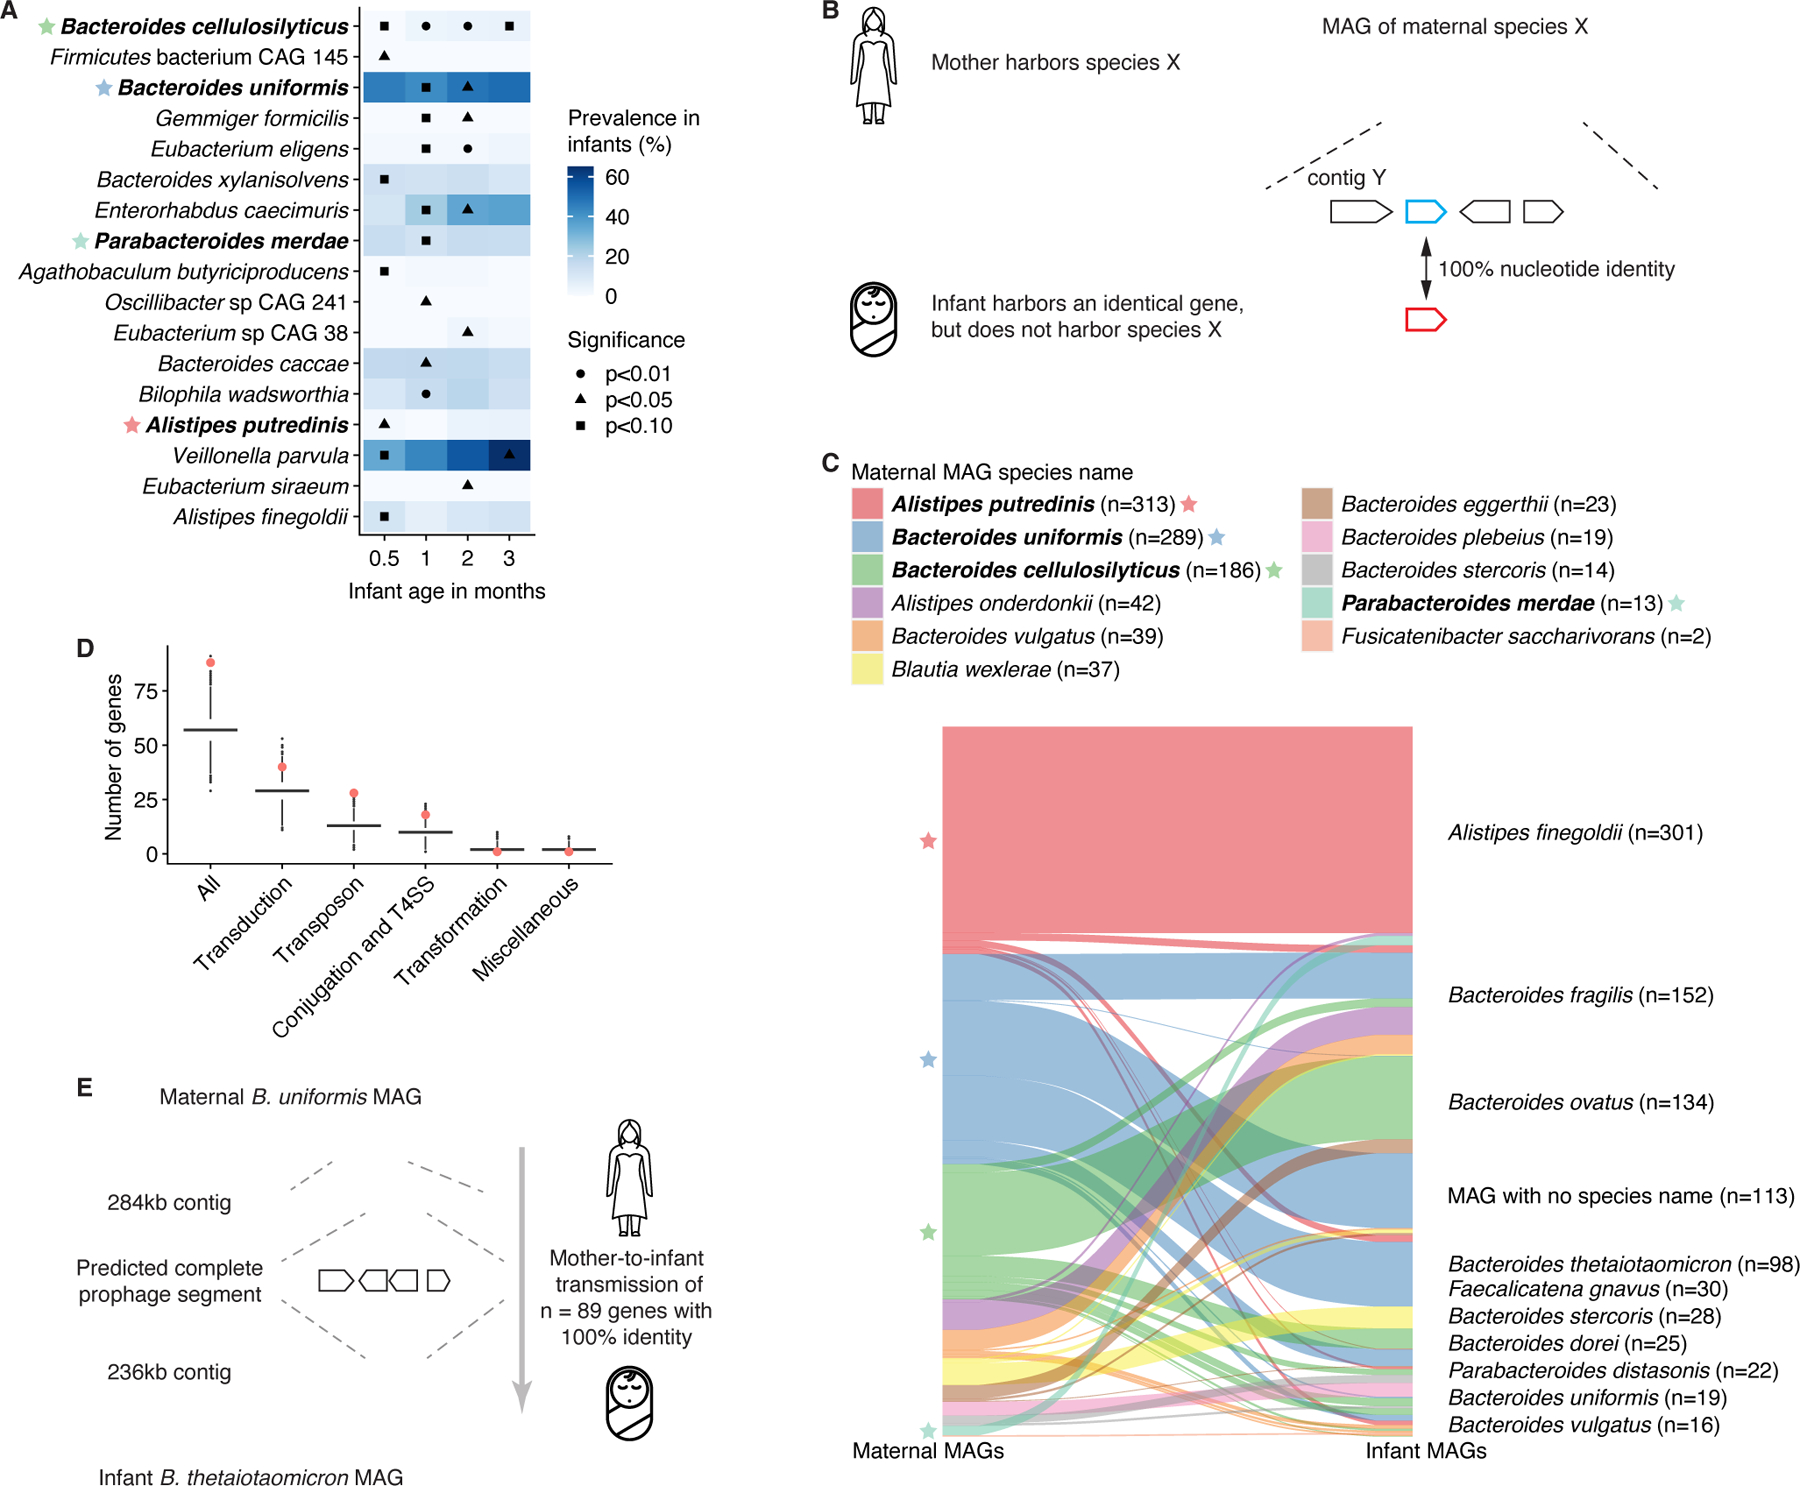
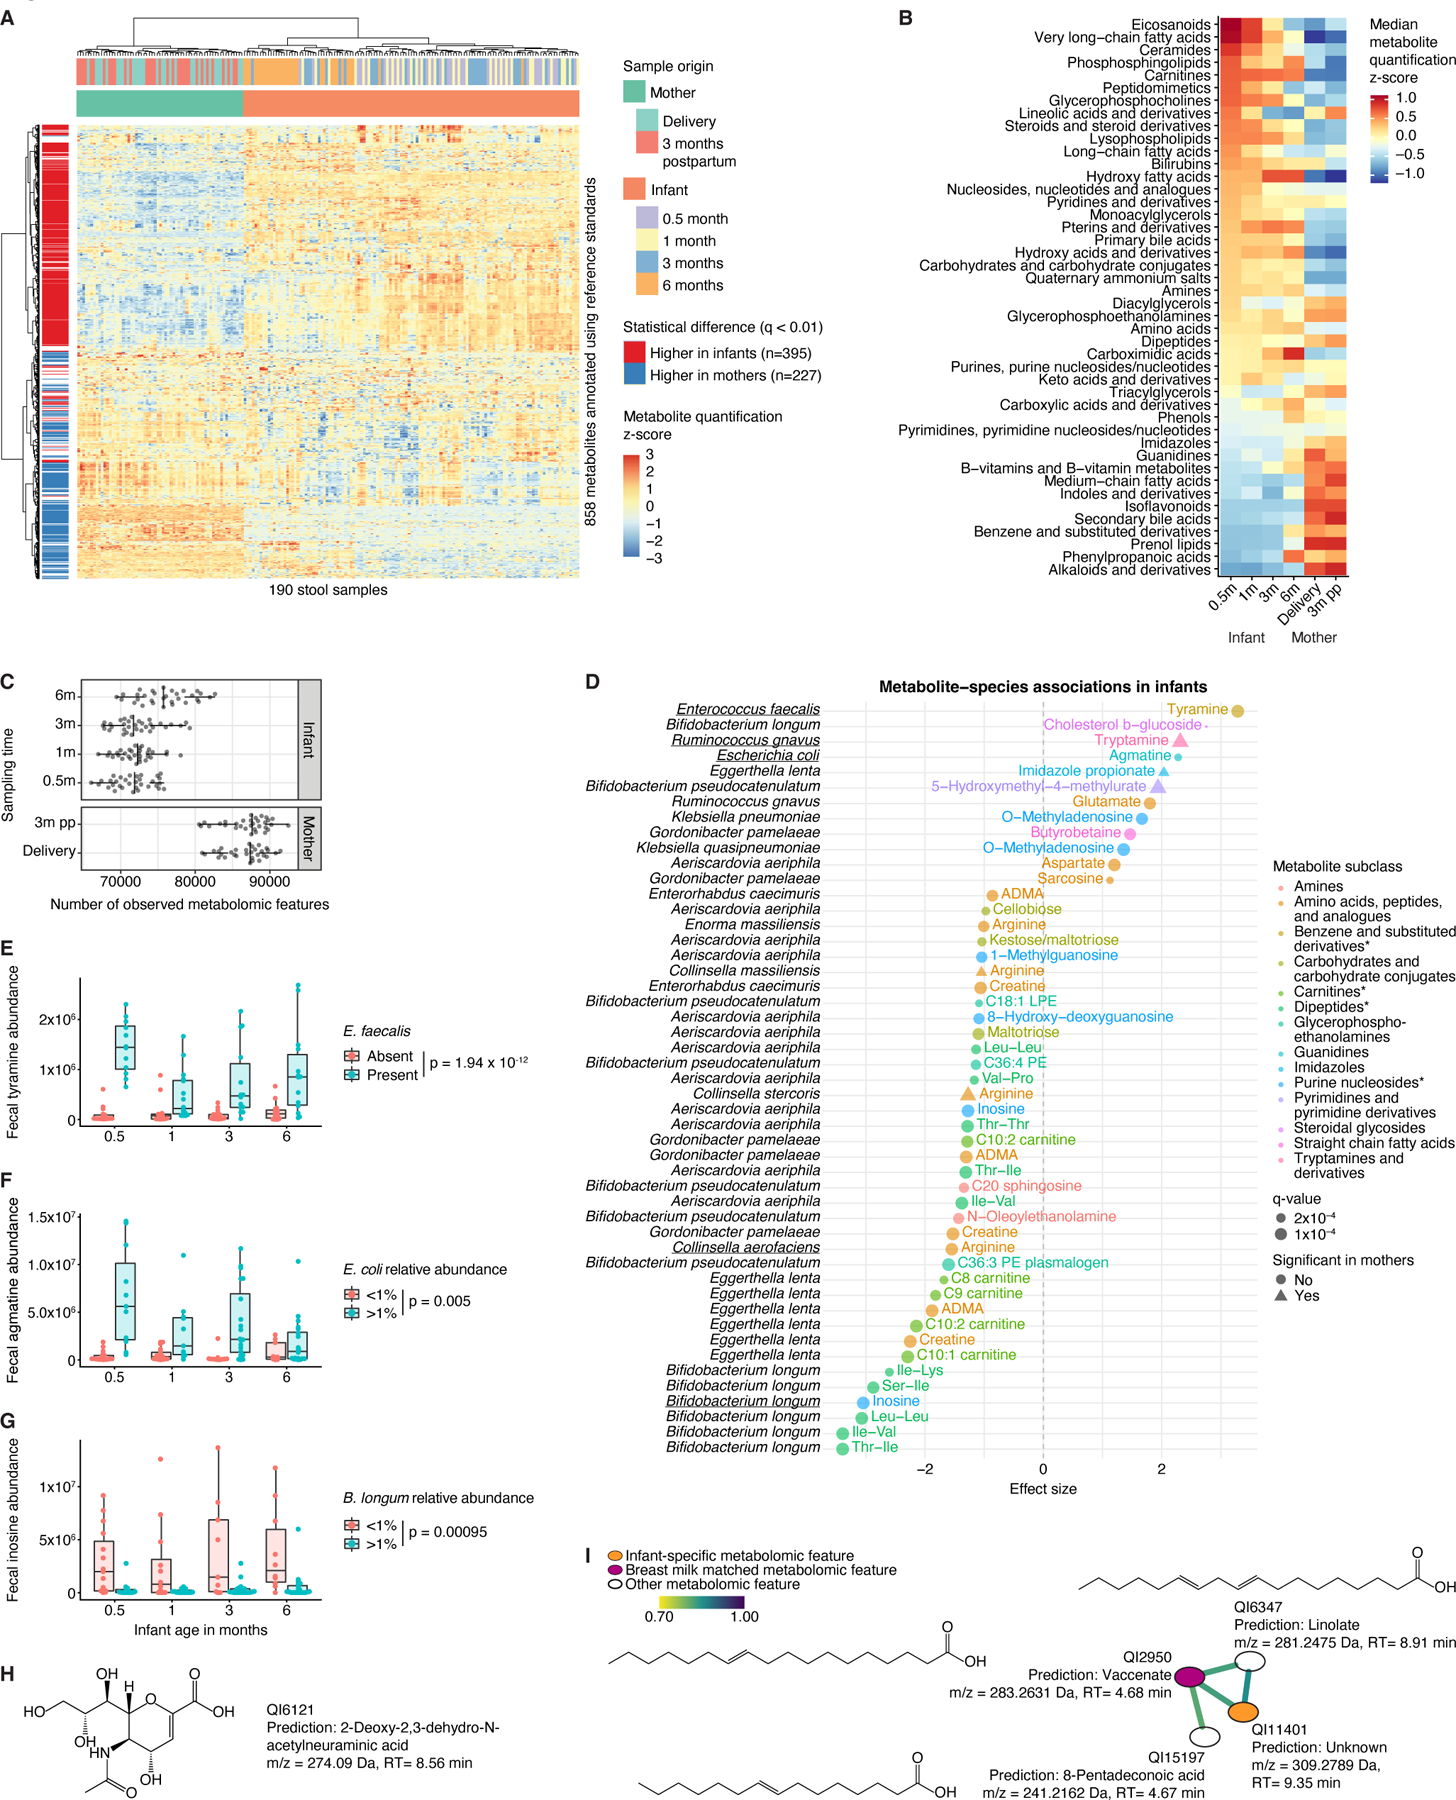
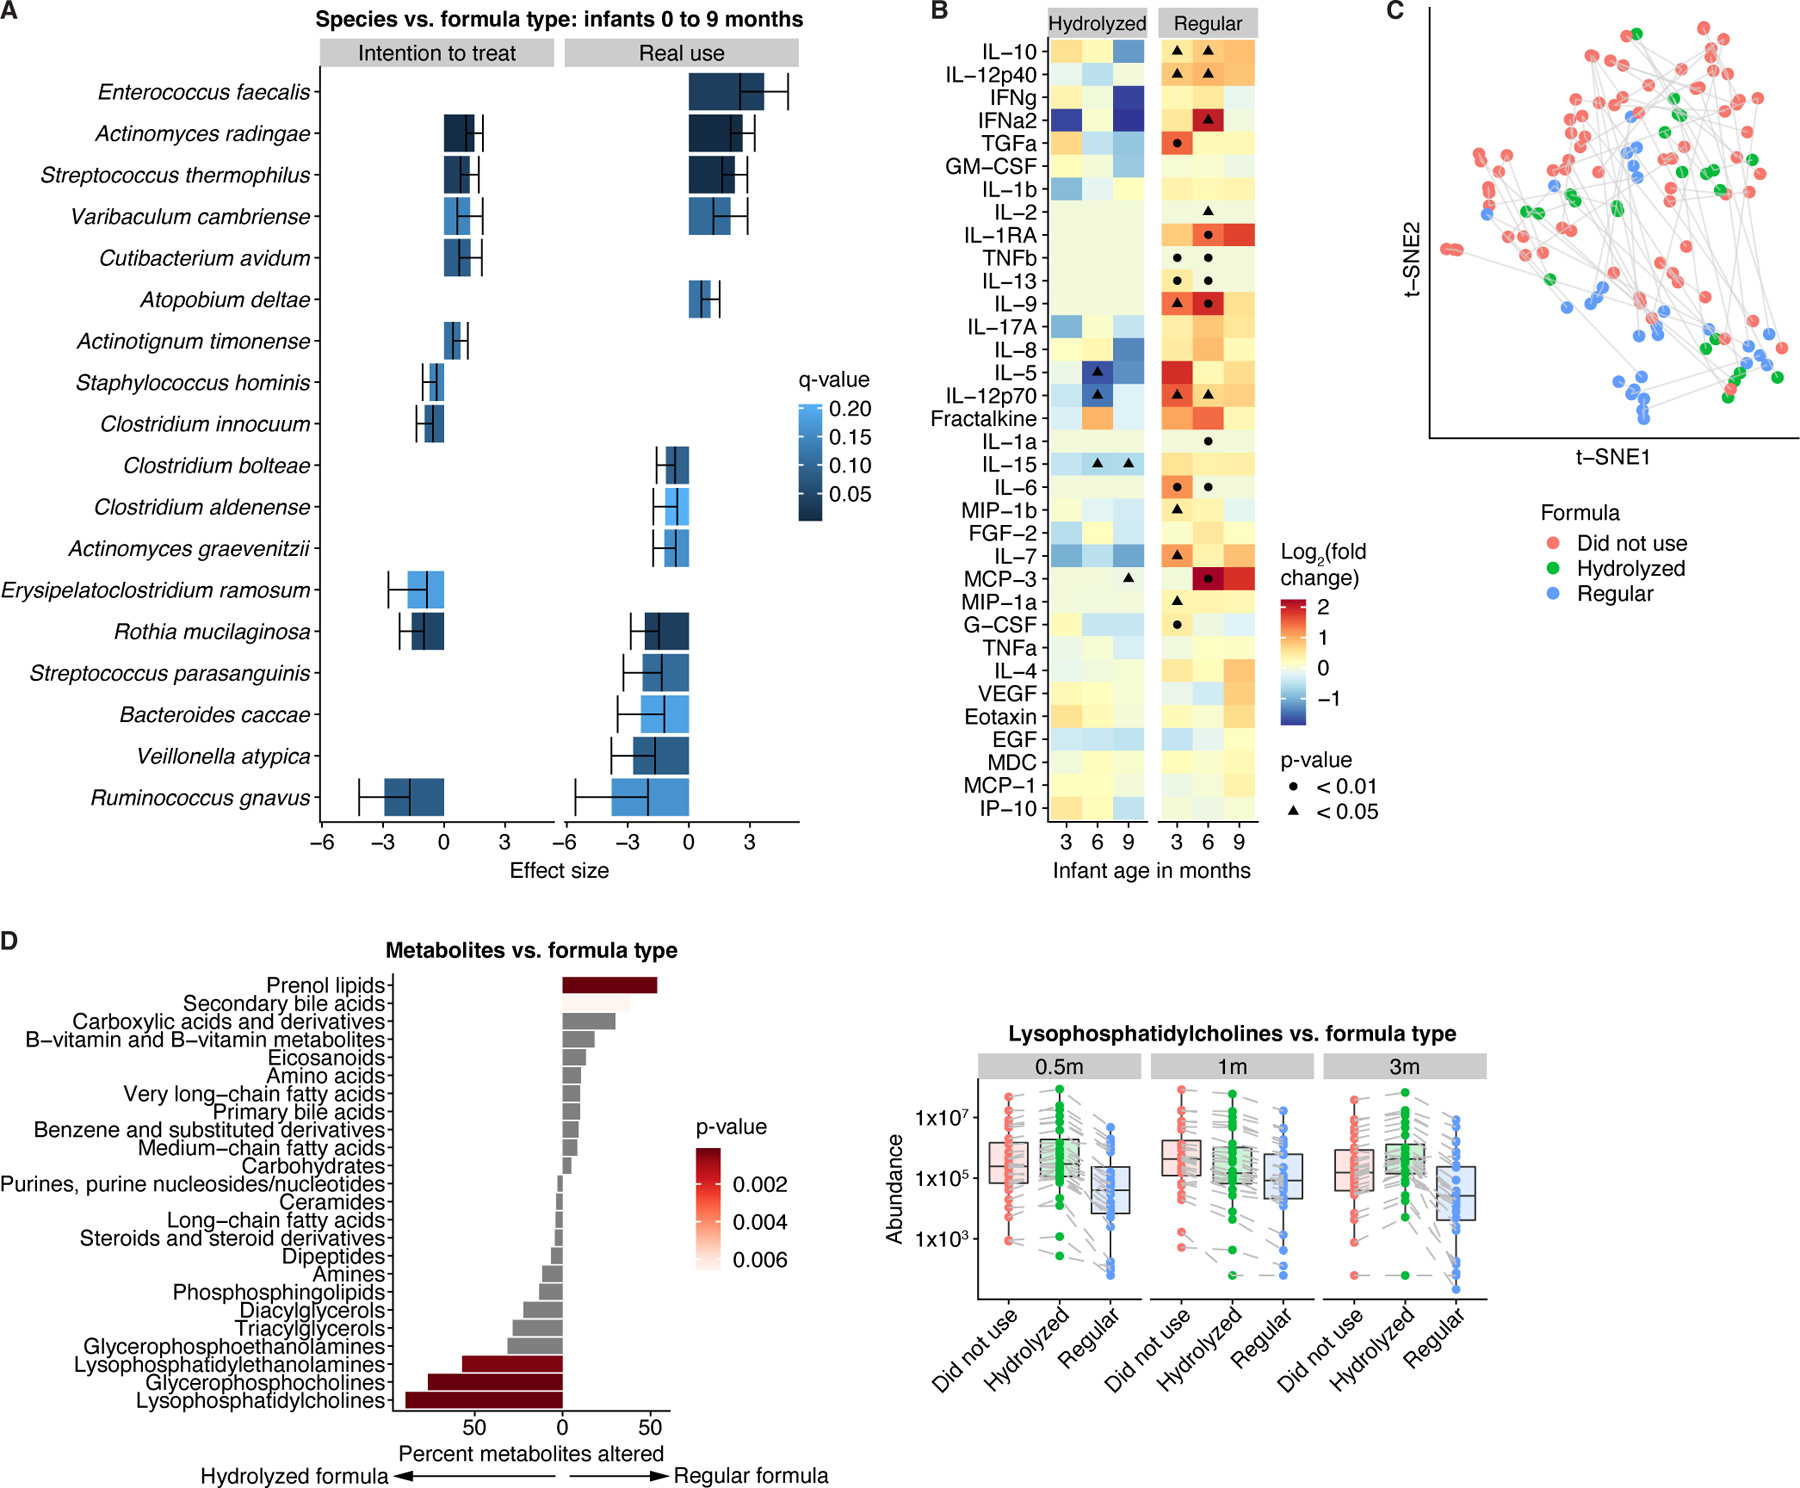
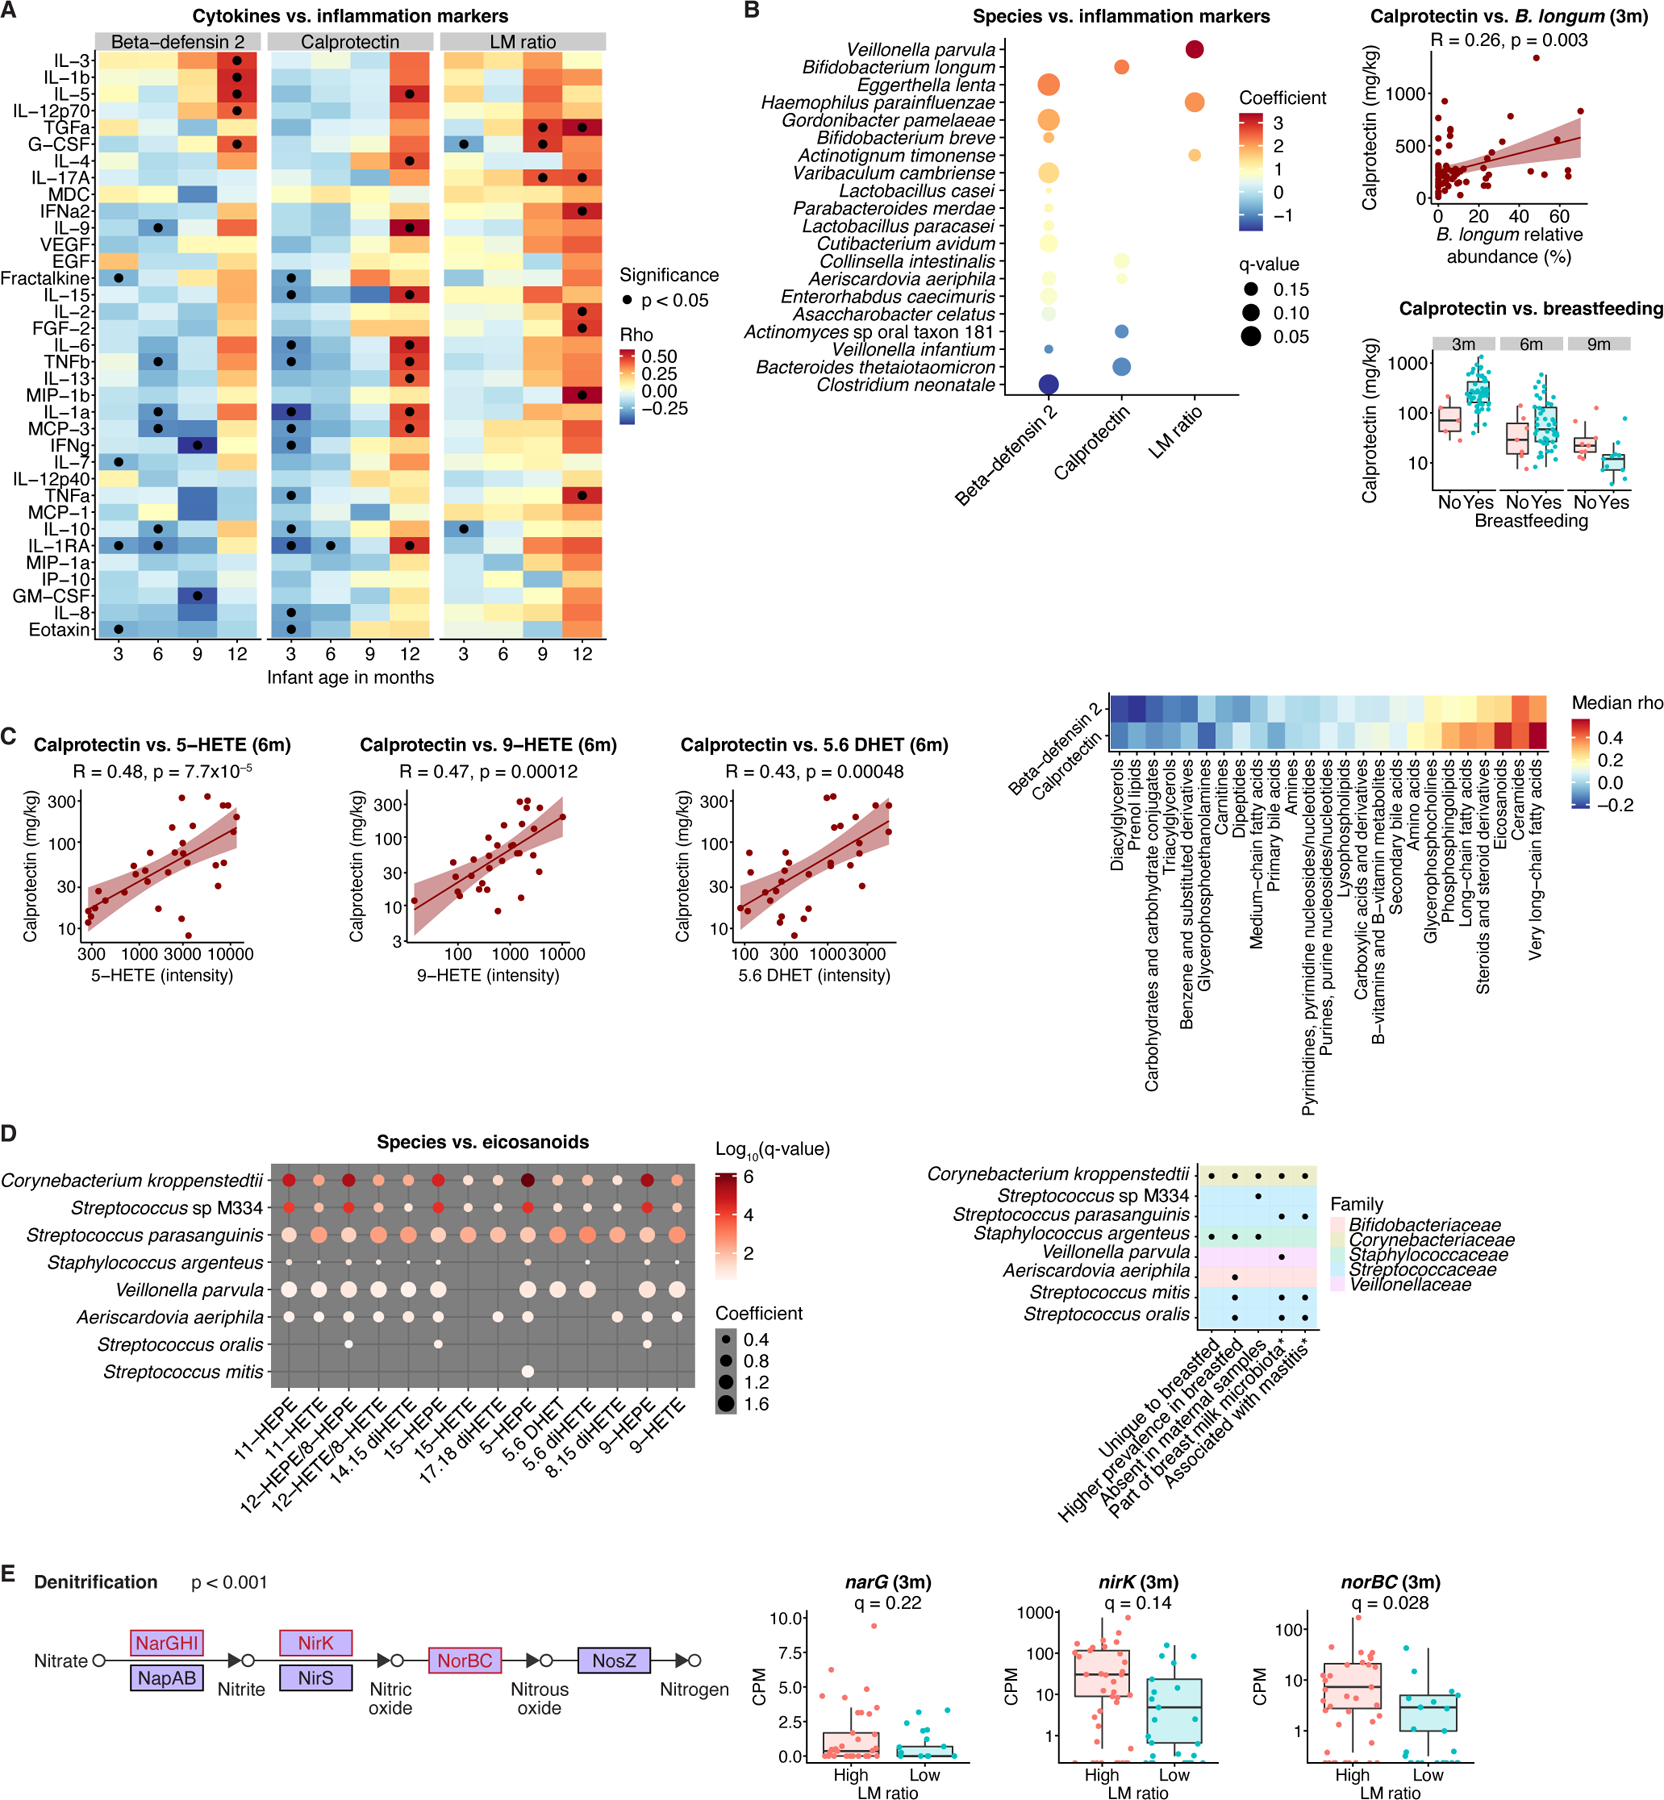
The perinatal period represents a critical window for cognitive and immune system development, promoted by maternal and infant gut microbiomes and their metabolites. Here, we tracked the co-development of microbiomes and metabolomes from late pregnancy to 1 year of age using longitudinal multi-omics data from a cohort of 70 mother-infant dyads. We discovered large-scale mother-to-infant interspecies transfer of mobile genetic elements, frequently involving genes associated with diet-related adaptations. Infant gut metabolomes were less diverse than maternal but featured hundreds of unique metabolites and microbe-metabolite associations not detected in mothers. Metabolomes and serum cytokine signatures of infants who received regular-but not extensively hydrolyzed-formula were distinct from those of exclusively breastfed infants. Taken together, our integrative analysis expands the concept of vertical transmission of the gut microbiome and provides original insights into the development of maternal and infant microbiomes and metabolomes during late pregnancy and early life.

Keywords: gut metabolome; horizontal gene transfer; infant gut microbiome; mother-to-infant microbiome transmission.


Conflict of interest statement

Declaration of interests R.J.X. is co-founder of Jnana Therapeutics and Celsius Therapeutics, board director at MoonLake Immunotherapeutics, and consultant to Nestlé; these organizations had no role in the study.

Figures

Figure 1.
Figure 1.. Multi-omic data from the EDIA cohort.
A) Schematic illustration of metagenomic and metabolomic data. Number of samples (n) after quality control at each time point is indicated. B) t-distributed stochastic neighbor embedding (t-SNE) ordination of gut microbiome profiles based on Bray-Curtis dissimilarities of species-level abundances from metagenomic data. C) t-SNE ordination of gut metabolite profiles based on log-scaled and z-score-normalized abundances of n=858 metabolites annotated using reference standards. D-E) Effects of factors on (D) species-level taxonomic composition (Bray-Curtis dissimilarities) and (E) metabolomic profiles (restricted to features annotated using standards) in infants according to cross-sectional PERMANOVA analyses. Factors were assessed in combination, while ordered by individual log10-transformed p-values from initial PERMANOVA analysis of each factor. ‘Infant formula’ comprises three categories: regular, hydrolyzed, and no formula. See also Figure S1; Tables S1-2.
Figure 2.
Figure 2.. Metagenomic and metabolomic signatures during pregnancy included expansion of taurine-conjugated bile acids, Bilophila wadsworthia, and H2S production capacity.
A) Upper panel: Differences in species at delivery and 3 months postpartum compared to gestational week 27. Lower panels: For each boxplot, two high outliers are not shown (both from the delivery time point for S. thermophilus; one from gestational week 27 and one from the delivery time point for A. colihominis). B) Metabolomic differences in paired maternal samples from delivery and 3 months postpartum. Asterisks indicate that subclass identification was replaced by more specific identification. C) Relative expansion of taurine-versus glycine-conjugated bile acids at delivery compared to 3 months postpartum. p-values obtained by the Wilcoxon signed-rank test. D) B. wadsworthia expansion during pregnancy. One high outlier (delivery) is not shown. E) Dissimilatory sulfite reductase expansion during pregnancy. One high outlier (gestational week 27) is not shown. In (D, E) results from a non-pregnant female control group were included as a reference. q-values refer to comparisons of pregnancy and postpartum time points based on paired samples, after correction for longitudinal analysis. For boxplots, midlines represent the median, boxes the interquartile range (25th to 75th percentile), and whiskers the range of data. Blue lines connect data points from the same participant. CPM, copies per million. See also Figure S2; Table S1.
Figure 3.
Figure 3.. Mother-to-infant interspecies gene transmission.
A) Association of prevalent (>50%) maternal species with species-level taxonomic composition (Bray-Curtis dissimilarity) of the gut microbiota in infants aged up to 3 months, based on cross-sectional PERMANOVA analyses. Analyses were corrected for infant sex, delivery mode, breastfeeding, formula use/type, and prior antibiotics; these factors were ordered by relative significance (log10-transformed p-values from individual PERMANOVA analyses) for each time point. Maternal species either significantly (p<0.05) associated with infant species-level taxonomy for ≥1 time points, or explaining >3% of variation, with p-value <0.10 are shown. Color represents species prevalence in infants. Stars indicate species common with (C). B) Schematic illustration of the mother-to-infant interspecies gene transmission hypothesis. C) Graph showing gene flow from maternal (left) to infant (right) species of the 977 gene transmission events identified. Stars indicate species common with (A). D) Numbers of HGT-related genes in 10,000 randomly drawn samples of 977 genes from the assembled gene catalog. Numbers of HGT-related genes among the 977 shared genes identified are highlighted in red. Midlines represent the median, boxes the interquartile range (25th to 75th percentile), and whiskers the range of data. E) Schematic of a transmitted prophage gene segment of n=299 (n=89 identical) genes between maternal B. uniformis and infant B. thetaiotaomicron. See also Figure S3; Tables S3-4.
Figure 4.
Figure 4.. Unique metabolomic profiles of the infant gut.
A) Heatmap of n=858 metabolites annotated using reference standards in the infant and maternal gut. B) Median abundance of metabolite classes/subclasses (represented by at least three unique metabolomic features) stratified by sampling time point. C) Metabolomic diversity, measured as the number of observed metabolomic features, in mothers and their infants. D) Significant associations between infant species with >25% prevalence and metabolomic features (annotated by reference standards) after adjustment for longitudinal analysis and correction for infant age, sex, delivery mode, antibiotic usage, and formula use/type. Species-metabolite associations independently confirmed in prior in vitro experiments are underscored. Asterisks indicate that subclass identification was replaced by identification on another level. E) Fecal tyramine levels stratified by infant age and presence of Enterococcus faecalis. F) Fecal agmatine levels stratified by age and Escherichia coli relative abundance. G) Fecal inosine levels stratified by age and Bifidobacterium longum relative abundance. H) Chemical structure of infant-specific metabolomic feature QI6121 predicted with SIRIUS. m/z, mass-to-charge ratio; RT, retention time. I) GNPS subnetwork associated with infant-specific metabolomic feature QI11401. Edges connect metabolomic features with cosine similarity >0.7. Chemical structures predicted with SIRIUS. For boxplots, midlines represent the median, boxes the interquartile range (25th to 75th percentile), and whiskers the range of data. See also Figure S4; Tables S1, S5-6.
Figure 5.
Figure 5.. Formula types were associated with distinct metagenomic and metabolic profiles.
A) Species differences (q<0.25) between infants who were randomized to (left) or received (right) regular versus hydrolyzed formula. Results obtained from general linear models, adjusted for longitudinal analysis and corrected for age, sex, delivery mode, antibiotic usage, and breastfeeding. Error bars represent standard error. Positive effect sizes indicate species enriched in infants who were randomized to or received regular formula, while negative effect sizes indicate species enriched in infants who were randomized to or received hydrolyzed formula. B) Enrichment of proinflammatory cytokines in infants given regular versus no formula. p-values obtained by the Mann-Whitney U-test. C) t-SNE ordination of fecal metabolomics profiles in infants, colored by formula use/type. D) Left panel: Percentage of metabolites per subclass/category that were altered (q<0.25) between infants on hydrolyzed and regular formula for at least one time point. p-values obtained through Fisher’s exact test. Right panel: Median levels of lysophosphatidylcholines stratified by age and formula use/type. Lines connect identical metabolites. Midlines represent the median, boxes the interquartile range (25th to 75th percentile), and whiskers the range of data. See also Figure S5; Tables S1-2.
Figure 6.
Figure 6.. Associations of inflammation and permeability markers with infant fecal metagenomes and metabolomes.
A) Markers of intestinal permeability and inflammation were inversely correlated with proinflammatory serum cytokines during the first months of life but positively correlated at one year of age. B) Left panel: Calprotectin and beta-defensin 2 were positively associated with beneficial species in infants up to 6 months old. Effects are from general linear models, corrected for longitudinal sampling, age, sex, delivery mode, antibiotics, breastfeeding, and formula use/type. Right panels: Calprotectin levels were higher in breastfed infants and correlated with Bifidobacterium longum relative abundance. C) Calprotectin levels were positively correlated with fecal eicosanoids, particularly arachidonic acid metabolites in 6-month-old infants. R values for scatter plots in (B, C) are Kendall’s tau. D) Levels of infant fecal eicosanoid metabolites were positively associated with relative abundances of species previously linked to the breast milk microbiome, including causative agents of mastitis. *based on previous literature,,. Results (left) are from general linear models, corrected for longitudinal sampling, age, sex, delivery mode, antibiotics, and formula use/type. E) LM ratio was positively associated with microbial genes linked to denitrification via nitric oxide production. The cut-off of 0.03 for high versus low LM ratio was determined a priori. Overall p-value for denitrification enrichment was obtained by Fisher’s exact test. q-values derived from a general linear model including infants aged up to one year, corrected for longitudinal sampling, age, sex, delivery mode, antibiotics, breastfeeding, and formula use/type. For boxplots, midlines represent the median, boxes the interquartile range (25th to 75th percentile), and whiskers the range of data. See also Figure S6; Table S1.

References

    1. Charbonneau MR, Blanton LV, DiGiulio DB, Relman DA, Lebrilla CB, Mills DA, and Gordon JI (2016). A microbial perspective of human developmental biology. Nature 535, 48–55. - PMC - PubMed
    1. Rao C, Coyte KZ, Bainter W, Geha RS, Martin CR, and Rakoff-Nahoum S (2021). Multi-kingdom ecological drivers of microbiota assembly in preterm infants. Nature 591, 633–638. - PMC - PubMed
    1. Derrien M, Alvarez A-S, and de Vos WM (2019). The Gut Microbiota in the First Decade of Life. Trends Microbiol 27, 997–1010. - PubMed
    1. Stewart CJ, Ajami NJ, O’Brien JL, Hutchinson DS, Smith DP, Wong MC, Ross MC, Lloyd RE, Doddapaneni H, Metcalf GA, et al. (2018). Temporal development of the gut microbiome in early childhood from the TEDDY study. Nature 562, 583–588. - PMC - PubMed
    1. Yatsunenko T, Rey FE, Manary MJ, Trehan I, Dominguez-Bello MG, Contreras M, Magris M, Hidalgo G, Baldassano RN, Anokhin AP, et al. (2012). Human gut microbiome viewed across age and geography. Nature 486, 222–227. - PMC - PubMed

Publication types