. 2023 Jan 9;41(1):139-163.e17.
doi: 10.1016/j.ccell.2022.12.001. Epub 2022 Dec 22.

Histopathologic and proteogenomic heterogeneity reveals features of clear cell renal cell carcinoma aggressiveness

Yize Li  1 Tung-Shing M Lih  2 Saravana M Dhanasekaran  3 Rahul Mannan  4 Lijun Chen  2 Marcin Cieslik  5 Yige Wu  1 Rita Jiu-Hsien Lu  1 David J Clark  2 Iga Kołodziejczak  6 Runyu Hong  7 Siqi Chen  1 Yanyan Zhao  1 Seema Chugh  4 Wagma Caravan  1 Nataly Naser Al Deen  1 Noshad Hosseini  5 Chelsea J Newton  8 Karsten Krug  9 Yuanwei Xu  10 Kyung-Cho Cho  2 Yingwei Hu  2 Yuping Zhang  4 Chandan Kumar-Sinha  4 Weiping Ma  11 Anna Calinawan  11 Matthew A Wyczalkowski  1 Michael C Wendl  12 Yuefan Wang  2 Shenghao Guo  13 Cissy Zhang  2 Anne Le  14 Aniket Dagar  4 Alex Hopkins  4 Hanbyul Cho  5 Felipe da Veiga Leprevost  15 Xiaojun Jing  4 Guo Ci Teo  4 Wenke Liu  7 Melissa A Reimers  16 Russell Pachynski  16 Alexander J Lazar  17 Arul M Chinnaiyan  5 Brian A Van Tine  18 Bing Zhang  19 Karin D Rodland  20 Gad Getz  9 D R Mani  9 Pei Wang  11 Feng Chen  21 Galen Hostetter  8 Mathangi Thiagarajan  22 W Marston Linehan  23 David Fenyö  7 Scott D Jewell  8 Gilbert S Omenn  24 Rohit Mehra  4 Maciej Wiznerowicz  25 Ana I Robles  26 Mehdi Mesri  26 Tara Hiltke  26 Eunkyung An  26 Henry Rodriguez  26 Daniel W Chan  27 Christopher J Ricketts  28 Alexey I Nesvizhskii  5 Hui Zhang  29 Li Ding  30 Clinical Proteomic Tumor Analysis Consortium
Collaborators, Affiliations

Histopathologic and proteogenomic heterogeneity reveals features of clear cell renal cell carcinoma aggressiveness

Yize Li et al. Cancer Cell. .

Abstract

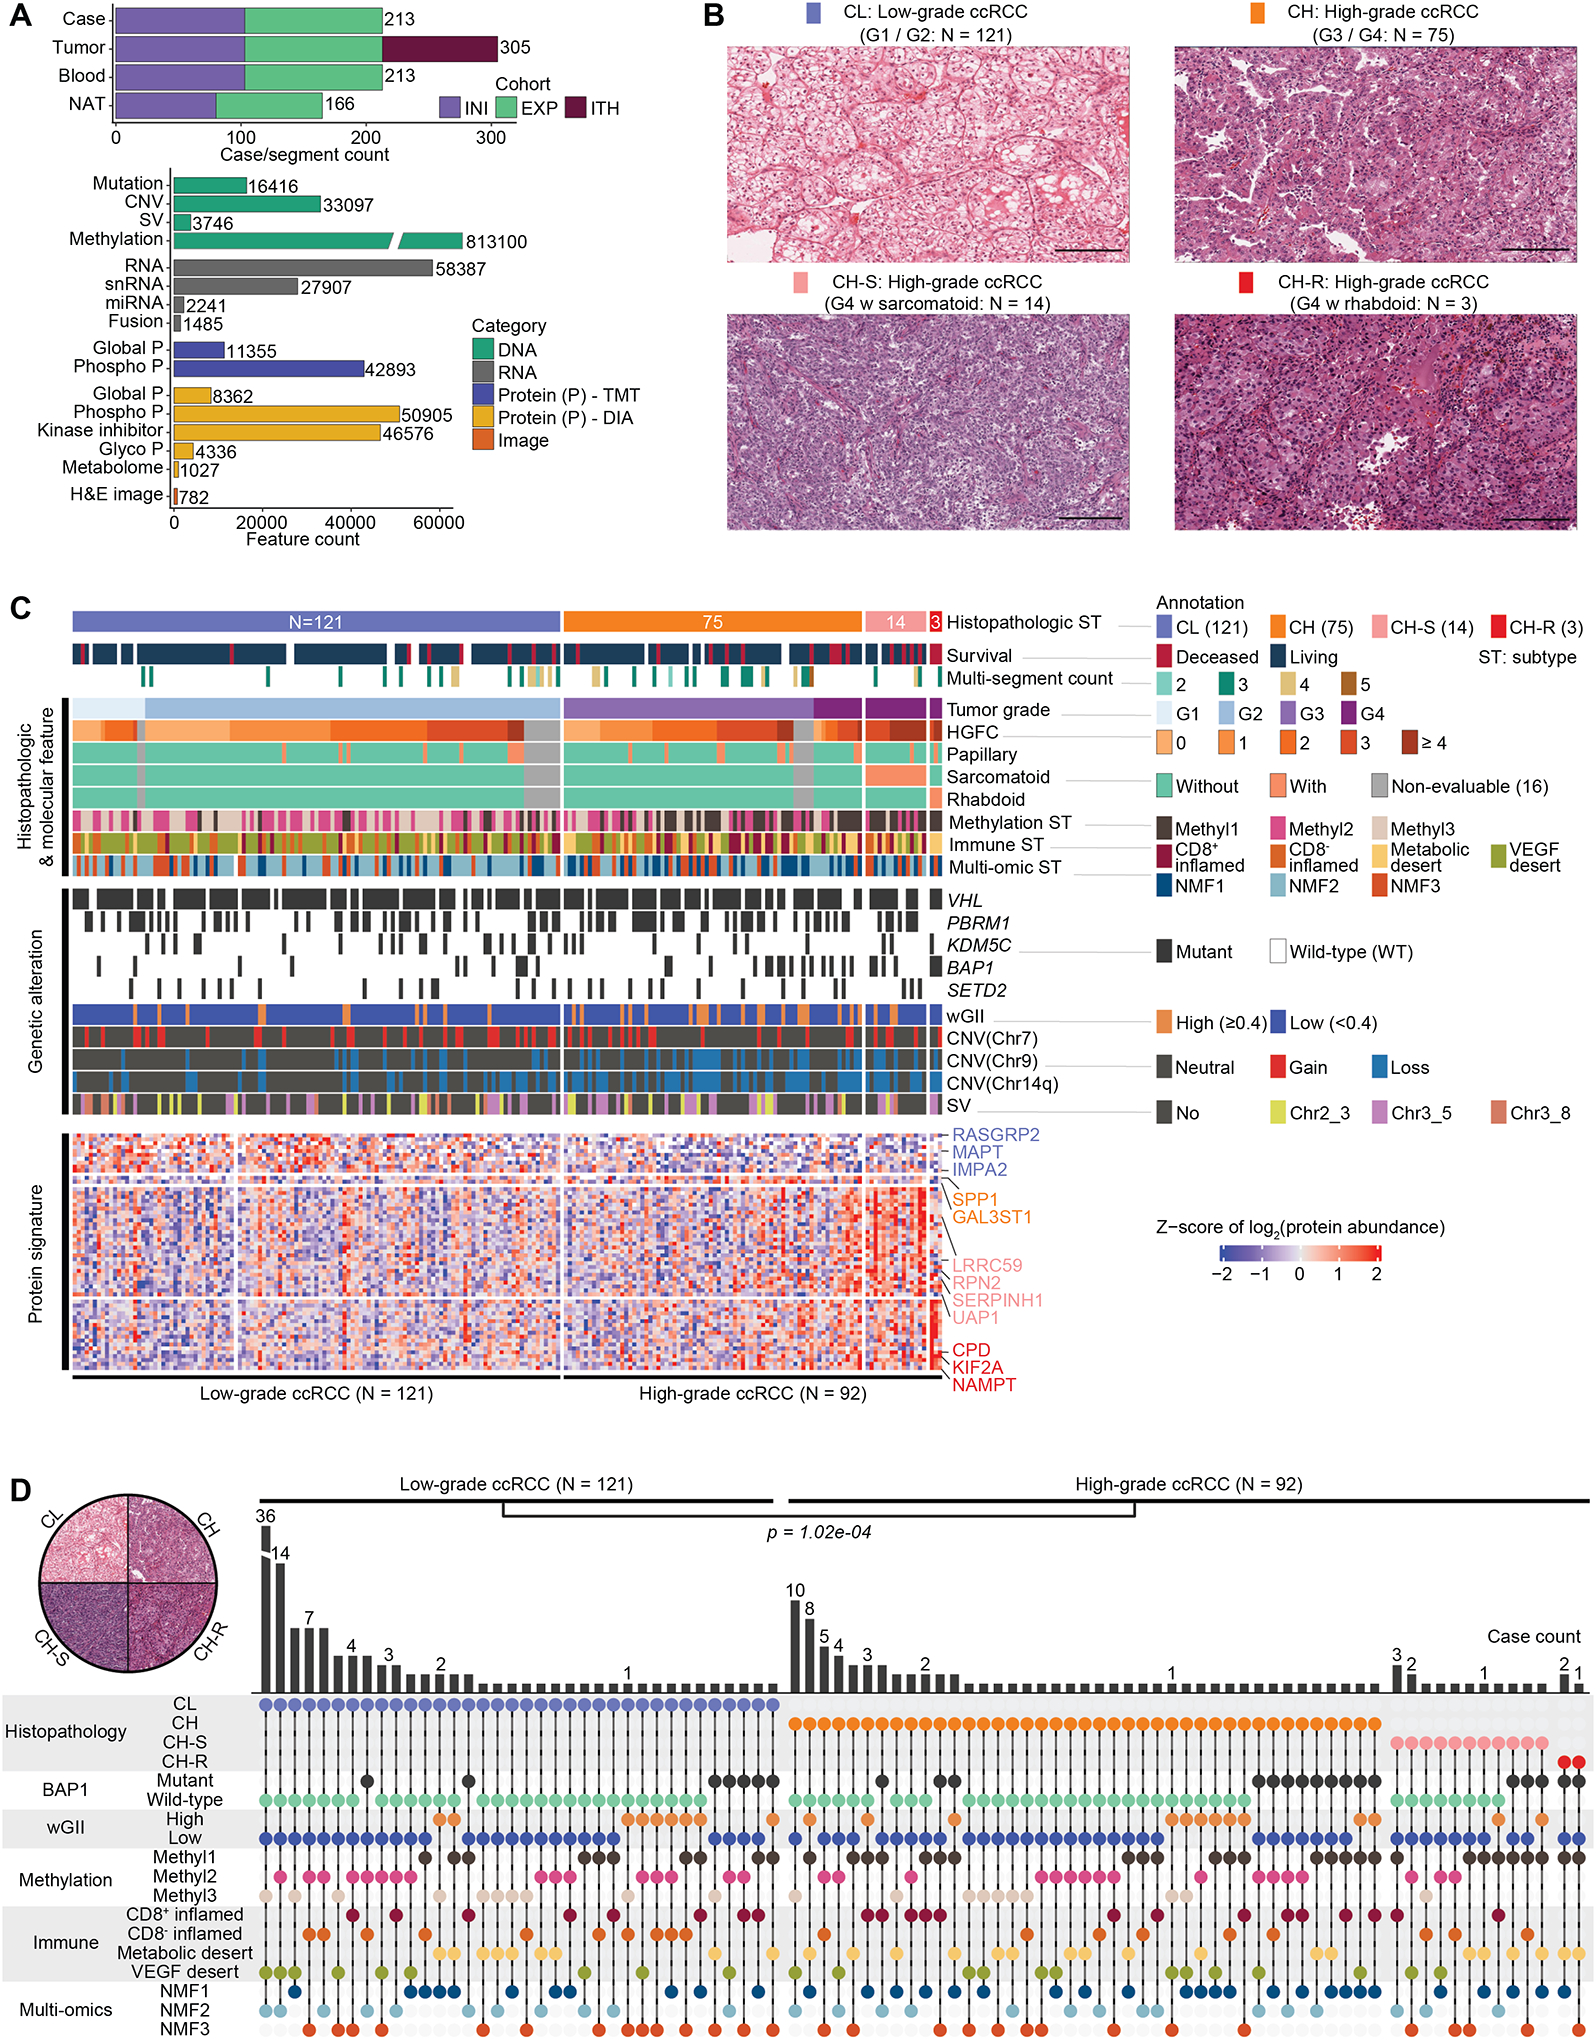
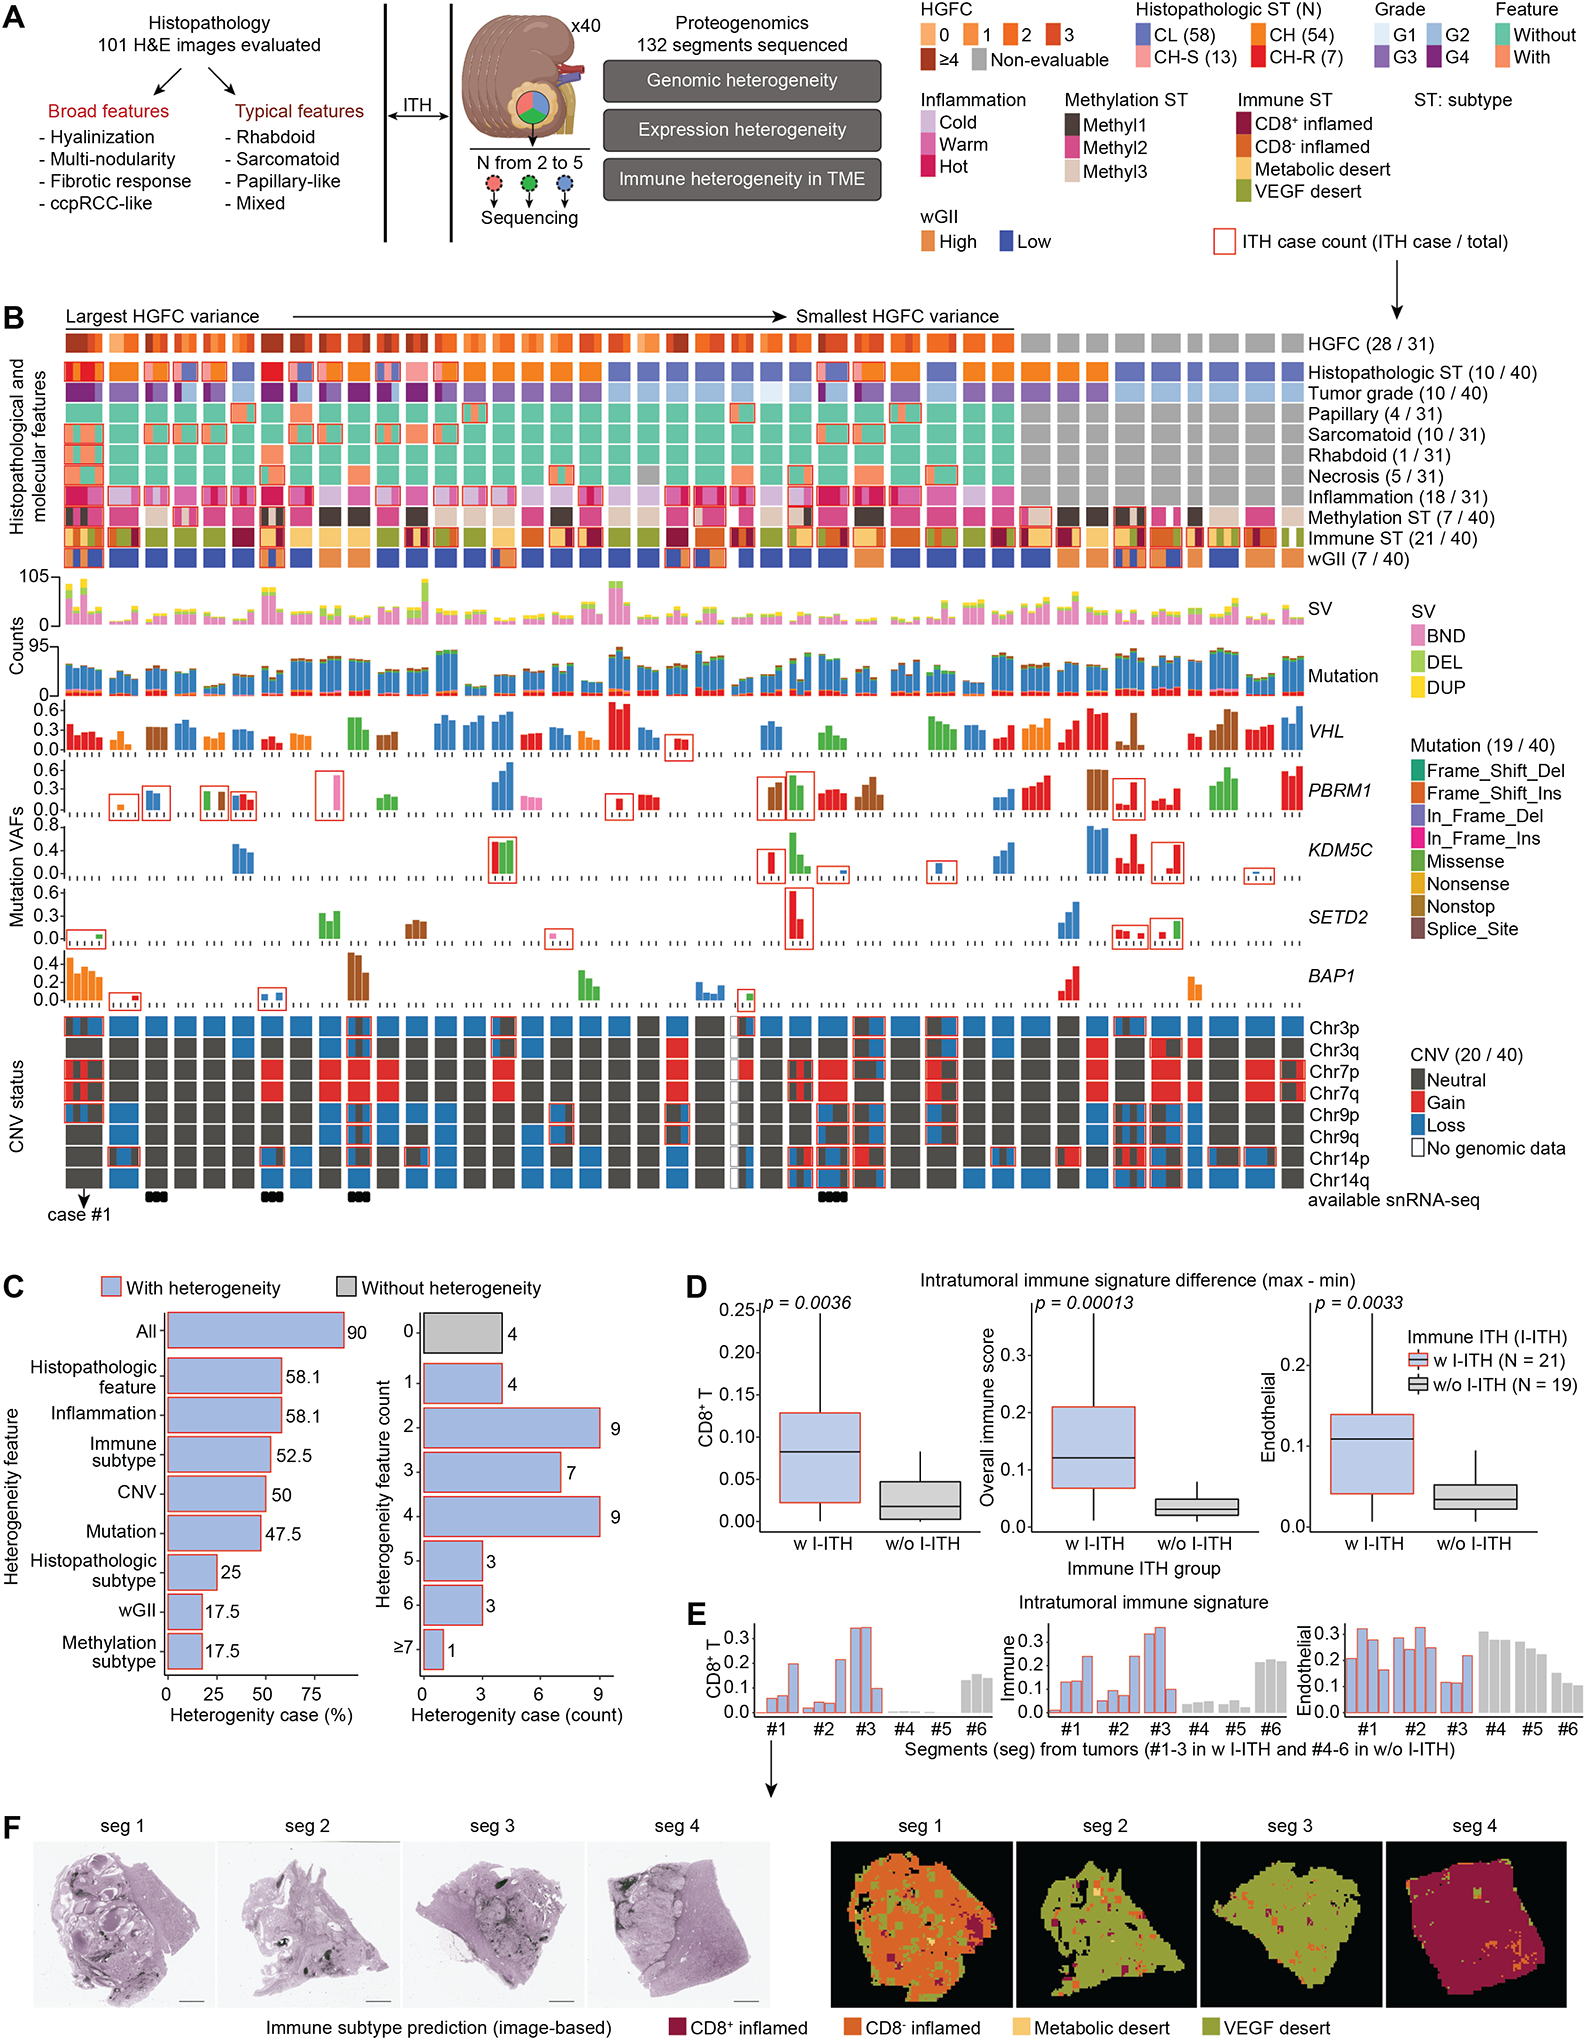
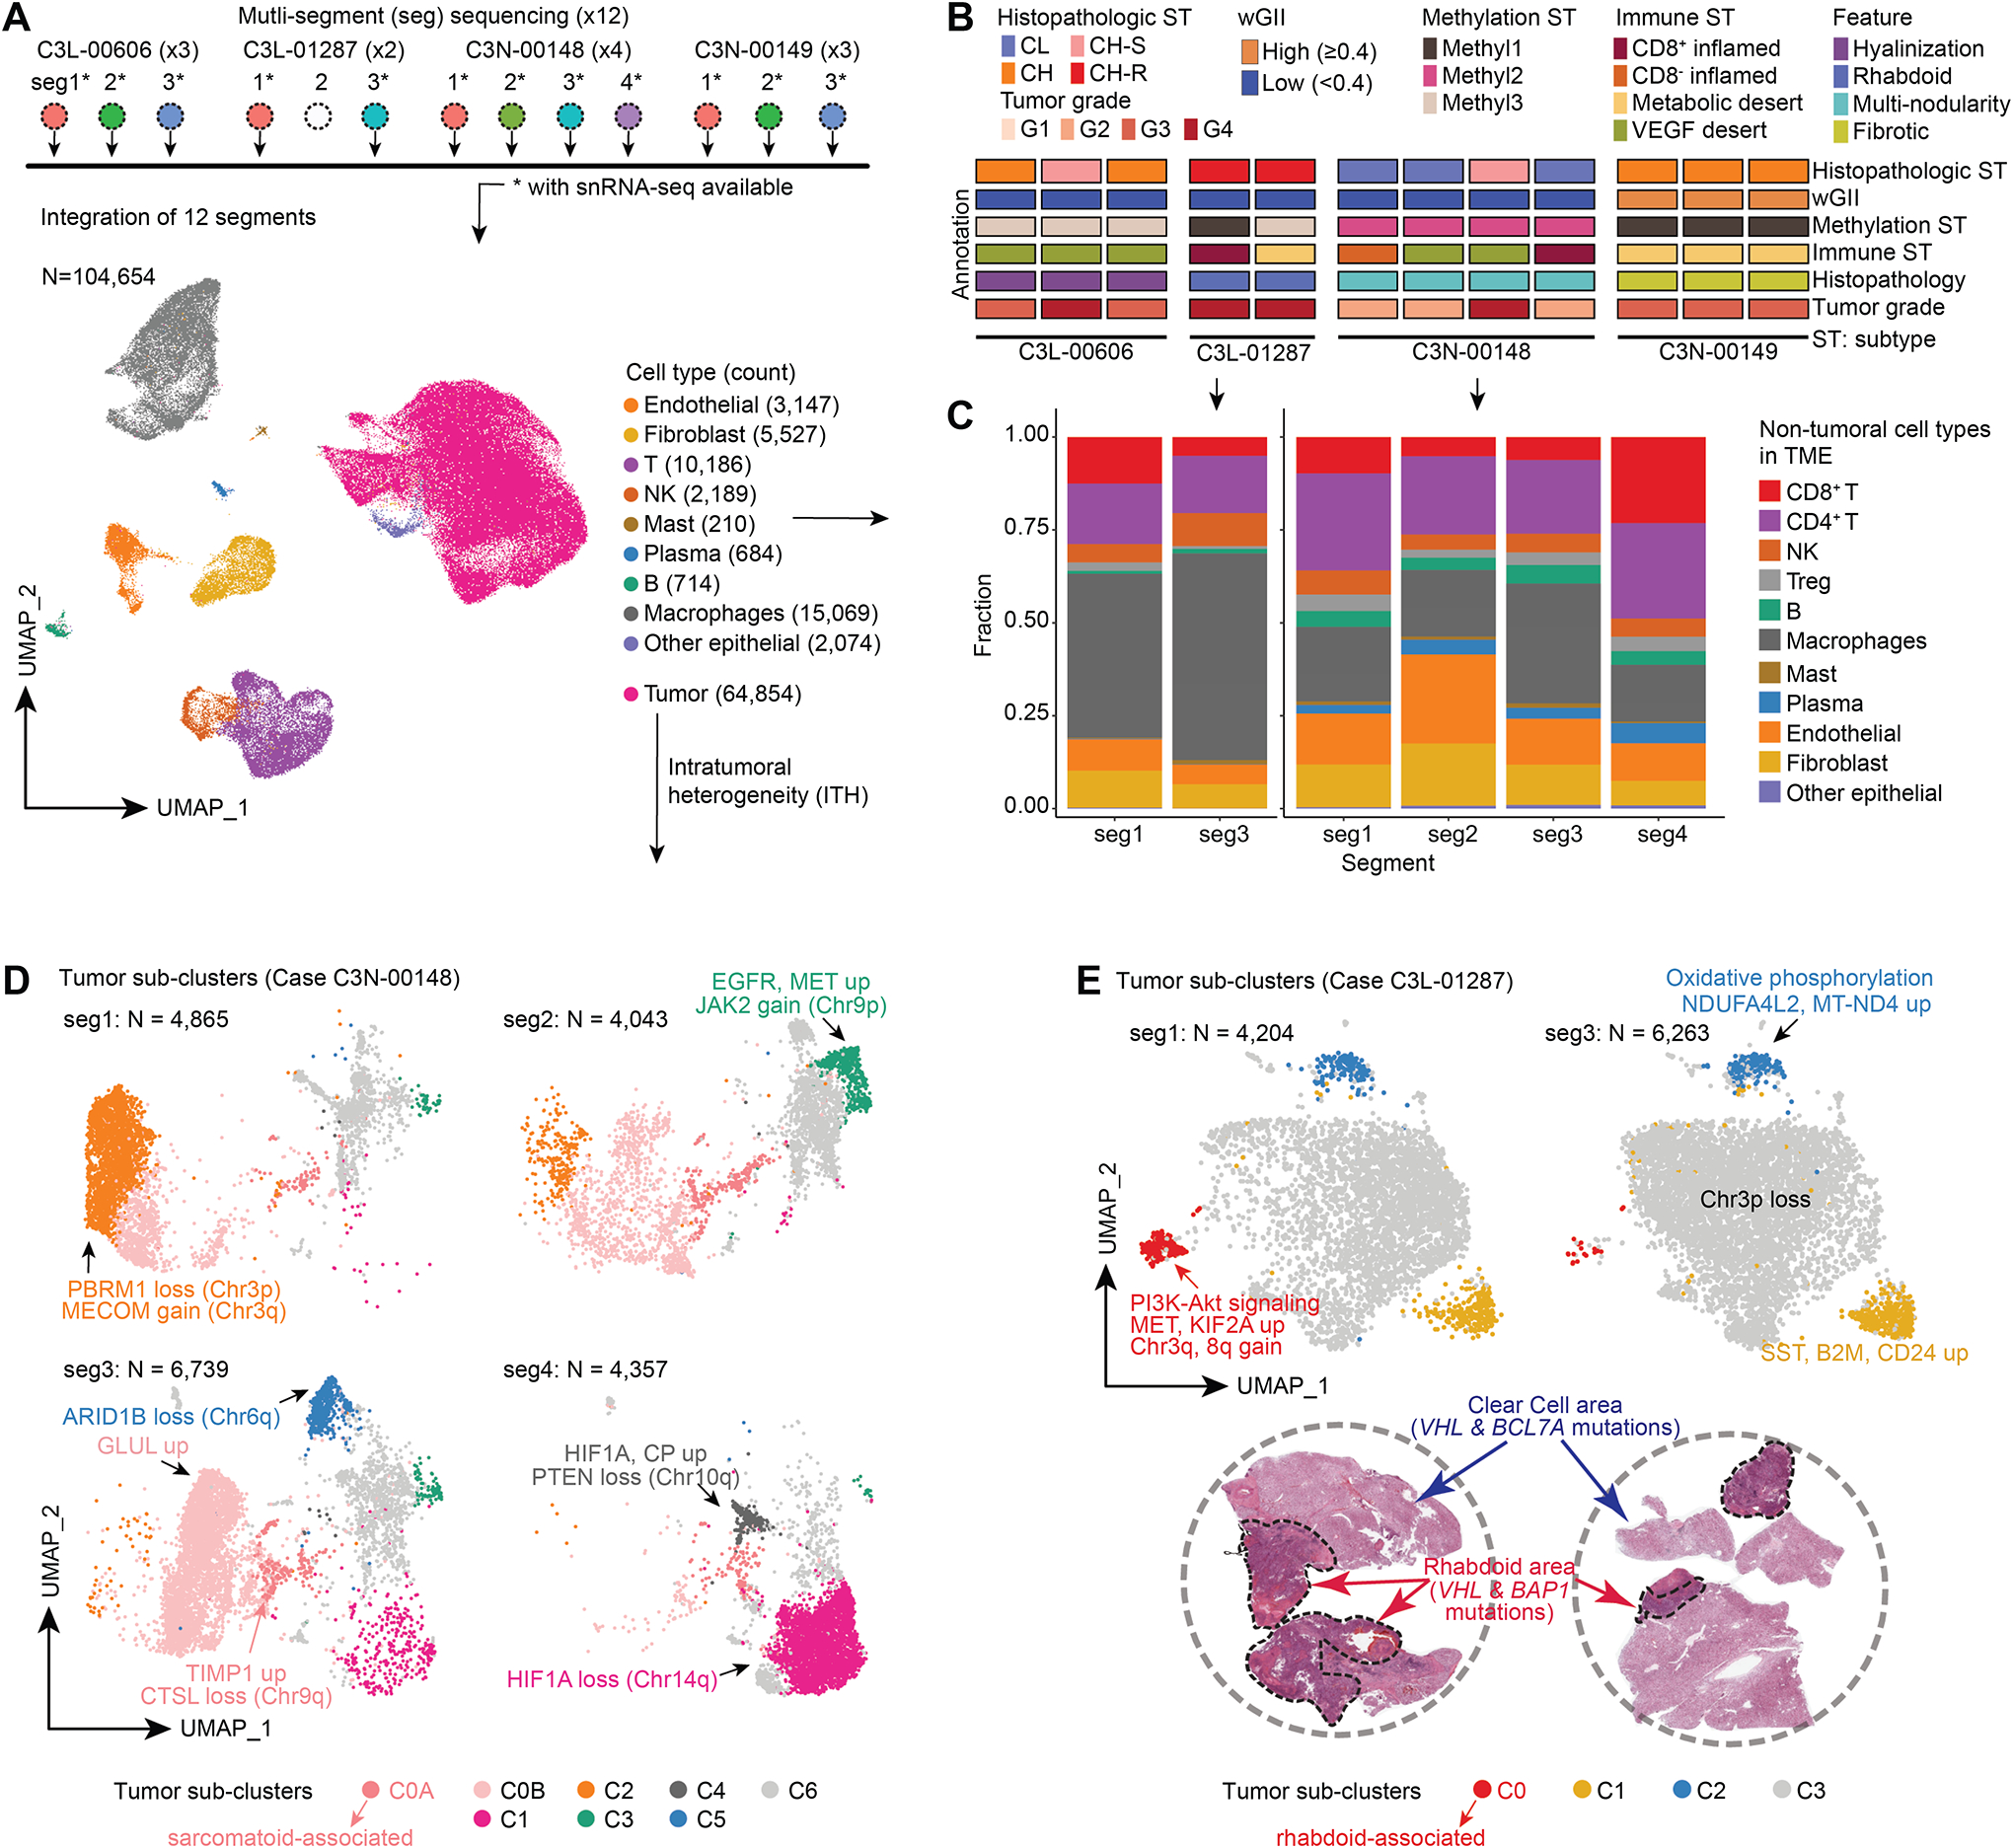
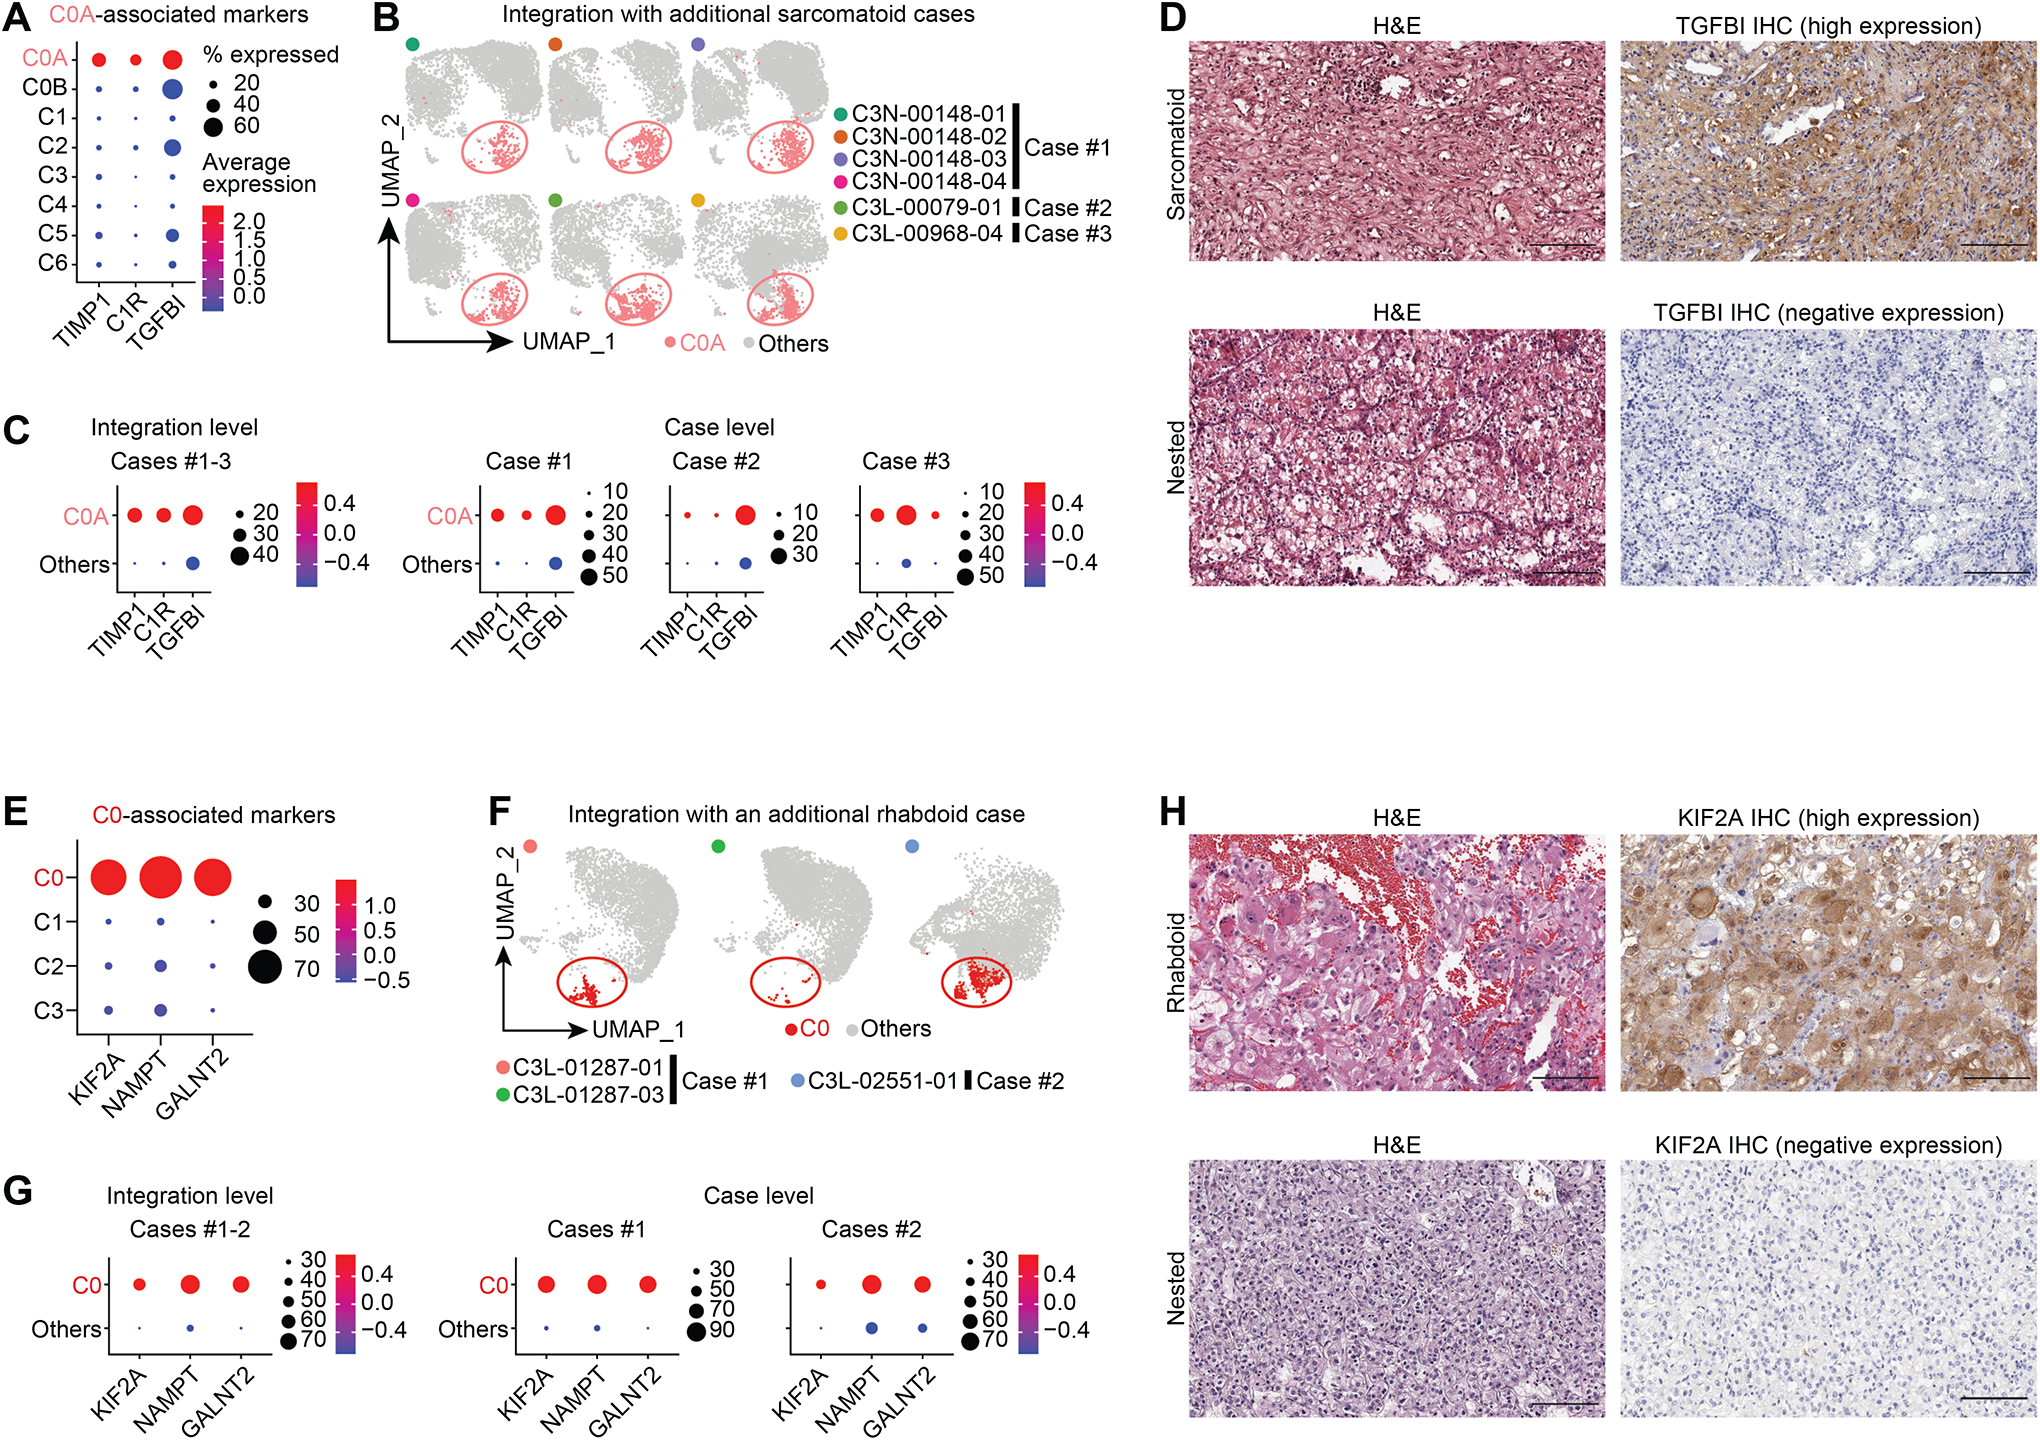
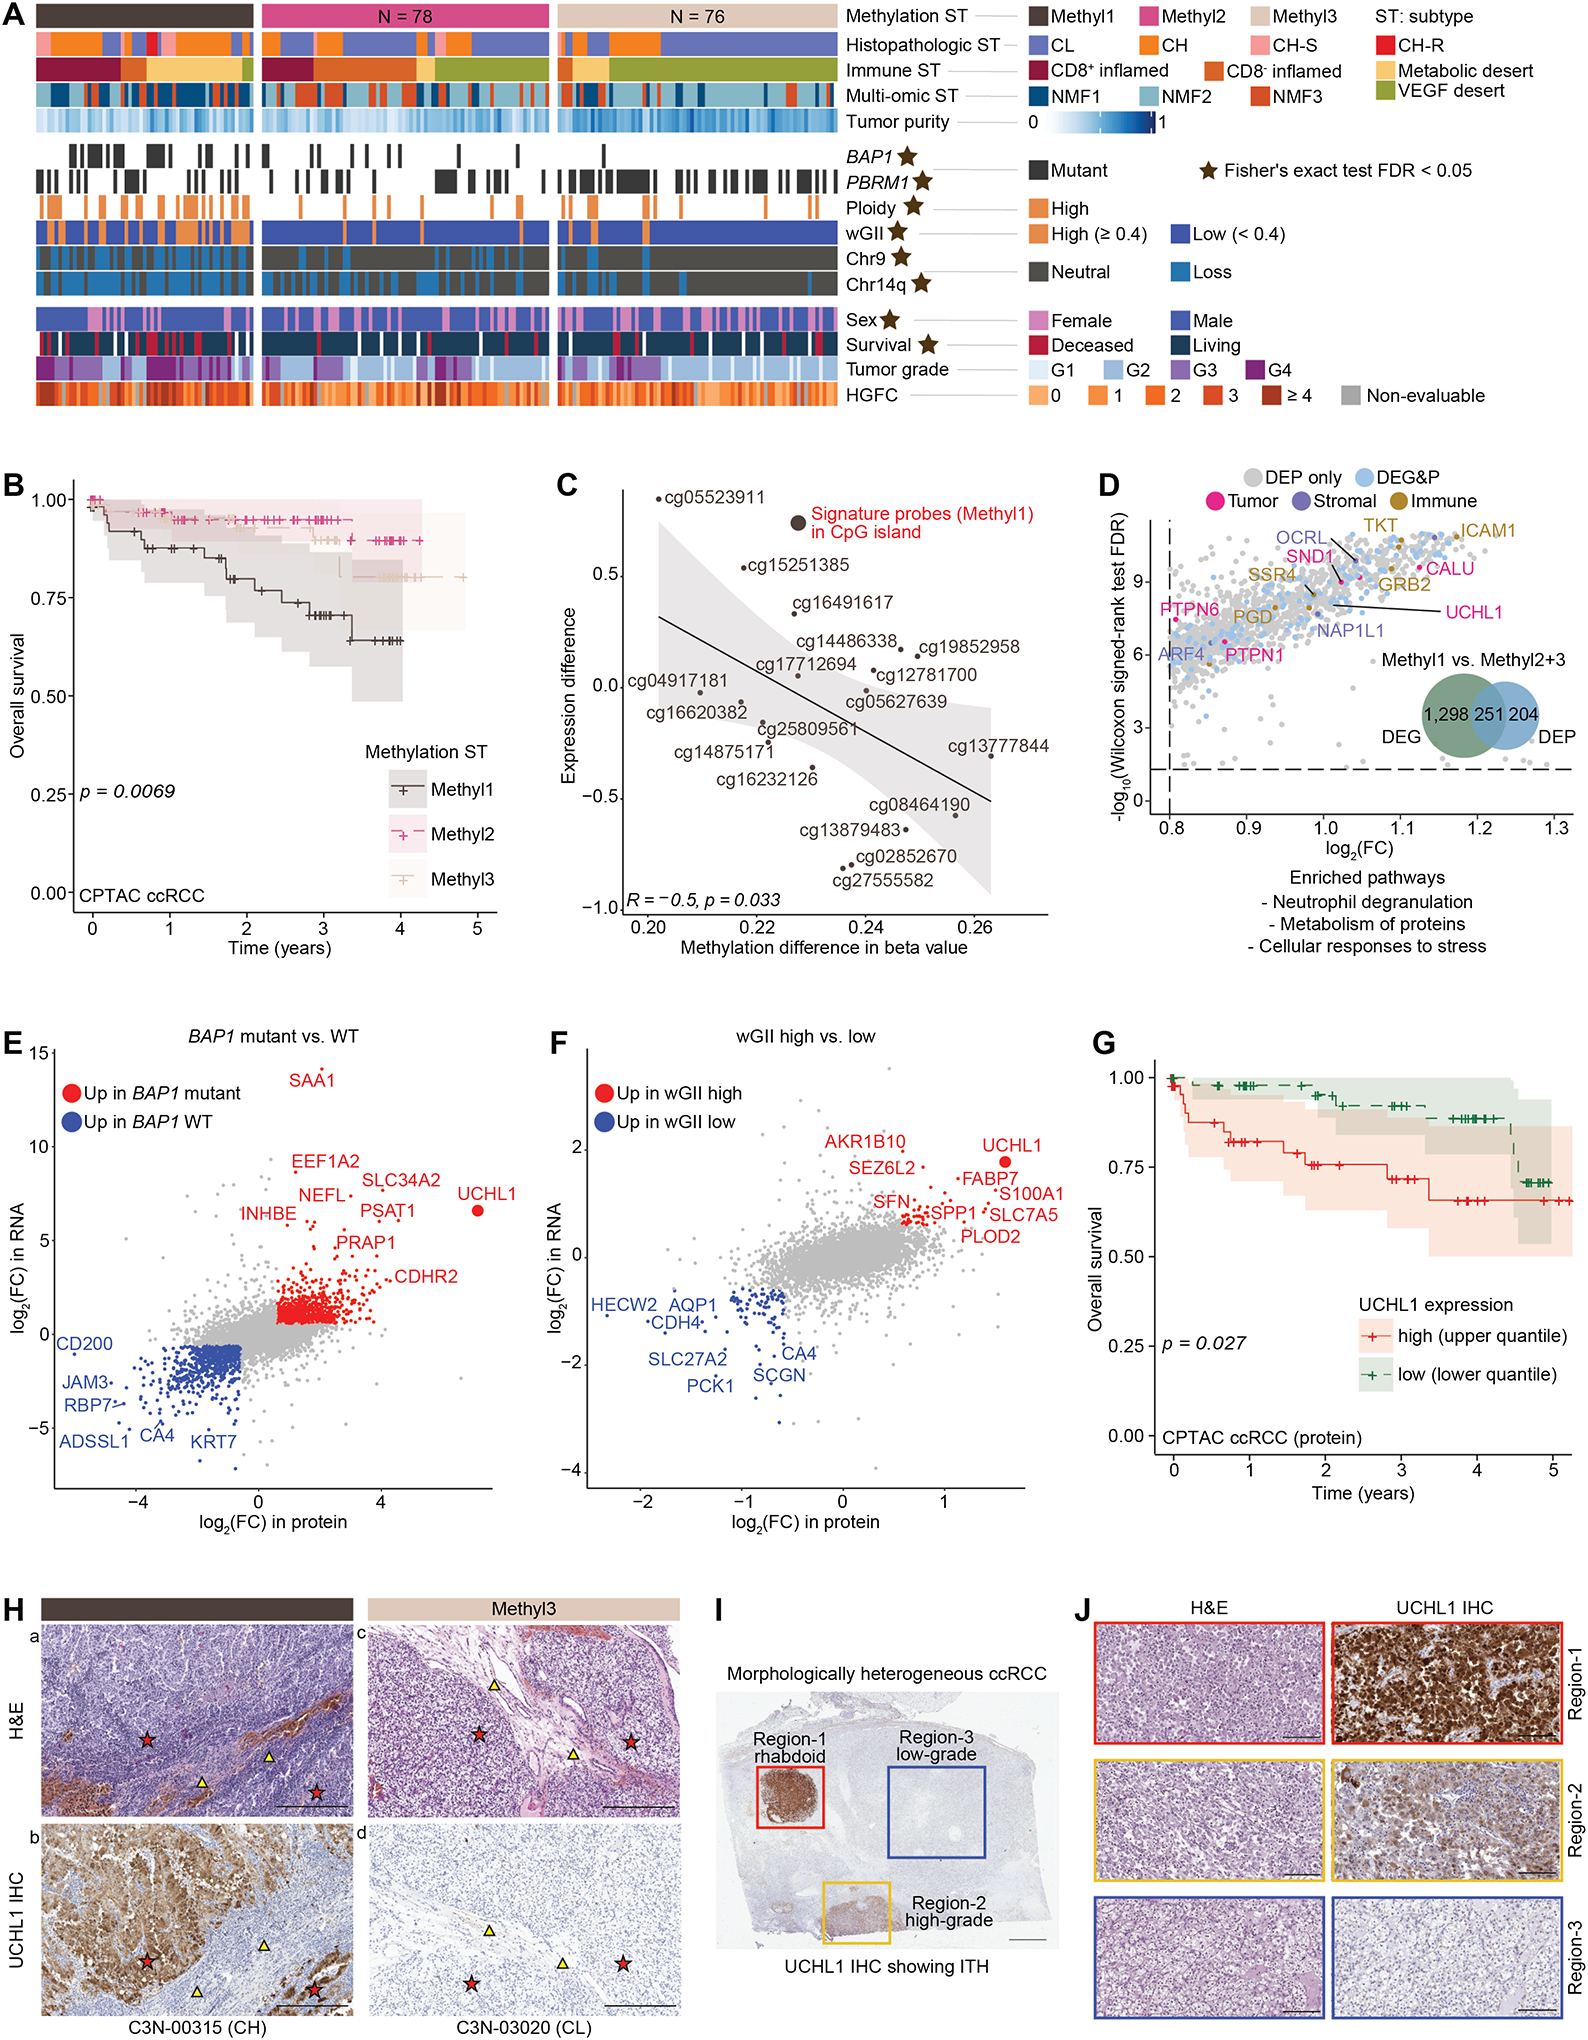
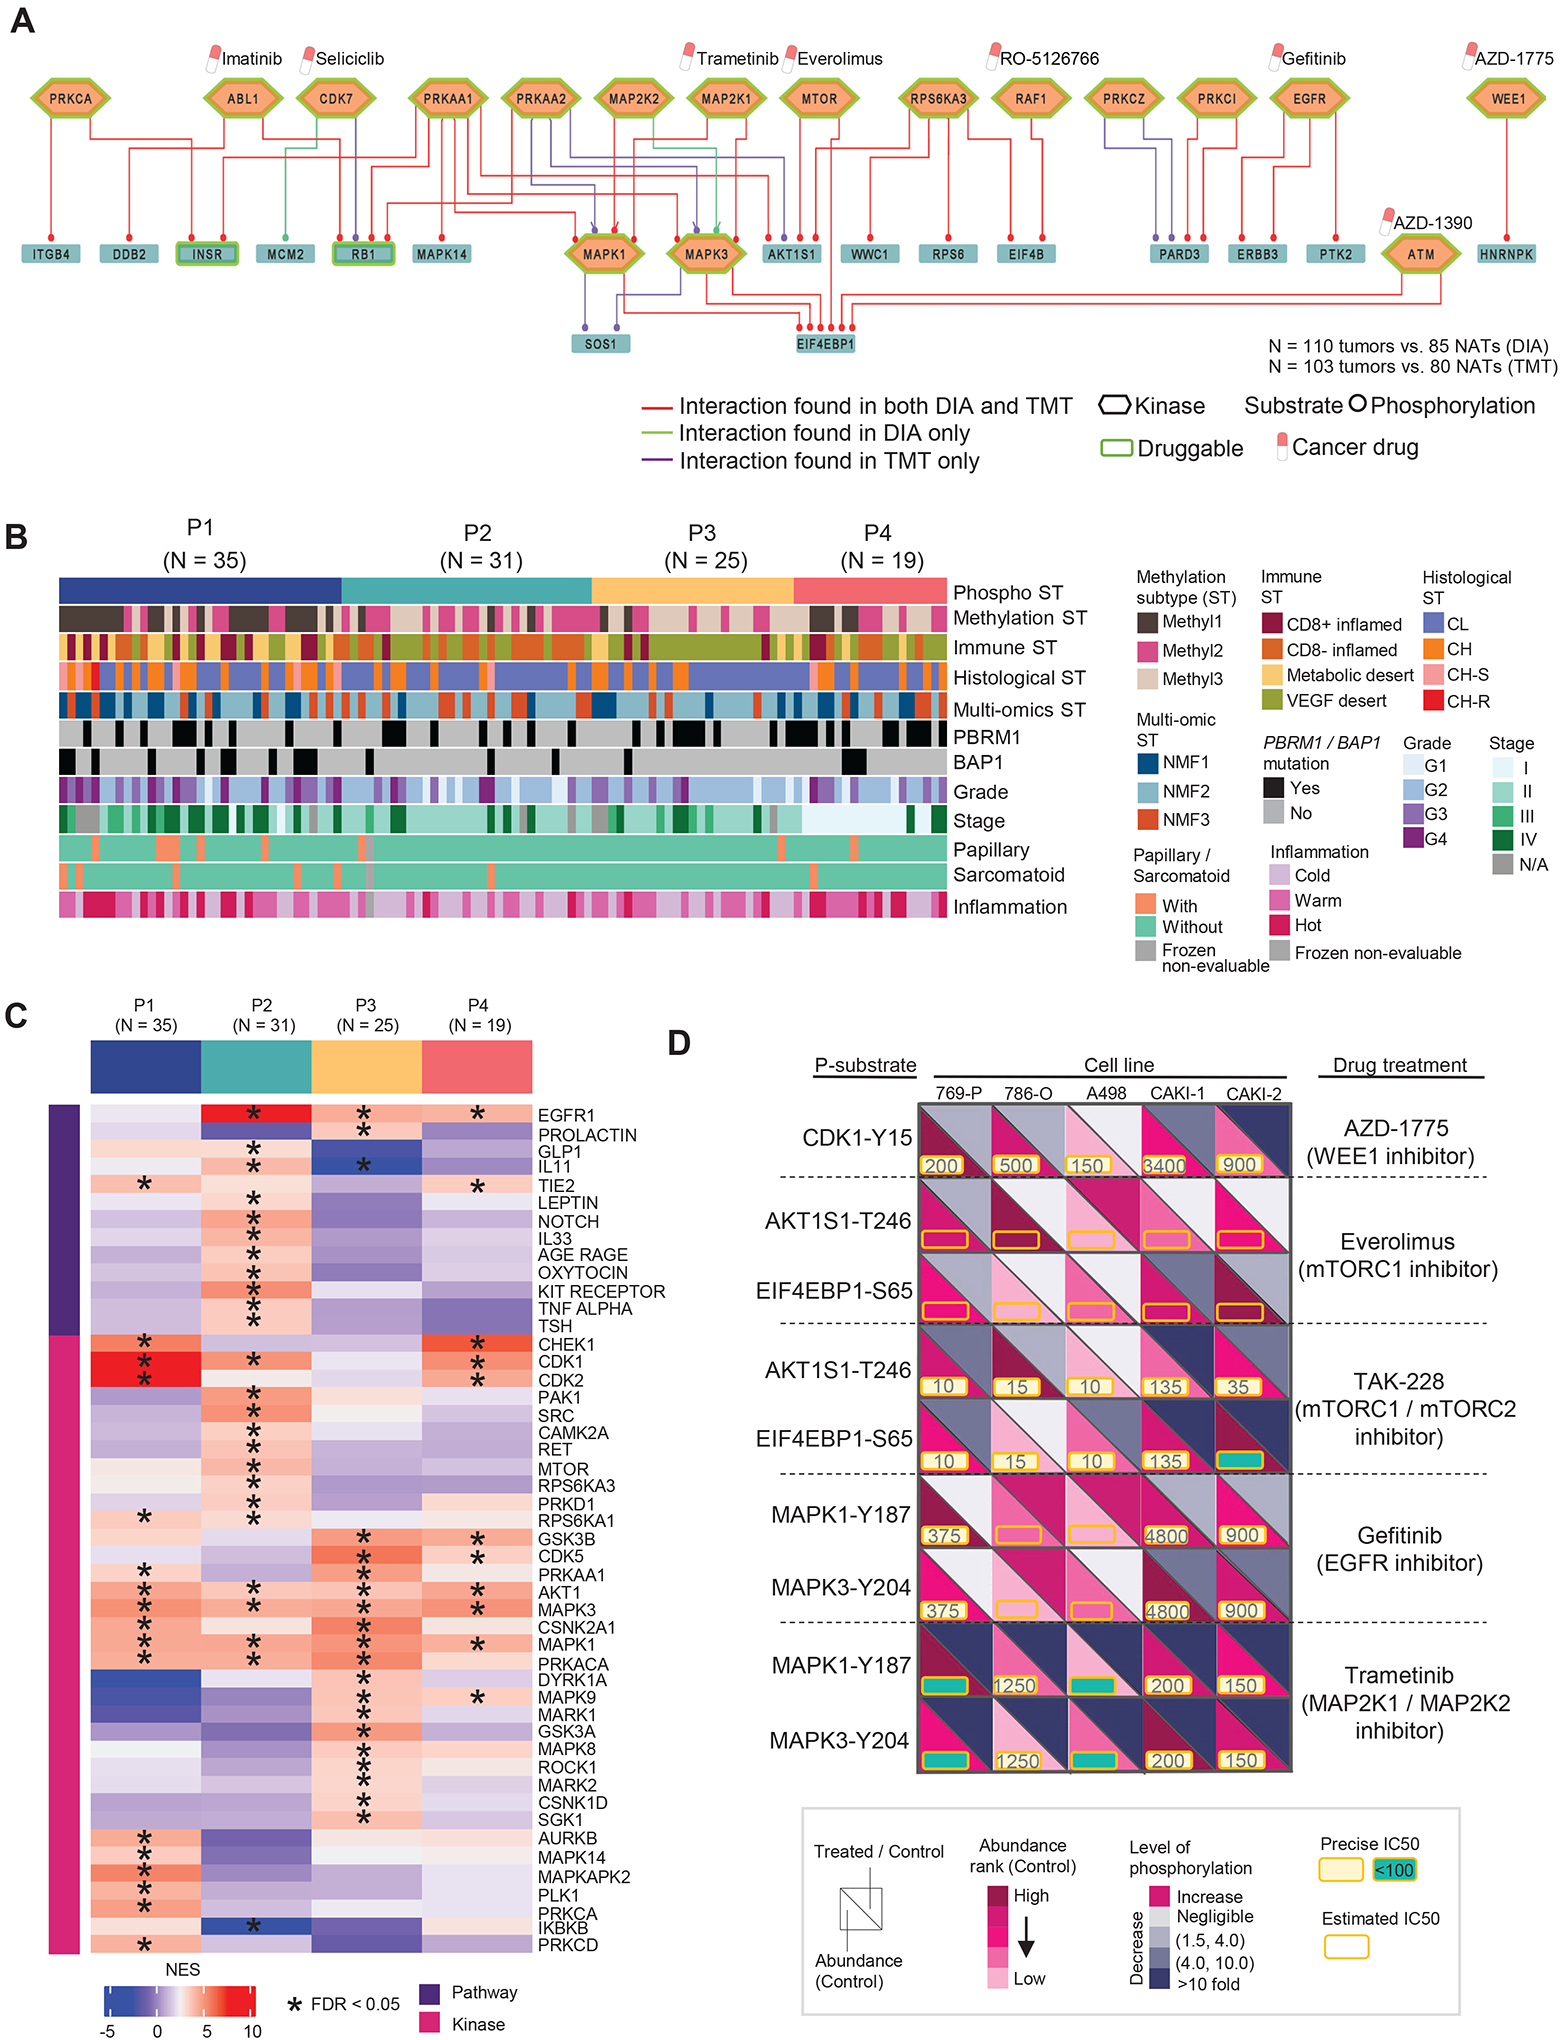
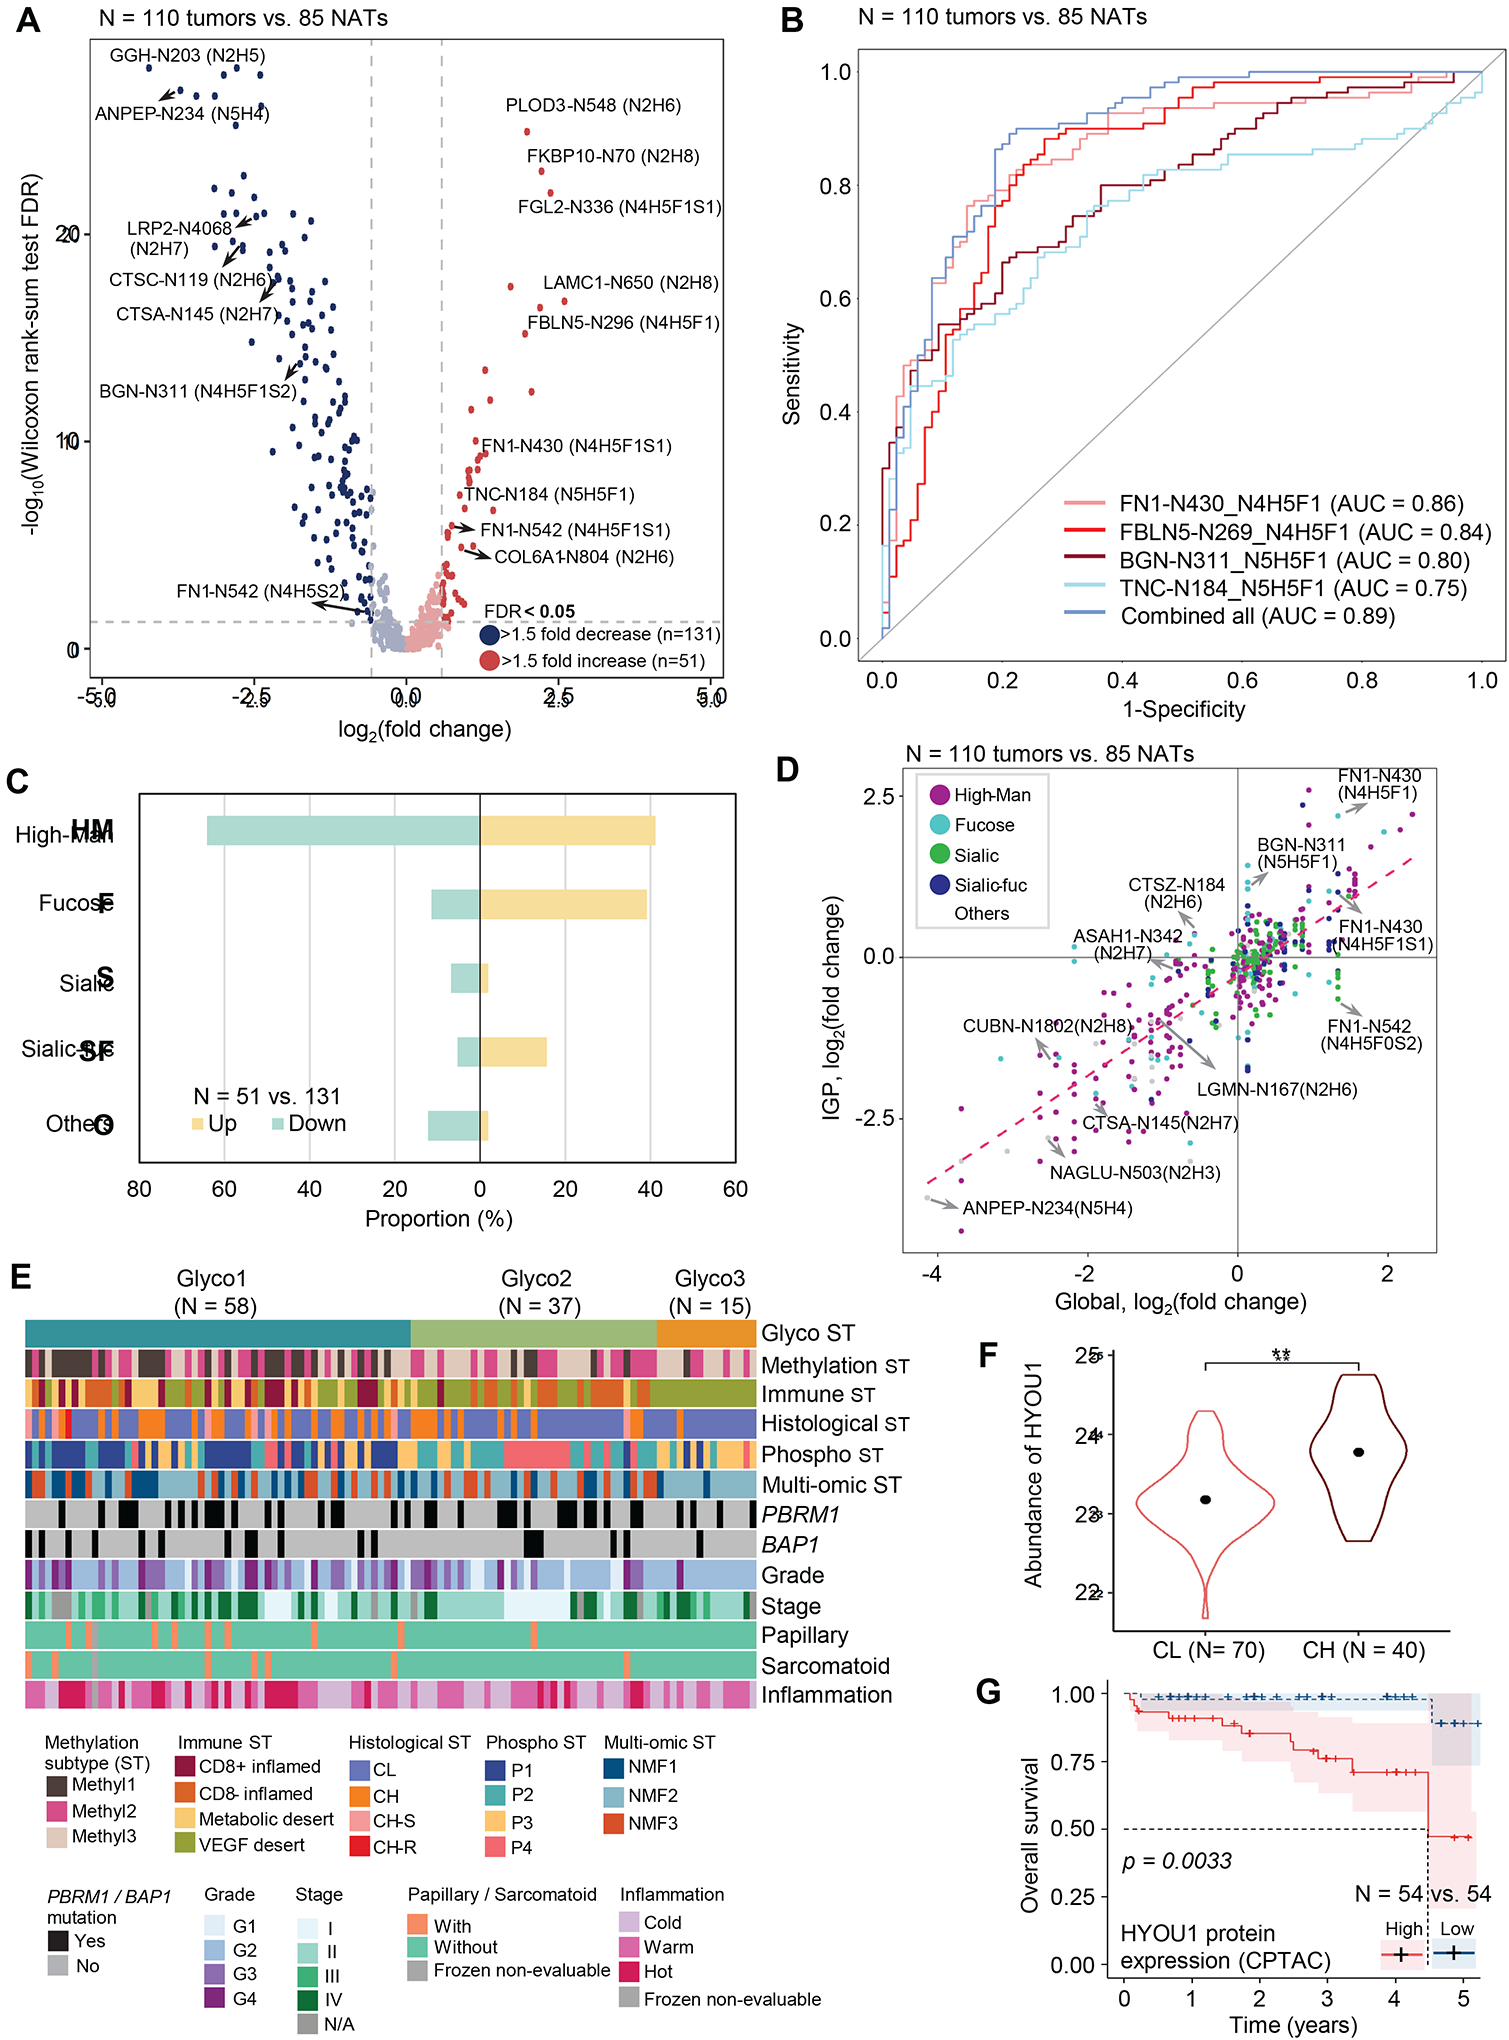
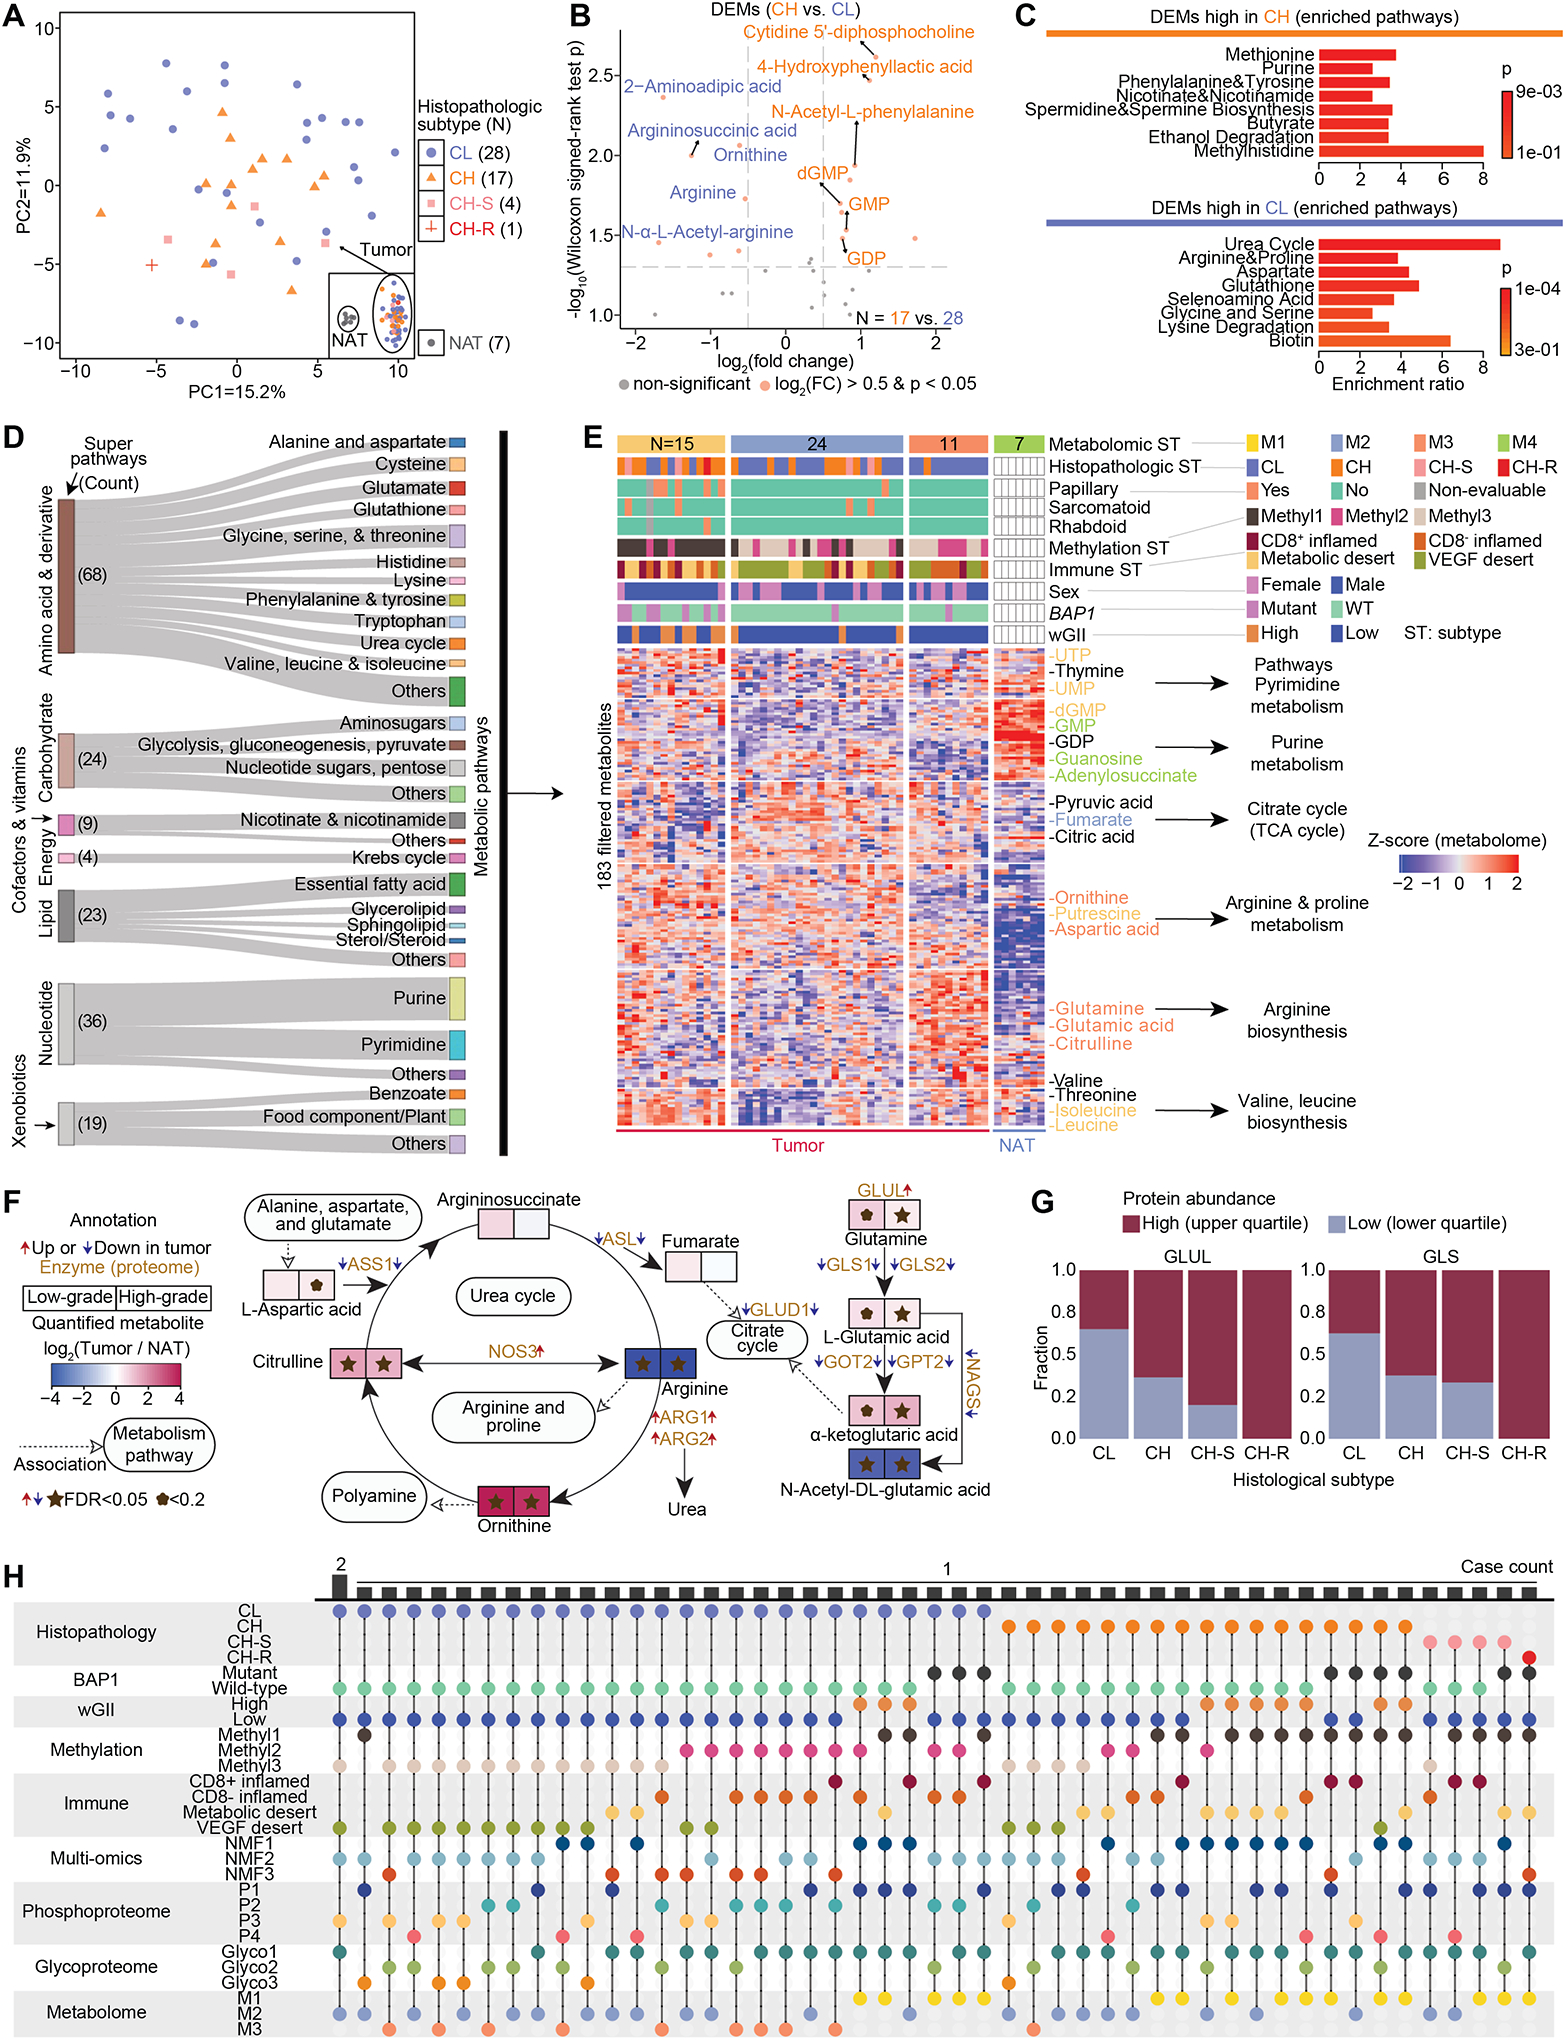
Clear cell renal cell carcinomas (ccRCCs) represent ∼75% of RCC cases and account for most RCC-associated deaths. Inter- and intratumoral heterogeneity (ITH) results in varying prognosis and treatment outcomes. To obtain the most comprehensive profile of ccRCC, we perform integrative histopathologic, proteogenomic, and metabolomic analyses on 305 ccRCC tumor segments and 166 paired adjacent normal tissues from 213 cases. Combining histologic and molecular profiles reveals ITH in 90% of ccRCCs, with 50% demonstrating immune signature heterogeneity. High tumor grade, along with BAP1 mutation, genome instability, increased hypermethylation, and a specific protein glycosylation signature define a high-risk disease subset, where UCHL1 expression displays prognostic value. Single-nuclei RNA sequencing of the adverse sarcomatoid and rhabdoid phenotypes uncover gene signatures and potential insights into tumor evolution. In vitro cell line studies confirm the potential of inhibiting identified phosphoproteome targets. This study molecularly stratifies aggressive histopathologic subtypes that may inform more effective treatment strategies.

Keywords: CPTAC; UCHL1; clear cell renal cell carcinoma; glycoproteomics; histology; metabolome; phosphoproteomics; proteogenomics; single-nuclei RNA-seq; tumor heterogeneity.


Conflict of interest statement

Declaration of interests The authors declare no competing interests.

Figures

Figure 1.
Figure 1.. Molecular underpinnings of ccRCC histopathologic heterogeneity.
A) Sample cohorts and data type overview. Top: Numbers of cases, tumors, matched NATs, and peripheral blood samples profiled, and their cohort-wise distribution, namely INI- initial, EXP-expanded, and ITH- intratumoral heterogeneity sample cohorts. Bottom: Feature in genomics, proteomic, metabolomic, kinase inhibitor, and image data types. B) Distribution of ccRCC cohort. Representative H&E based on nuclear grade and cytological features. Low-grade ccRCC (CL), High-grade ccRCC (CH) CH with sarcomatoid (CH-S), and CH with rhabdoid (CH-R). Scale bar = 200 microns. C) Proteogenomic features associated with histopathologic subtypes. Key histological features, clinical parameters, genetic aberrations, and proteomic signatures are presented sequentially. D) The distribution of histopathologic, BAP1 mutation, wGII, methylation, immune, and multi-omic subtypes among the 213 cases. Fisher’s exact test p = 1.02e-04; Pearson’s Chi-squared test p = 1.26e-04. See also Figure S1 and Table S1.
Figure 2.
Figure 2.. ccRCC proteogenomic and TME ITH characterization by multi-segment integrative analysis.
A) ITH cohort workflow showing multi-segment multi-omic molecular profiling strategy alongside extensive histopathologic assessment to enable integrative exploration of ITH. B) Proteogenomic aberration and histological features landscape of ITH cohort samples. Multi-panel heatmap details the molecular and histological information of the 132 tumor segments from 40 patients. C) Frequency of heterogeneity features and count in the ITH cohort. D) Distributions of xCell CD8+ T signature, overall immune signature, and endothelial signature between the groups with (w I-ITH) and without immune heterogeneity (w/o I-ITH). Wilcoxon signed-rank test p is calculated. Boxes represent the interquartile range (IQR, e.g., median indicated by solid line in box, 0.25 and 0.75 quantiles) and whiskers represent the largest and smallest values within 1.5 × IQR range. E) Comparison between 6 representative cases from w-ITH and w/o-ITH groups. F) Panoptes-based multi-resolution neural network models were trained to predict immune subtypes (right) based on H&E (left). Scale bar = 3mm. See also Figure S2 and Table S2.
Figure 3.
Figure 3.. Single-nuclei RNA-seq atlas identifies distinct intra-tumor epithelial populations.
A) snRNA-seq analysis workflow schematic (Top). snRNA-seq cell atlas generated from 12 segments obtained from 4 cases (Bottom). The UMAP displays 26 cell clusters that were subsequently annotated as 10 different cell types. B) Schematic tracks present the heterogeneity observed in the 12 segments at the histological and molecular characterizations. C) Frequency and composition of non-tumoral cell types found in the TME in C3L-01287 and C3N-00148 with immune ITH. D) UMAP shows the tumor sub-clusters and the corresponding ITH found in 4 segments obtained from C3N-00148 with critical molecular feature annotations indicated. E) UMAP representation of tumor subclusters ITH in the 2 segments of C3L-01287 (Top). H&E reveals the presence of classic clear cell and mutually exclusive rhabdoid regions in this tumor (bottom). WES using dissected regions showed VHL mutation in clear cell region, and VHL and BAP1 mutations in rhabdoid region. See also Figure S3 and Table S3.
Figure 4.
Figure 4.. snRNA-seq atlas further refines sarcomatoid and rhabdoid histology-associated gene expression signatures.
A) Expression profiles of the top markers associated with the C0A tumor cluster in C3N-00148, where bubble diameter represents fraction of cells with expression in a given cluster. Color blue to red- expression down to up. B) UMAPs show the integration of three sarcomatoid cases. C) Bubble plots show expression of top markers associated with C0A tumor cluster in snRNA-seq at integration and individual levels. D) Corresponding high and low expression of TGFBI protein in two representative cases with strong staining positivity noted in sarcomatoid area and its absence in nested clear cell area. Scale bar = 200 microns. E) Expression profiles of the top markers associated with C0. F) UMAPs show the integration two rhabdoid cases. G) Expression profiles of the top markers associated with C0 tumor cluster in snRNA-seq at integration and individual levels. H) Corresponding high and low expression of KIF2A IHC with strong staining intensity noted in the rhabdoid area with no staining in the nested clear cell area. Scale bar = 200 microns. See also Figure S3 and Table S3.
Figure 5.
Figure 5.. DNA hypermethylated Methyl1 subtype is associated with BAP1 mutations and various other features linked to poor survival.
A) Patient classification by three DNA methylation subtypes (heatmap). Annotation tracks below indicate molecular, genetic, and clinical/histological categories. Star sign indicates the statistically significant association (Fisher’s exact test FDR < 0.05). B) Kaplan Meier plot indicates the association between overall survival and the three methylation subtypes in CPTAC ccRCC cohort. Log-rank test p is 0.0069. C) Correlation between methylation difference (beta value) and RNA expression difference of the top Methyl1 signature probes (genes). D) DEPs associated with Methyl1 (vs. Methyl2 + Methyl3) and enriched pathways based on DEPs upregulated in Methyl1. E) DEGs and DEPs associated with BAP1 mutation status. UCHL1 was amongst the markers up in BAP1 mutants. F) DEGs and DEPs associated with wGII category. UCHL1 was amongst the markers up in high wGII high group. G) Kaplan Meier plot indicates the association between overall survival and UCHL1 protein abundance in CPTAC ccRCC cohort. Log-rank test p is 0.027. H) Matched topographical comparison (asterisks) of uniform high expression of UCHL1 in a Methyl1 ccRCC (a, b), and absence of UCHL1 expression in a Methyl3 ccRCC (c, d). TME (triangles) in corresponding H&E and UCHL1 staining to match the topography. Scale bar = 300 microns. I) Characterization of UCHL1 in a morphologically heterogeneous ccRCC. Scale bar = 3mm. J) Regions 1 and 2 correspond to rhabdoid (red panel) and high-grade (yellow panel) nodules demonstrating strong and moderate UCHL1 expression, respectively. Region 3, the low-garde area (blue panel) shows absence of UCHL1. Scale bar = 200 microns. See also Figure S4 and Table S4.
Figure 6.
Figure 6.. Identification of key phospho signaling pathways, kinase-substrate (K-S) interactions in ccRCC tissues, and integration of ex-vivo kinase drug inhibition data from RCC cell lines.
A) Top 50 signaling pathways of K-S pairs with the highest phospho-substrate abundance (tumors vs. NATs). The labeled cancer drugs are not exhaustive and they are either under investigation or FDA-approved. B) Phosphoproteomic subtypes (P1–4) are overlaid with 11 variables from molecular, genetic, and histologic features shown as annotation tracks immediately below. C) Pathways and kinase activities are inferred from phosphoproteomic data for each phospho subtype. NES: normalized enrichment score from PTM-SEA. D) Schematic representation summarizing the kinase inhibition experiment conducted in five RCC cell lines targeting the kinases identified in our initial cohort. The phosphorylation level changes in the downstream substrates of targeted kinases indicate the response to the corresponding treatments relative to the control. Each cell line with one control and treated with five different kinase inhibitors. See also Figure S5 and Table S5.
Figure 7.
Figure 7.. Alteration of protein glycosylation specific to ccRCC and high-grade ccRCC.
A) Volcano plot shows Intact glycopeptides (IGPs) differentially expressed between tumors and NATs. B) Performance of glyco-signatures individually and as a multi-signature panel for differentiating tumor and non-tumor tissues. C) Glycan type distribution of differentially expressed IGPs (tumors vs. NATs). D) Glycosylation changes (y-axis) compared to global protein expression (x-axis) changes in tumors vs NATs. E) Glycoproteomic subtypes (Glyco1–3) are overlaid with 12 variables represented by individual tracks immediately below. F) Violin plot shows HYOU1 protein abundance between CL and CH tumors. ** indicates that Wilcoxon rank-sum test FDR < 0.01. Dots in the violin plots correspond to median abundance. The violin plot outlines demonstrate the kernel probability. G) Kaplan Meier plot compares HYOU1 protein expression between High (upper quartile) and Low (lower quartile) groups in the CPTAC cohort. Log-rank test p is 0.0033. See also Figure S6 and Table S6.
Figure 8.
Figure 8.. Dysregulated metabolism in high-grade and low-grade ccRCC.
A) PCA plot shows the distribution of 50 tumors by metabolome characterization. The separation with 7 NATs is shown in the inset box. B) DEMs between high-grade tumors and low-grade tumors. The significantly upregulated DEMs are in orange if their Wilcoxon signed-rank test p < 0.05 and absolute fold change > 2. C) Enriched metabolic pathways corresponding to CH and CL, respectively. Hypergeometric test p is calculated. D) Sankey diagram visualizes the distribution of metabolic pathways and super pathways for the 183 metabolites used for metabolomic subtyping. E) Heatmap shows the four metabolomic subtypes that were identified among the 50 tumors and 7 NATs. The signature metabolites were annotated next to the heatmap and colored by the metabolomic subtype if they are significantly higher in one subtype. F) Network plot of Arginine biosynthesis, Urea cycle, and Citrate cycle demonstrates the connection of metabolites and enzymes, and the expression fold change of metabolites and direction of enzymes in tumors compared with NATs. Wilcoxon signed-rank test FDR is calculated. G) Among the 213 cases, the fractions of high expression of GLUL and GLS are higher in high-grade tumors compared with those of low-grade tumors as indicated by these stacked bar plots. H) The distribution of 50 tumors with multi-level profiling of histological, BAP1 mutation, wGII, methylation, immune, multi-omic, phospho, glyco, and metabolome subtypes. See also Figure S7 and Table S7.

References

    1. Hsieh JJ, Purdue MP, Signoretti S, Swanton C, Albiges L, Schmidinger M, Heng DY, Larkin J, and Ficarra V (2017). Renal cell carcinoma. Nat Rev Dis Primers 3, 17009. 10.1038/nrdp.2017.9. - DOI - PMC - PubMed
    1. Siegel RL, Miller KD, Fuchs HE, and Jemal A (2021). Cancer Statistics, 2021. CA Cancer J Clin 71, 7–33. 10.3322/caac.21654. - DOI - PubMed
    1. Motzer RJ, Jonasch E, Boyle S, Carlo MI, Manley B, Agarwal N, Alva A, Beckermann K, Choueiri TK, Costello BA, et al. (2020). NCCN Guidelines Insights: Kidney Cancer, Version 1.2021. J Natl Compr Canc Netw 18, 1160–1170. 10.6004/jnccn.2020.0043. - DOI - PMC - PubMed
    1. Blanco AI, Teh BS, and Amato RJ (2011). Role of radiation therapy in the management of renal cell cancer. Cancers (Basel) 3, 4010–4023. 10.3390/cancers3044010. - DOI - PMC - PubMed
    1. Diamond E, Molina AM, Carbonaro M, Akhtar NH, Giannakakou P, Tagawa ST, and Nanus DM (2015). Cytotoxic chemotherapy in the treatment of advanced renal cell carcinoma in the era of targeted therapy. Crit Rev Oncol Hematol 96, 518–526. 10.1016/j.critrevonc.2015.08.007. - DOI - PubMed

Publication types

Substances