. 2023 Mar 16;141(11):1337-1352.
doi: 10.1182/blood.2022018440.

Prevention of acute GVHD using an orthogonal IL-2/IL-2Rβ system to selectively expand regulatory T cells in vivo

Affiliations

Prevention of acute GVHD using an orthogonal IL-2/IL-2Rβ system to selectively expand regulatory T cells in vivo

Teresa L Ramos et al. Blood. .

Abstract

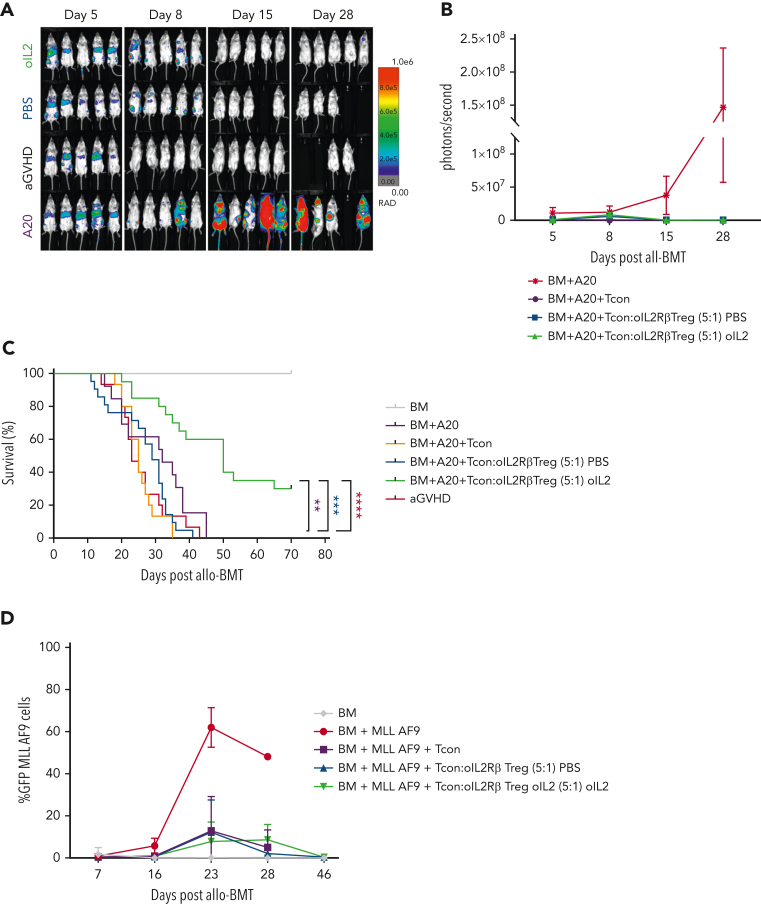
Allogeneic hematopoietic stem cell transplantation (allo-HSCT) is a curative option for patients with hematological disorders and bone marrow (BM) failure syndromes. Graft-versus-host disease (GVHD) remains a leading cause of morbidity posttransplant. Regulatory T cell (Treg) therapies are efficacious in ameliorating GVHD but limited by variable suppressive capacities and the need for a high therapeutic dose. Here, we sought to expand Treg in vivo by expressing an orthogonal interleukin 2 receptor β (oIL-2Rβ) that would selectively interact with oIL-2 cytokine and not wild-type (WT) IL-2. To test whether the orthogonal system would preferentially drive donor Treg expansion, we used a murine major histocompatibility complex-disparate GVHD model of lethally irradiated BALB/c mice given T cell-depleted BM from C57BL/6 (B6) mice alone or together with B6Foxp3+GFP+ Treg or oIL-2Rβ-transduced Treg at low cell numbers that typically do not control GVHD with WT Treg. On day 2, B6 activated T cells (Tcons) were injected to induce GVHD. Recipients were treated with phosphate-buffered saline (PBS) or oIL-2 daily for 14 days, then 3 times weekly for an additional 14 days. Mice treated with oIL-2Rβ Treg and oIL-2 compared with those treated with PBS had enhanced GVHD survival, in vivo selective expansion of Tregs, and greater suppression of Tcon expansion in secondary lymphoid organs and intestines. Importantly, oIL-2Rβ Treg maintained graft-versus-tumor (GVT) responses in 2 distinct tumor models (A20 and MLL-AF9). These data demonstrate a novel approach to enhance the efficacy of Treg therapy in allo-HSCT using an oIL-2/oIL-2Rβ system that allows for selective in vivo expansion of Treg leading to GVHD protection and GVT maintenance.


Conflict of interest statement

Conflict-of-interest disclosure: K.C.G. is the founder of Synthekine Therapeutics, which has licensed the ortho-2 technology. K.C.G. and L.K.P. are inventors on a patent application describing the ortho-2 system (biologically relevant orthogonal cytokine/receptor pairs, US patent no. 10,869,887B2). K.C.G., L.S., and L.K.P. are shareholders of Synthekine, a biotechnology company that has licensed the ortho–IL-2 technology. J.E.W. receives remuneration as an advisor to Magenta Therapeutics and BlueRock Therapeutics. B.R.B. receives remuneration as an advisor to Magenta Therapeutics and BlueRock Therapeutics; research funding from Carisma Therapeutics, Inc; and is a cofounder of Tmunity Therapeutics. The remaining authors declare no competing financial interests.

Figures

None
Graphical abstract
Figure 1.
Figure 1.
oIL-2 selectively expands oIL-2Rβ transduced Tregs in vitro and enhances Treg suppressive function. (A) Representative flow cytometry plot displaying CD25+Foxp3+ Treg expression (left) and frequency (right) in NT, tEGFR, and oIL-2Rβ Tregs (right). (B) Representative histogram plots of tEGFR expression (left) and frequency (right) in NT, tEGFR Tregs, and oIL-2Rβ Tregs. (C) Heatmap and hierarchical clustering of the differential gene expression from fTregs, tEGFR Tregs, and oIL-2Rβ Tregs. Genes related with activation and Treg suppression are highlighted. Expression for each gene is scaled across single rows. (D) Heatmap displaying mean fluorescence intensity (MFI) of Treg markers CTLA-4, CD25, ICOS, Lag3, and Ki67 in Tregs freshly harvested (day 0 [D0]) or tEGFR Tregs and oIL-2Rβ Tregs on day 7 after harvest. (E) Absolute number of Tregs after 4-day stimulation with WT (1000 IU/mL) or oIL-2 (100 000 IU/mL). Data are representative of 4 independent experiments. (F) Percent suppression of CD4+ and CD8+ T cells after coculture with Tregs at 1:12 Treg:Tcon ratio. (G) Representative histograms show dilution of proliferation dye on CD4+ T cells after coculture with Tregs at 1:12 Treg:Tcon ratio. Data are representative of 3 independent experiments. Student t test with Bonferroni correction for multiple comparisons was used for statistical analysis. Error bars indicate the standard deviation (SD) of the mean. ∗P < .05; ∗∗P < .01; ∗∗∗P < .001; ∗∗∗∗P < .0001. CTV, CellTrace Violet; ns, no significance.
Figure 2.
Figure 2.
In vivo injection of oIL-2 and oIL-2Rβ Tregs protect from lethal GVHD. (A) Schema of aGVHD mouse model. Survival curve (B) and aGVHD clinical scores (C) of mice treated with 1 × 106 of fTregs or oIL-2Rβ Tregs and injected with PBS or oIL-2 at a Tcon:Treg ratio of 1:1. Survival curves (D) and aGVHD clinical scores (E) of mice treated with oIL-2Rβ Tregs and injected with oIL-2 or PBS at a Tcon:Treg ratio of 5:1. Data are pooled from 3 independent experiments with a total of 10 to 15 mice per group. Error bars indicate standard error of the mean. P values are indicated when significant; ∗P < .05; ∗∗P < .01; ∗∗∗P < .001; ∗∗∗∗P < .0001. Survival curves were plotted using the Kaplan-Meier method and compared using a log-rank test. HSCT used BM transplantation depleted in T cells. Total body irradiation (TBI) was done without BM transplant. FACS, fluorescence-activated cell sorted; IP, immunoprecipitation; TCD, T cell depleted.
Figure 3.
Figure 3.
Administration of oIL-2 expands oIL-2Rβ Tregs early after allo-HSCT. Expansion of donor oIL-2Rβ Tregluc+ cells in BALB/c recipients. After 8.8 Gy TBI, BALB/c mice received TCD BM + CD45.1+ Foxp3GFP+luc+ Tregs (1 × 106 or 0.2 × 106) that were transduced with oIL-2Rβ. To induce aGVHD, the mice were infused with 1 × 106 of C57BL/6 T cells on day 2. (A-B) Whole-body photons derived from Tregluc+ cells expanding in BALB/c recipients at days 7 and 14 after allo-HSCT. (A) The animals that received oIL-2 protein (n = 10) (top) and those that received PBS (n = 10) (bottom) are shown. (B) Quantification of whole-body photons using the 1:1 (top) and 5:1 (bottom) Tcon:Treg ratio. (C-D) Ex vivo BLI pictures of donor oIL-2Rβ Tregluc+ in the spleen, pLNs, mLNs, and GIT imaging. (C) The animals that received oIL-2 protein (top) and those injected with PBS at different time points after allo-HSCT (bottom) are shown. (D) Mean ± SD of total flux (photons per second [p/s]) obtained from each region of interest. Photons derived from Tregluc+ cells in the spleen (left) and mLNs (right) at days 2, 3, 5, and 7 after allo-HSCT. (E) PB, spleen, pLNs, and mLNs were recovered and analyzed by flow cytometry on day 7 after allo-HSCT. Pooled data from 3 independent experiments including 4 to 5 mice per group per each experiment. ∗P < .05; ∗∗P < .01; ∗∗∗P < .001. Color bar represents signal intensity code over body surface area.
Figure 4.
Figure 4.
oIL-2 stimulation in oIL-2Rβ Tregs reveals upregulation of transcripts involved in activation and IL-2/STAT5 signaling during GVHD suppression. (A) Schematic representation of the workflow for the RNA-seq (created with BioRender.com). (B) PCA of transcriptome based on the top DEGs across oIL-2Rβ Tregs treated with oIL-2 (green) or PBS (blue) and tEGFR Tregs treated with oIL-2 (red). (C) Heatmap and hierarchical clustering of the differential expression from all the samples. Genes related with activation and Treg suppression are highlighted. Expression for each gene is scaled across single rows. (D) Volcano plots reveal significant and log2 fold change of transcripts from oIL-2Rβ Tregs treated with oIL-2 compared with PBS (left) or oIL-2 stimulation (right). Vertical dashed lines on volcano plots indicate a fold change of ±1.5; horizontal dashed line indicates an adjusted P = .05. (E) Gene set enrichment analysis of significant upregulated pathways (hallmark) shown in purple of oIL-2Rβ Tregs stimulated with oIL-2 compared with those stimulated with PBS. (F) The expression levels of different activator markers (CD62L, PD1, KLRG1, CD103, ICOS, and Lag3) on the FoxP3+ CD4+ GFP+ population were analyzed 7 days after allo-HSCT on cells in the spleen and mLNs. Pooled data from 3 independent experiments including 4 to 5 mice per group per each experiment. ∗P < .05; ∗∗P < .01; and ∗∗∗P < .001 between indicated groups. Student t test with Bonferroni correction for multiple comparisons was used for statistical analysis. FC, fold change; padj, adjusted P value.
Figure 4.
Figure 4.
oIL-2 stimulation in oIL-2Rβ Tregs reveals upregulation of transcripts involved in activation and IL-2/STAT5 signaling during GVHD suppression. (A) Schematic representation of the workflow for the RNA-seq (created with BioRender.com). (B) PCA of transcriptome based on the top DEGs across oIL-2Rβ Tregs treated with oIL-2 (green) or PBS (blue) and tEGFR Tregs treated with oIL-2 (red). (C) Heatmap and hierarchical clustering of the differential expression from all the samples. Genes related with activation and Treg suppression are highlighted. Expression for each gene is scaled across single rows. (D) Volcano plots reveal significant and log2 fold change of transcripts from oIL-2Rβ Tregs treated with oIL-2 compared with PBS (left) or oIL-2 stimulation (right). Vertical dashed lines on volcano plots indicate a fold change of ±1.5; horizontal dashed line indicates an adjusted P = .05. (E) Gene set enrichment analysis of significant upregulated pathways (hallmark) shown in purple of oIL-2Rβ Tregs stimulated with oIL-2 compared with those stimulated with PBS. (F) The expression levels of different activator markers (CD62L, PD1, KLRG1, CD103, ICOS, and Lag3) on the FoxP3+ CD4+ GFP+ population were analyzed 7 days after allo-HSCT on cells in the spleen and mLNs. Pooled data from 3 independent experiments including 4 to 5 mice per group per each experiment. ∗P < .05; ∗∗P < .01; and ∗∗∗P < .001 between indicated groups. Student t test with Bonferroni correction for multiple comparisons was used for statistical analysis. FC, fold change; padj, adjusted P value.
Figure 5.
Figure 5.
oIL-2Rβ Treg and oIL-2 system reduces donor T-cell expansion and activation in vivo. (A) In vivo BLI data of Tconsluc+ from representative animals at day 3 (left) and 6 (right) after transplantation. (B) Quantification of Tconsluc+ luminescence from each mouse (p/s) per group (n = 5). (C) Absolute number of donor (H-2kb) CD4+ and CD8+ CD45.2+ cells in lymphoid tissues and spleen following transplantation. RNA-seq analysis of CD8+ (D) and CD4+ (E) Tcons recovered at day 7 after HSCT from animals treated with the indicated oIL-2Rβ (untreated, black; PBS, blue; oIL-2, green; tEGFR Treg + oIL-2, red.). (D-E) PCA of the transcriptome based on the top 1000 DEGs across all samples. (F) Proportion among CD4+ and CD8+ of naïve (CD44CD62L+), central memory (CD44+CD62L+), and effector memory T cells (CD44+CD62L) in the spleen of animals without (aGVHD) and with oIL-2Rβ Tregs treated with PBS and oIL-2 after day 7 following allo-HSCT and treatment. (G) Mean ± SD of the MFI of ICOS in the CD4+CD45.2+ Tcons (left) and CD8+CD45.2+ Tcons (right) in the spleen. Pooled data from 3 independent experiments including 4 to 5 mice per group per each experiment. ∗P < .05; ∗∗P < .01; ∗∗∗P < .001; and ∗∗∗∗P < .001 between indicated groups. Student t test with Bonferroni correction for multiple comparisons was used for statistical analysis.
Figure 5.
Figure 5.
oIL-2Rβ Treg and oIL-2 system reduces donor T-cell expansion and activation in vivo. (A) In vivo BLI data of Tconsluc+ from representative animals at day 3 (left) and 6 (right) after transplantation. (B) Quantification of Tconsluc+ luminescence from each mouse (p/s) per group (n = 5). (C) Absolute number of donor (H-2kb) CD4+ and CD8+ CD45.2+ cells in lymphoid tissues and spleen following transplantation. RNA-seq analysis of CD8+ (D) and CD4+ (E) Tcons recovered at day 7 after HSCT from animals treated with the indicated oIL-2Rβ (untreated, black; PBS, blue; oIL-2, green; tEGFR Treg + oIL-2, red.). (D-E) PCA of the transcriptome based on the top 1000 DEGs across all samples. (F) Proportion among CD4+ and CD8+ of naïve (CD44CD62L+), central memory (CD44+CD62L+), and effector memory T cells (CD44+CD62L) in the spleen of animals without (aGVHD) and with oIL-2Rβ Tregs treated with PBS and oIL-2 after day 7 following allo-HSCT and treatment. (G) Mean ± SD of the MFI of ICOS in the CD4+CD45.2+ Tcons (left) and CD8+CD45.2+ Tcons (right) in the spleen. Pooled data from 3 independent experiments including 4 to 5 mice per group per each experiment. ∗P < .05; ∗∗P < .01; ∗∗∗P < .001; and ∗∗∗∗P < .001 between indicated groups. Student t test with Bonferroni correction for multiple comparisons was used for statistical analysis.
Figure 6.
Figure 6.
oIL-2Rβ Tregs home to the GIT and potently suppress activated Tcons. BALB/c mice underwent transplantation with C57BL/6 BM and Tcons to induce aGVHD (n = 5) and were treated with oIL-2Rβ Tregs with daily injections of either PBS (n = 5) or oIL-2 (n = 5). The large intestine was harvested on day 14 for flow cytometry analysis. Data are representative of 2 independent experiments. Frequency (left) and absolute number (right) of INFγ+ CD4+ (A) and CD8+ (B) T cells. Frequency (left) and absolute number (right) of TNFα+ CD4+ (C) and CD8+ (D) T cells. (E) Concentration of TNFα and INFγ+ in PB on day 14 after allo-HSCT. (F) aGVHD pathology scores of the large intestine (LI) on day 14 after allo-HSCT (left). Representative histological images of the colon at original magnification ×10 following hematoxylin and eosin staining (right). Student t test with Bonferroni correction for multiple comparisons was used for statistical analysis. Error bars indicate the SD of the mean. ∗P < .05; ∗∗P < .01; ∗∗∗P < .001; ∗∗∗∗P < .0001.
Figure 7.
Figure 7.
oIL-2Rβ Tregs maintain graft-versus-leukemia response. (A-C) Tumor growth and elimination (A-B) and survival (C) are shown for the BALB/c mice injected with A20luc/yfp+ (2 × 105) leukemia cells at the time of TCD BM transplantation with or without (purple) oIL-2Rβ Tregs and treated with oIL-2 (green) or PBS (blue). Tcon cells were administered 2 days after allo-BMT at a ratio of 5:1 (Tcon:Treg). (D) Frequency of enhanced GFP+ MLL-AF9 cells in the PB at various time points after allo-HSCT. Student t test with Bonferroni correction for multiple comparisons was used for statistical analysis. Log-rank test was used to analyze survival curves. Error bars indicate the SD of the mean. ∗P < .05; ∗∗P < .01; ∗∗∗P < .001; ∗∗∗∗P < .0001. Results are pooled from 4 independent experiments with a total of 5 mice per group (oIL-2, n = 20; PBS, n = 21). Survival curves were plotted using the Kaplan-Meier method and compared using a log-rank test. allo-BMT, allogeneic bone marrow transplantation.

Comment in

References

    1. Blazar BR, Hill GR, Murphy WJ. Dissecting the biology of allogeneic HSCT to enhance the GvT effect whilst minimizing GvHD. Nat Rev Clin Oncol. 2020;17(8):475–492. - PMC - PubMed
    1. Wingard JR, Majhail NS, Brazauskas R, et al. Long-term survival and late deaths after allogeneic hematopoietic cell transplantation. J Clin Oncol. 2011;29(16):2230–2239. - PMC - PubMed
    1. Zeiser R, Blazar BR. Acute graft-versus-host disease - biologic process, prevention, and therapy. N Engl J Med. 2017;377(22):2167–2179. - PMC - PubMed
    1. Hill L, Alousi A, Kebriaei P, Mehta R, Rezvani K, Shpall E. New and emerging therapies for acute and chronic graft versus host disease. Ther Adv Hematol. 2018;9(1):21–46. - PMC - PubMed
    1. Lucca LE, Dominguez-Villar M. Modulation of regulatory T cell function and stability by co-inhibitory receptors. Nat Rev Immunol. 2020;20(11):680–693. - PubMed

Publication types