. 2023 Mar;82(3):403-415.
doi: 10.1136/ard-2022-223227. Epub 2022 Dec 23.

Senescent cell population with ZEB1 transcription factor as its main regulator promotes osteoarthritis in cartilage and meniscus

Affiliations

Senescent cell population with ZEB1 transcription factor as its main regulator promotes osteoarthritis in cartilage and meniscus

Hannah Swahn et al. Ann Rheum Dis. 2023 Mar.

Abstract

Objectives: Single-cell level analysis of articular cartilage and meniscus tissues from human healthy and osteoarthritis (OA) knees.

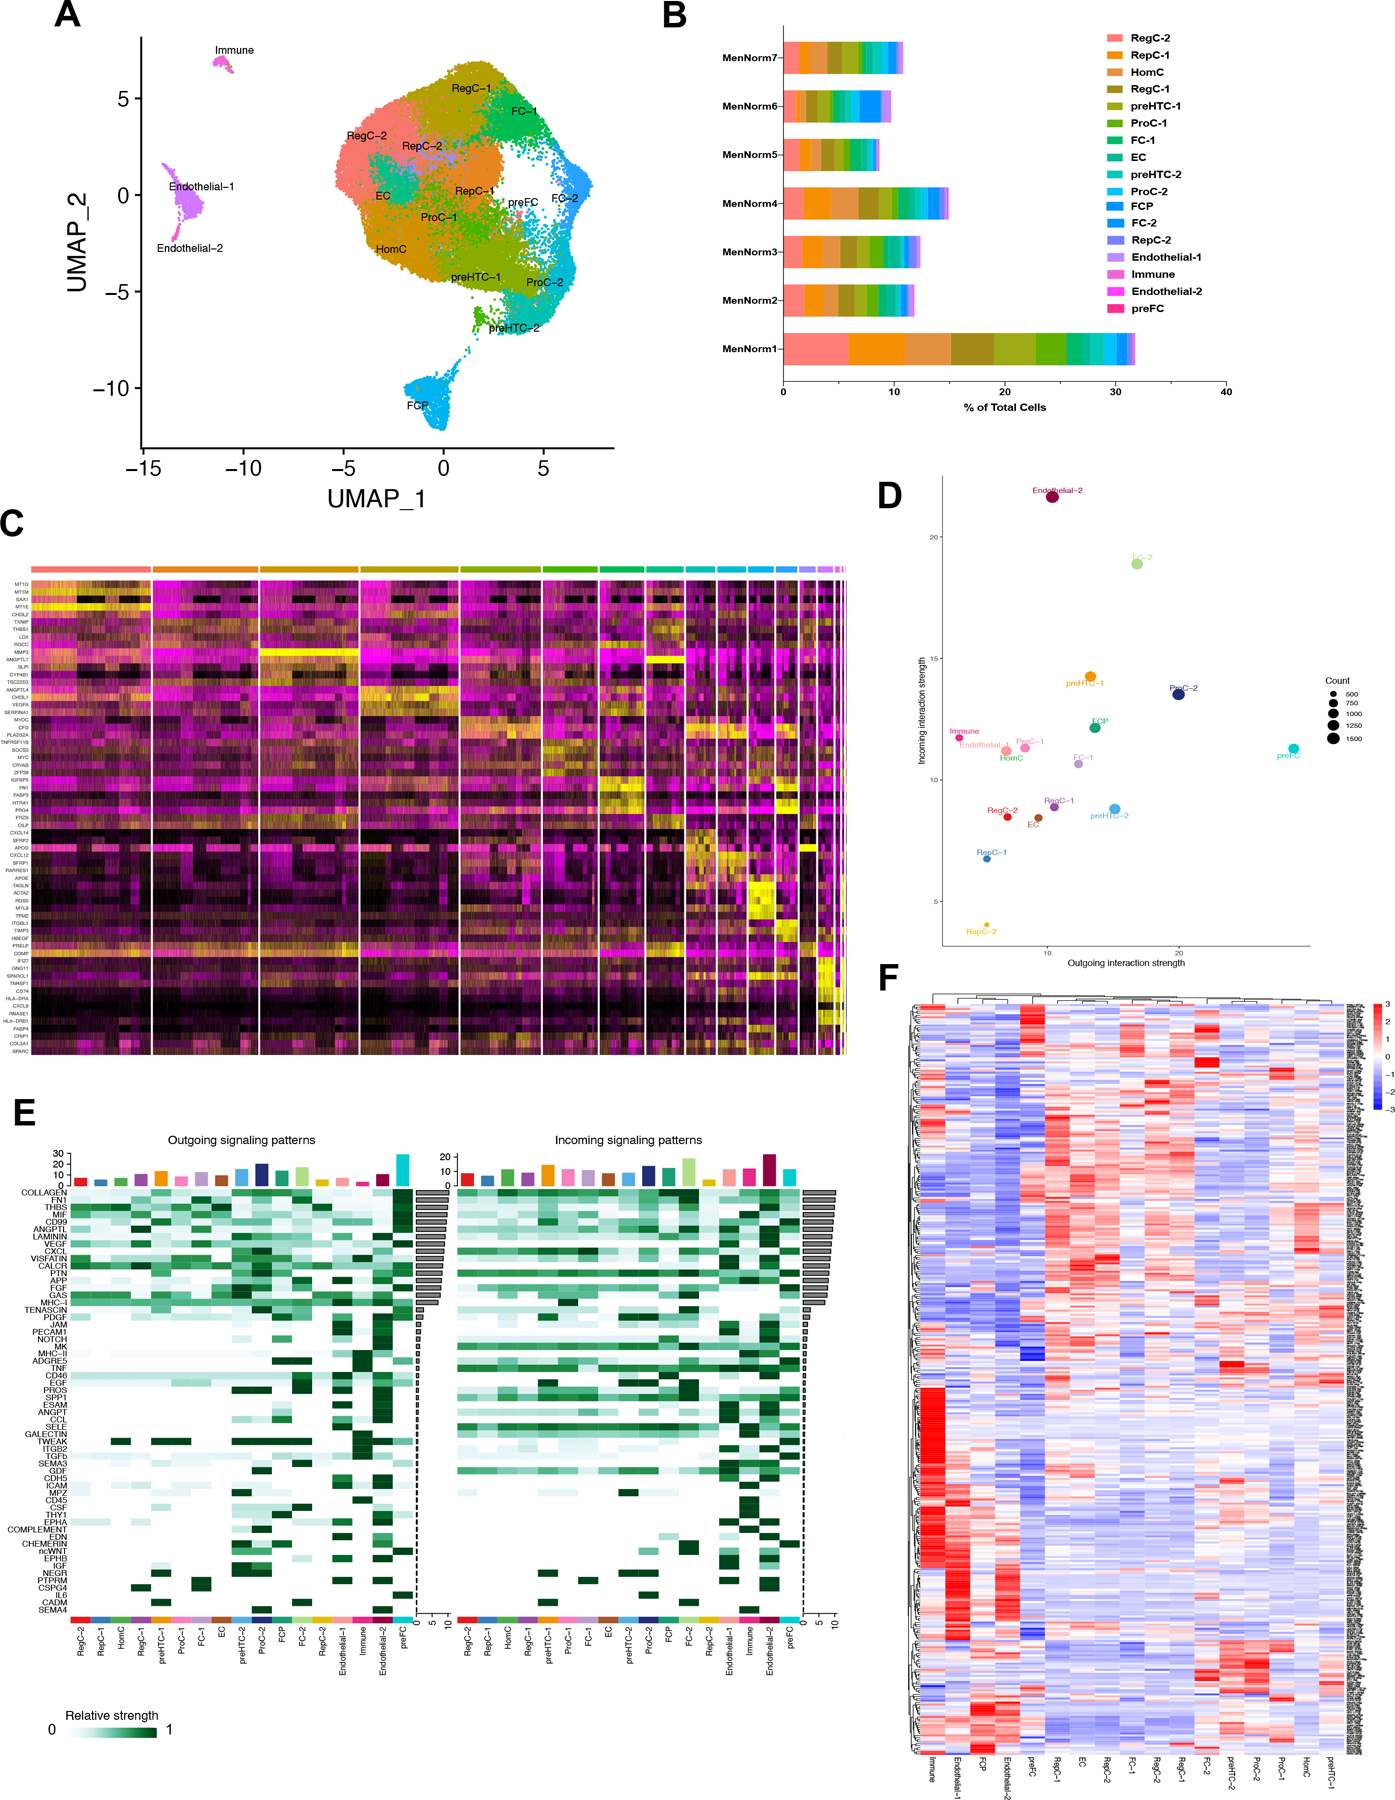
Methods: Single-cell RNA sequencing (scRNA-seq) analyses were performed on articular cartilage and meniscus tissues from healthy (n=6, n=7) and OA (n=6, n=6) knees. Expression of genes of interest was validated using immunohistochemistry and RNA-seq and function was analysed by gene overexpression and depletion.

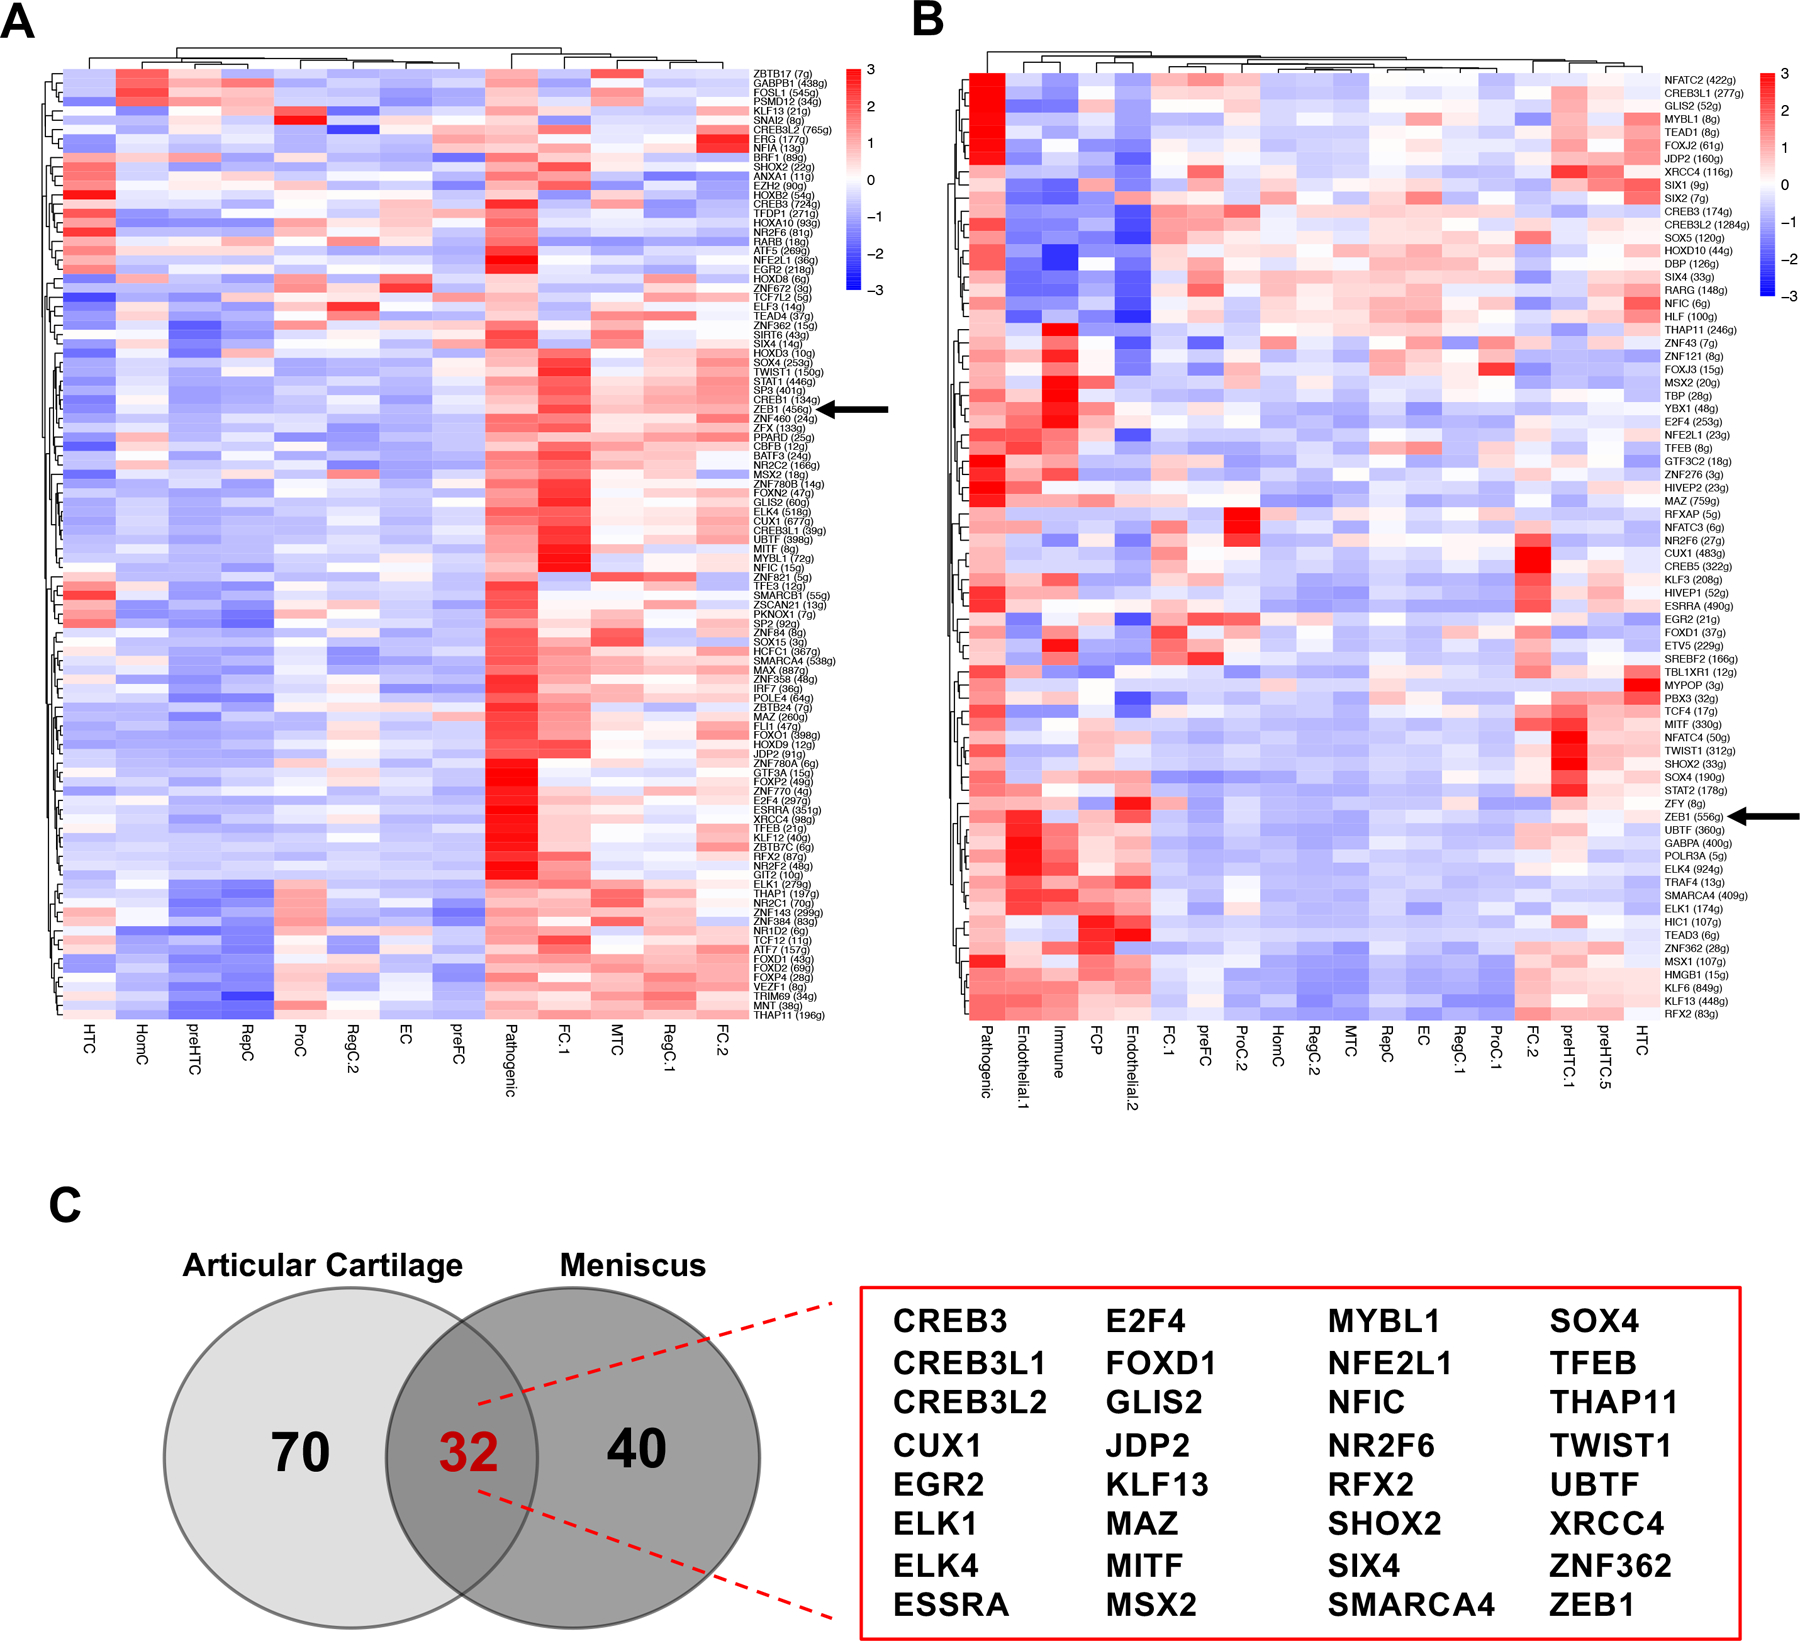
Results: scRNA-seq analyses of human knee articular cartilage (70 972 cells) and meniscus (78 017 cells) identified a pathogenic subset that is shared between both tissues. This cell population is expanded in OA and has strong OA and senescence gene signatures. Further, this subset has critical roles in extracellular matrix (ECM) and tenascin signalling and is the dominant sender of signals to all other cartilage and meniscus clusters and a receiver of TGFβ signalling. Fibroblast activating protein (FAP) is also a dysregulated gene in this cluster and promotes ECM degradation. Regulons that are controlled by transcription factor ZEB1 are shared between the pathogenic subset in articular cartilage and meniscus. In meniscus and cartilage cells, FAP and ZEB1 promote expression of genes that contribute to OA pathogenesis, including senescence.

Conclusions: These single-cell studies identified a senescent pathogenic cell cluster that is present in cartilage and meniscus and has FAP and ZEB1 as main regulators which are novel and promising therapeutic targets for OA-associated pathways in both tissues.

Keywords: arthritis; chondrocytes; osteoarthritis.


Conflict of interest statement

Competing interests: None declared.

Figures

Figure 1.
Figure 1.. Single-cell RNA sequencing of healthy human articular cartilage.
(A) Visualization of clustering by UMAP plot of healthy articular cartilage samples. (B) Quantification of individual donor contribution to each cluster shown as percentage of total cell count of the integrated data set. (C) Top 5 markers for each cluster as visualized in a heat-map. (D) CellChat analysis was performed to interrogate cell-cell communication patterns between clusters in articular cartilage. Overall outgoing and incoming signal strength of each cluster was visualized in a scatter plot. (E) Relative strength of all enriched signals (outgoing and incoming) across articular cartilage clusters was visualized in a heat-map. (F) pySCENIC analysis revealed enriched regulons (TF and all promoter-bound gene targets) across all healthy articular cartilage clusters. Relative regulon activity (AUC score) is shown for each regulon for each cluster in a heat-map. (G-H) Heat-maps showing active regulons (AUC > 1) in FC-1 (G), FC-2 (I) and HTC (H). (J) Intersection of active regulons between FC-1, FC-2 and HTC. For all panels: RegC: regulatory chondrocytes, EC: effector chondrocytes, preFC: pre-fibrocartilage chondrocytes, FC: fibrocartilage chondrocytes, preHTC: pre-hypertrophic chondrocytes, HTC: hypertrophic chondrocytes, HomC: homeostatic chondrocytes and RepC: reparative chondrocytes.
Figure 2.
Figure 2.. Single-cell RNA sequencing of healthy human meniscus.
(A) Visualization of clustering by UMAP plot of healthy meniscus samples. (B) Quantification of individual donor contribution to each cluster shown as percentage of total cell count of the integrated data set. (C) Top 5 markers for each cluster as visualized in a heat-map. (D) CellChat analysis was performed to interrogate cell-cell communication patterns between clusters in articular cartilage. Overall outgoing and incoming signal strength of each cluster was visualized in a scatter plot. (E) Relative strength of all enriched signals (outgoing and incoming) across meniscus clusters was visualized in a heat-map. (F) pySCENIC analysis revealed enriched regulons (TF and all promoter-bound gene targets) across all healthy meniscus clusters. Relative regulon activity (AUC score) is shown for each regulon for each cluster in a heat-map. For all panels: RegC: regulatory chondrocytes, EC: effector chondrocytes, preFC: pre-fibrocartilage chondrocytes, FC: fibrocartilage chondrocytes, ProC: proliferative chondrocytes, preHTC: pre-hypertrophic chondrocytes, HomC: homeostatic chondrocytes, RepC: reparative chondrocytes and FCP: fibrocartilage progenitors.
Figure 3.
Figure 3.. Identification of a pathogenic population in OA articular cartilage.
(A) Visualization of clustering by UMAP plot of integrated normal (n=6) and OA (n=6) articular cartilage samples. (B) Identification of a pathogenic population in OA cartilage (black boxes) by visualization of UMAP plot split by condition (normal vs OA). (C, D) Milo analysis revealed differential abundance of cell neighborhoods in OA compared to normal (blue boxes) in the pathogenic subset. (E) An OA gene signature score was assigned to each cell in the integrated dataset and the scores visualized on a violin plot split by cluster. (F) Significant expression of POSTN in the pathogenic subset as shown by UMAP plot. (G) Expression of senescence genes (core, associated and SASP) in all clusters split by condition was visualized in bubble plots. Intensity of the color (blue and red) represents relative expression of a gene. Size of the bubble represents the percentage of cells in the cluster expressing the gene. (H, I) GO analysis showing biological processes downregulated (H) and upregulated (I) in the pathogenic subset using gProfiler.
Figure 4.
Figure 4.. Identification of a pathogenic population in OA meniscus.
(A) Visualization of clustering by UMAP plot of integrated normal (n=7) and OA (n=6) meniscus samples. (B) Identification of a pathogenic population in OA meniscus (black boxes) by visualization of UMAP plot split by condition (normal vs OA). (C, D) Milo analysis revealed differential abundance of cell neighborhoods in OA compared to normal (blue boxes) in the pathogenic subset. (E) An OA gene signature score was assigned to each cell in the integrated dataset and the scores visualized on a violin plot split by cluster. (F) Significant expression of POSTN in the pathogenic subset as shown by UMAP plot. (G) Expression of senescence genes (core, associated and SASP) in all clusters split by condition was visualized in bubble plots. Intensity of the color (blue and red) represents relative expression of a gene. Size of the bubble represents the percentage of cells in the cluster expressing the gene. (H, I) GO analysis showing biological processes downregulated (H) and upregulated (I) in the pathogenic subset using gProfiler.
Figure 5.
Figure 5.. FAP promotes OA pathogenesis genes, including MMP9 and IL6.
(A) Violin plots showing upregulation of FAP expression in OA compared to normal across all clusters (upper) and specifically in the pathogenic cluster (lower) in articular cartilage. (B, C) IHC and quantification of FAP protein in OA compared to normal in articular cartilage. Error bars are standard deviation, n=6. Black arrows indicate positive cells. (D) Violin plots showing upregulation of FAP expression in OA compared to normal across all clusters (upper) and specifically in the pathogenic cluster (lower) in meniscus. (E, F) IHC and quantification of FAP protein in OA compared to normal in meniscus. Error bars are standard deviation, n=6. Black arrows indicate positive cells. (G) DESeq2 normalized read counts for FAP in FAP-activated TC28a2 cells (n=3) compared to vector control cells (n=3). (H) Volcano plot showing significantly downregulated (blue) and upregulated (red) genes in FAP-activated TC28a2 cells compared to control cells. DEGs were filtered by adjusted p value < 0.05. GO analysis showing biological processes downregulated (I) and upregulated (J) in FAP activation. (K) RT-qPCR showing expression of ACAN, COL2A1, MMP2, MMP9 and IL6 in FAP-activated TC28a2 cells compared to vector control. (L) RT-qPCR as in (K) in ZEB1-depleted TC28a2 cells using shRNA. (M-P) RT-qPCR as in (K) in FAP-activated primary healthy articular cartilage (M) healthy meniscus (O), OA articular cartilage (N) and OA meniscus (P) cells. As indicated in each panel, data are relative to GAPDH and normalized to vector control or NTC shRNA. Error bars are standard deviation, n=9 (n=3 biological replicates, n=3 technical replicates/biological replicate). For all panels: *p<0.05, **p<0.01, ***p<0.001, ****p<0.0001 by multiple unpaired Student’s t tests.
Figure 6.
Figure 6.. The pathogenic subset is a critical regulator of collagen, TGFβ and tenascin signaling in OA articular cartilage and meniscus.
(A, I) Number of signaling interactions occurring between all clusters in articular cartilage (A) and meniscus (I). (B, J) Overall outgoing and incoming signal strength of each cluster in articular cartilage (B) and meniscus (J) as visualized in scatter plots. (C, K) Relative strength of all enriched signals (outgoing and incoming) across articular cartilage (C) and meniscus (K) clusters as visualized in heat maps. (D) Scale for the role importance of each cluster in the four CellChat centrality measures (S: sender, R: receiver, M: mediator and I: influencer). (E, F, G, L, M, N) Circle plots showing direction and heat maps showing role importance in the four centrality measures in collagen (E, L), TGFβ (F, M) and tenascin (G, N) signaling pathways in all clusters in articular cartilage (E, F, G) and meniscus (L, M, N). (H, O) Significance of each L-R signaling interaction comprising “tenascin” signaling network in articular cartilage (H) and meniscus (O). The pathogenic subset was set as the source of the signal in this analysis.
Figure 7.
Figure 7.. Identification of shared dysregulated TFs in the pathogenic subset in both tissue types.
(A, B) pySCENIC analysis revealed enriched regulons (> 0.5) in the pathogenic subset in articular cartilage (102 regulons) (A) and meniscus (72 regulons) (B). ZEB1 regulon is marked by black arrows. (C) 32 regulons were shared in this subset between both tissue types.
Figure 8.
Figure 8.. ZEB1 promotes mitochondrial dysregulation and p16-induced cell senescence.
(A) Violin plots showing upregulation of ZEB1 expression in OA compared to normal across all clusters (left) and specifically in the pathogenic cluster (right) in articular cartilage. (B, C) IHC and quantification of ZEB1 protein in OA compared to normal in articular cartilage. ZEB1 protein in OA-affected area (OA) and normal-appearing area (OA-N) from the same OA donor are shown. Error bars are standard deviation, n=6. *p<0.05, **p<0.01 by One-Way ANOVA test with multiple comparisons. (D) Violin plots showing upregulation of ZEB1 expression in OA compared to normal across all clusters (left) and specifically in the pathogenic cluster (right) in meniscus. (E) DESeq2 normalized read counts for ZEB1 in ZEB1-activated TC28a2 cells (n=3) compared to vector control cells (n=3). (F) Volcano plot showing significantly downregulated (blue) and upregulated (red) genes in ZEB1 activated TC28a2 cells compared to control cells. DEGs were filtered by adjusted p value < 0.05. GO analysis showing biological processes downregulated (G) and upregulated (H) in ZEB1 activation using gProfiler. (I) RT-qPCR showing expression of CDKN1A, CDKN2A, RELA, MMP2, MMP9, IL6 and SERPINE1 in ZEB1-activated TC28a2 cells compared to vector control. (J, K) RT-qPCR as in (I) in ZEB1-depleted TC28a2 cells using shRNA (J) and CRISPRi (K). (L, M) RT-qPCR as in (I) in ZEB1-activated primary articular cartilage (L) and primary meniscus (M) cells. As indicated in each panel, data are relative to either GAPDH, or the geometric mean of three housekeeping genes (HKG; GAPDH, PGK1 and β2M) and normalized to vector control or NTC shRNA. Error bars are standard deviation, n=9 (n=3 biological replicates, n=3 technical replicates/biological replicate). For all panels: *p<0.05, **p<0.01, ***p<0.001, ****p<0.0001 by multiple unpaired Student’s t tests.

References

    1. Katz JN, Arant KR, Loeser RF. Diagnosis and Treatment of Hip and Knee Osteoarthritis: A Review. JAMA 2021;325(6):568–78. doi: 10.1001/jama.2020.22171 [published Online First: 2021/02/10] - DOI - PMC - PubMed
    1. Latourte A, Kloppenburg M, Richette P. Emerging pharmaceutical therapies for osteoarthritis. Nat Rev Rheumatol 2020;16(12):673–88. doi: 10.1038/s41584-020-00518-6 [published Online First: 2020/10/31] - DOI - PubMed
    1. Brophy RH, Huston LJ, Briskin I, et al. Articular Cartilage and Meniscus Predictors of Patient-Reported Outcomes 10 Years After Anterior Cruciate Ligament Reconstruction: A Multicenter Cohort Study. Am J Sports Med 2021;49(11):2878–88. doi: 10.1177/03635465211028247 [published Online First: 2021/07/30] - DOI - PMC - PubMed
    1. Sukopp M, Schall F, Hacker SP, et al. Influence of Menisci on Tibiofemoral Contact Mechanics in Human Knees: A Systematic Review. Front Bioeng Biotechnol 2021;9:765596. doi: 10.3389/fbioe.2021.765596 [published Online First: 2021/12/21] - DOI - PMC - PubMed
    1. Ozeki N, Koga H, Sekiya I. Degenerative Meniscus in Knee Osteoarthritis: From Pathology to Treatment. Life (Basel) 2022;12(4) doi: 10.3390/life12040603 [published Online First: 2022/04/24] - DOI - PMC - PubMed

Publication types

MeSH terms

Substances

LinkOut - more resources