. 2023 May;82(5):658-669.
doi: 10.1136/ard-2022-223469. Epub 2022 Dec 23.

Role of CD14+ monocyte-derived oxidised mitochondrial DNA in the inflammatory interferon type 1 signature in juvenile dermatomyositis

Affiliations

Role of CD14+ monocyte-derived oxidised mitochondrial DNA in the inflammatory interferon type 1 signature in juvenile dermatomyositis

Meredyth G Ll Wilkinson et al. Ann Rheum Dis. 2023 May.

Abstract

Objectives: To define the host mechanisms contributing to the pathological interferon (IFN) type 1 signature in Juvenile dermatomyositis (JDM).

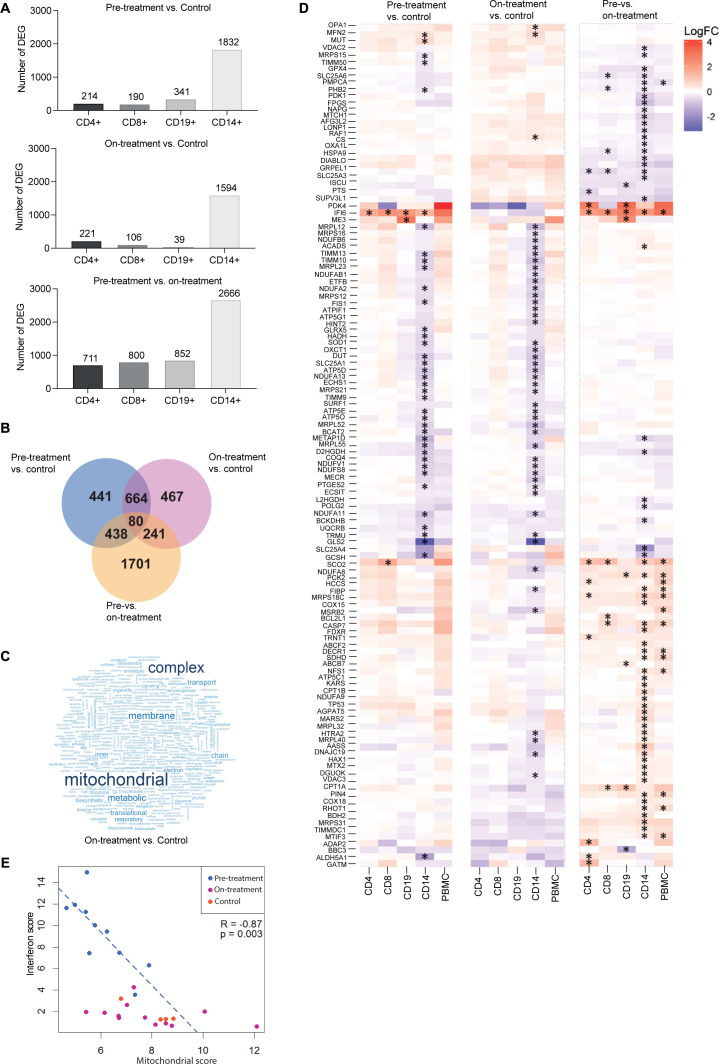
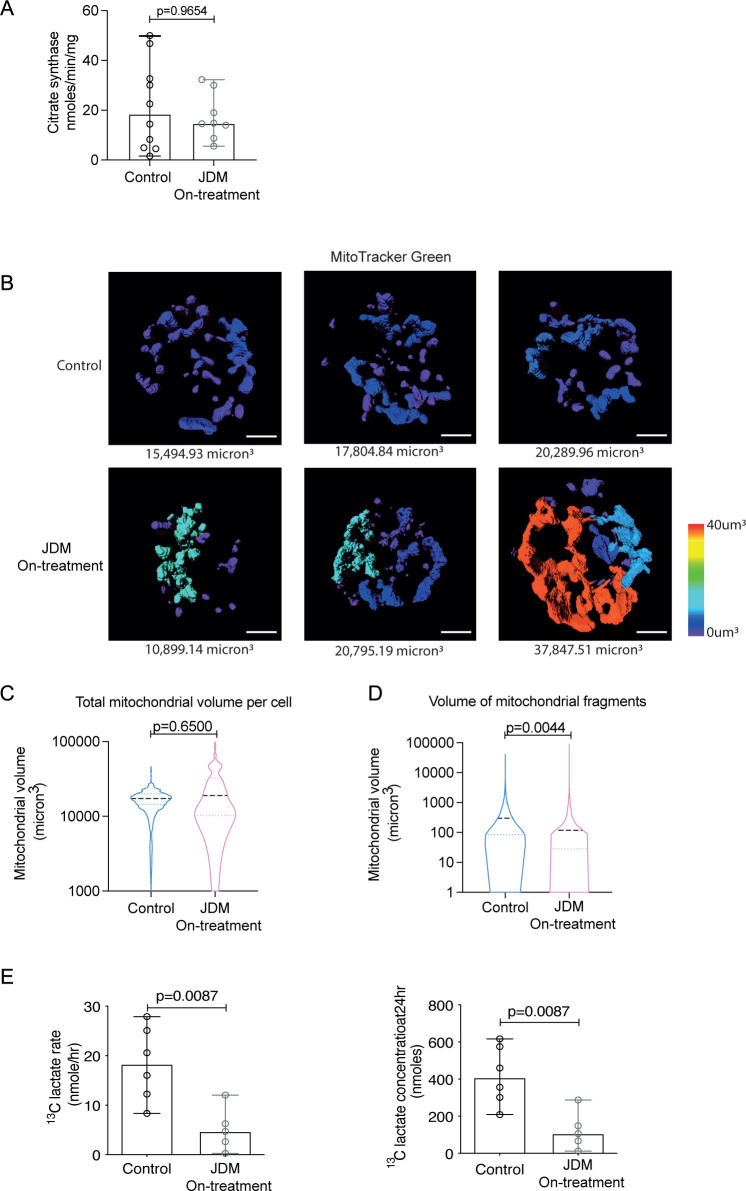
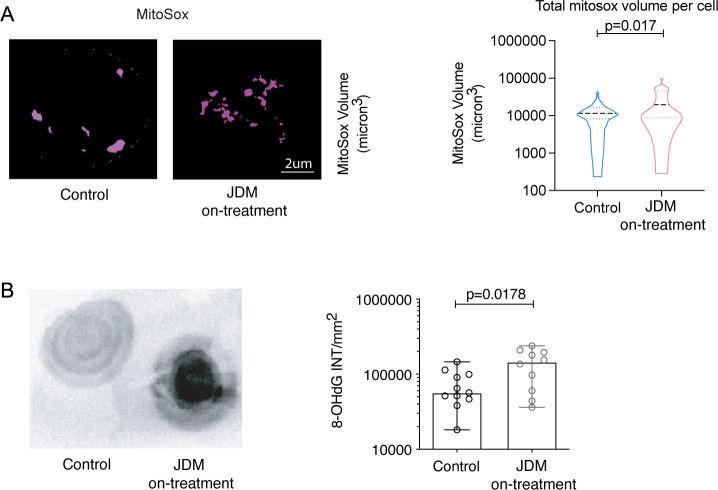
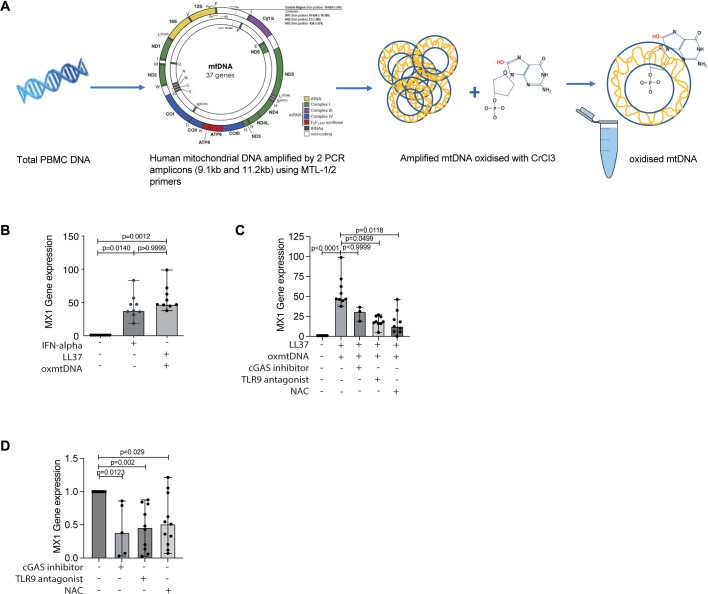
Methods: RNA-sequencing was performed on CD4+, CD8+, CD14+ and CD19+ cells sorted from pretreatment and on-treatment JDM (pretreatment n=10, on-treatment n=11) and age/sex-matched child healthy-control (CHC n=4) peripheral blood mononuclear cell (PBMC). Mitochondrial morphology and superoxide were assessed by fluorescence microscopy, cellular metabolism by 13C glucose uptake assays, and oxidised mitochondrial DNA (oxmtDNA) content by dot-blot. Healthy-control PBMC and JDM pretreatment PBMC were cultured with IFN-α, oxmtDNA, cGAS-inhibitor, TLR-9 antagonist and/or n-acetyl cysteine (NAC). IFN-stimulated gene (ISGs) expression was measured by qPCR. Total numbers of patient and controls for functional experiments, JDM n=82, total CHC n=35.

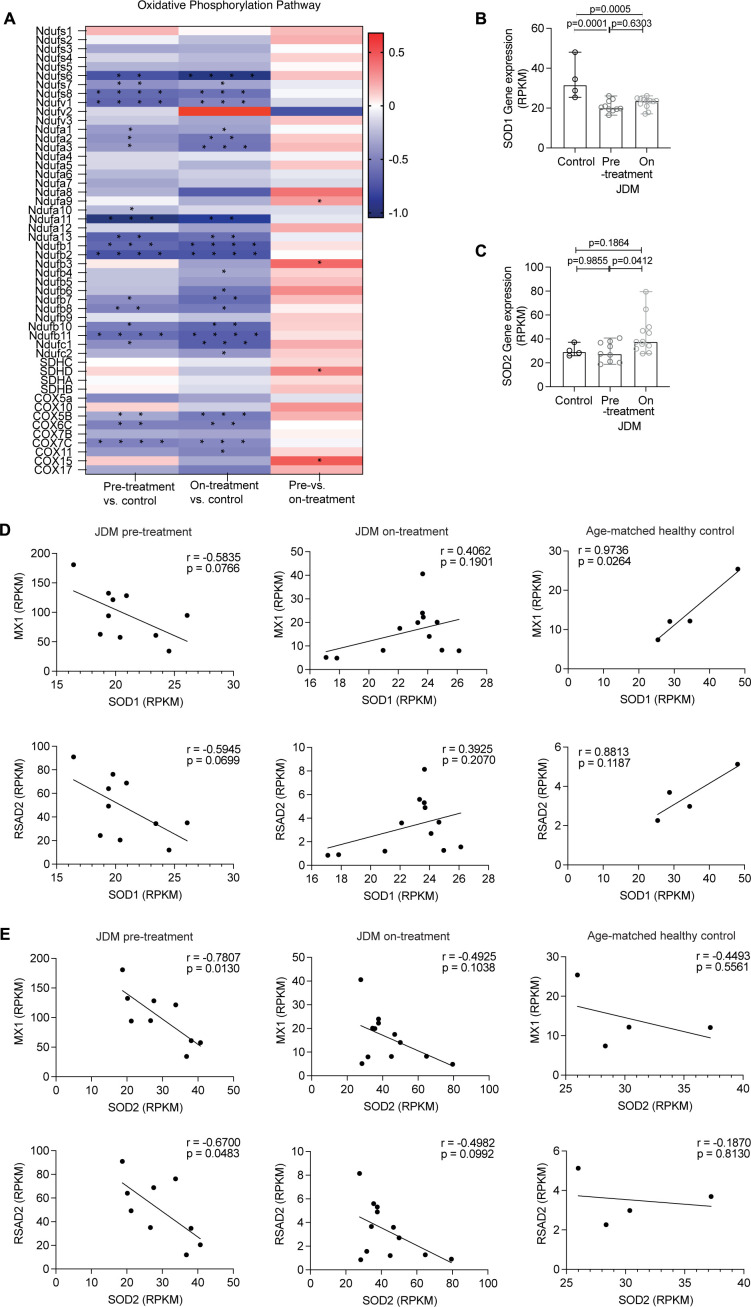
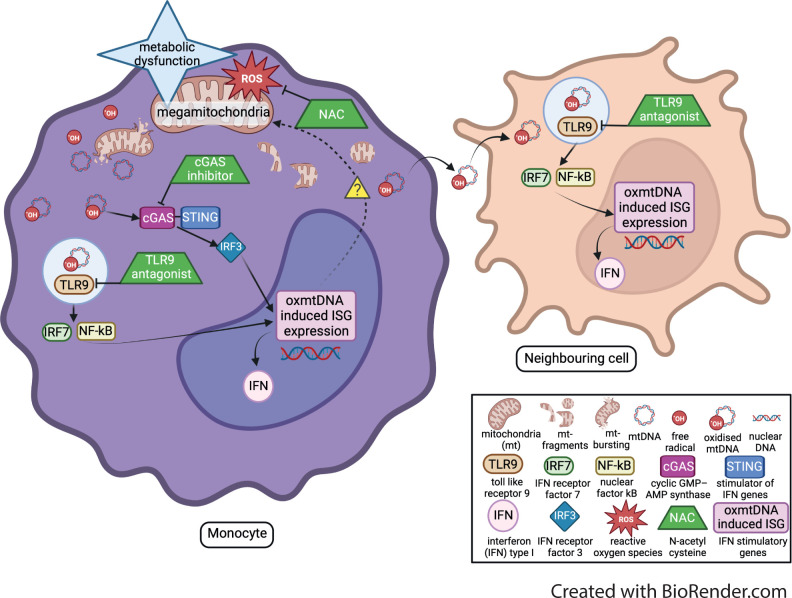
Results: Dysregulated mitochondrial-associated gene expression correlated with increased ISG expression in JDM CD14+ monocytes. Altered mitochondrial-associated gene expression was paralleled by altered mitochondrial biology, including 'megamitochondria', cellular metabolism and a decrease in gene expression of superoxide dismutase (SOD)1. This was associated with enhanced production of oxidised mitochondrial (oxmt)DNA. OxmtDNA induced ISG expression in healthy PBMC, which was blocked by targeting oxidative stress and intracellular nucleic acid sensing pathways. Complementary experiments showed that, under in vitro experimental conditions, targeting these pathways via the antioxidant drug NAC, TLR9 antagonist and to a lesser extent cGAS-inhibitor, suppressed ISG expression in pretreatment JDM PBMC.

Conclusions: These results describe a novel pathway where altered mitochondrial biology in JDM CD14+ monocytes lead to oxmtDNA production and stimulates ISG expression. Targeting this pathway has therapeutical potential in JDM and other IFN type 1-driven autoimmune diseases.

Keywords: Autoimmune Diseases; Dermatomyositis; Inflammation.


Conflict of interest statement

Competing interests: LRW declares a consultancy from Pfizer unrelated to this study but in the field of this disease.

Figures

Figure 1
Figure 1
A dysregulated mitochondrial gene signature characterises CD14+ monocytes from JDM patients. Transcriptomic analysis of CD4+, CD8+, CD19+ and CD14+ cells from JDM patients taken pretreatment (n=10) and ~12 months on-treatment (n=11), and age-matched healthy controls (controls, n=4). (A) Numbers of differentially expressed genes (DEG) within each cell type between JDM pretreatment versus control, on-treatment versus control and pretreatment versus on-treatment. (B) Venn diagram showing the overlap of significantly DEG from CD14+ monocytes between JDM pretreatment versus control, on-treatment versus control and pretreatment versus on-treatment. (C) Word cloud representation of gene ontology analysis of CD14+ monocytes in JDM patients on-treatment compared with controls. (D) Heatmap representing overexpression and underexpression of genes within the ‘mitochondrion’ gene ontology (GO) term. Asterisk indicate significant differential expression. (E) Negative correlation of IFN type 1 score (15 known IFN type 1—stimulated genes) with all 13 mitochondrially encoded genes (protein coding); analysis in JDM patients pretreatment and on-treatment compared with controls. IFN scores against mitochondrial scores are displayed for all samples, but Spearman correlation coefficient and p value shown are for pretreatment JDM samples. JDM, juvenile dermatomyositis.
Figure 2
Figure 2
Changes in mitochondrial morphology are associated with abnormal cellular metabolism in CD14+ monocytes in JDM patients. (A) Bar chart shows citrate synthase rate normalised to protein content in JDM on-treatment (n=8) CD14+ monocytes compared with controls (n=10). (B) Representative images showing the range of mitochondrial fragment size in individual CD14+ monocytes from JDM on-treatment (n=6) and control (n=9). Images are representative for the lowest interquartile range (left), median (central) and highest IQR (right) of total mitochondrial volume per cell from control (top) and JDM (bottom) CD14+ monocytes. (C) Violin plot showing the distribution of total mitochondrial volume (µm3) per cell in JDM on-treatment CD14+ monocytes (n=6) compared with controls (n=9) (D) Violin plot showing the distribution of the individual mitochondrial fragment volume (µm3) from all CD14+ monocytes in JDM on-treatment (n=6) compared with controls (n=9). (E) Bar graphs show 13C labelled glucose metabolism rate (left) and final concentration (right) into lactate in CD14+ monocytes from JDM on-treatment (n=5) and controls (n=6). (A, E) Bar graphs: median with range shown. statistical analysis: (A, E) Non-parametric Mann-Whitney tests, p values. (C, D) Violin plots of distribution with median and IQR. Analysis of the effect of JDM compared with controls as a fixed effect in a linear mixed effects model, with a random effect included to account for individual-specific effects. P values were generated using nested ANOVA. ANOVA, analysis of variance; JDM, juvenile dermatomyositis.
Figure 3
Figure 3
Transcriptional data reveal changes to oxidative phosphorylation and superoxide regulation in JDM CD14+monocytes. (A) Heatmap showing fold change (FC) of differentially expressed genes (DEG) from KEGG oxidative phosphorylation pathway in CD14+ monocytes from JDM patients taken pretreatment (n=10) and ~12 months on-treatment (n=11), and controls (n=4). Red is upregulated (positive Fc) and blue is downregulated (negative Fc), stars represent adjusted p values (*p<0.05, **p<0.01, ***p<0.001, ****p<0.0001). Gene expression analysis of CD14+ monocytes from JDM patients taken pretreatment (n=10) and ~12 months on-treatment (n=11), and age-matched healthy (controls (n=4)). Reads per kilobase pair of transcript (RPKM) gene expression of (B) SOD1 and (C) SOD2. Correlation plots of RPKM gene expression of SOD1 (D) and SOD2 (E), to MX1 and RSAD2 (top to bottom) in CD14+ monocytes from JDM patients taken pretreatment (n=10) (left) and 12 months on-treatment (n=11) (middle) and controls (n=4) (right). All bar graphs: median with range shown. Statistical analysis: (B, C) Non-parametric Kruskal-Wallis test with Dunn’s multiple comparisons, adjusted p values. (D–E) R and p values calculated by Pearson correlation. JDM, juvenile dermatomyositis.
Figure 4
Figure 4
There is enhanced oxidative stress in JDM CD14+ monocytes, which is associated with increased oxidised mitochondrial DNA (oxmtDNA). (A) representative images (left), and violin plot (right) showing MitoSox volume (µm3) per cell in CD14+ monocytes from JDM on-treatment (n=6) compared with controls (n=9). (B) Representative densitometry plots (left) and bar graph (right) of 8-hydroxy-2'-deoxyguanosine (8-OHdG) concentration from isolated CD14+ monocyte-derived mitochondria from JDM on-treatment patients (n=10) and controls (n=11). All bar graphs: median with range shown. (A) Violin plots of distribution with median and IQR. Analysis of the effect of JDM versus healthy control as a fixed effect in a linear mixed effects model, with a random effect included to account for individual-specific effects. P values were generated using nested ANOVA. (B) Non-parametric Mann-Whitney tests, p values. ANOVA, analysis of variance; JDM, juvenile dermatomyositis.
Figure 5
Figure 5
Oxidised mtDNA induces ISGs in vitro which can be blocked by treatment with TLR-9 antagonist and the antioxidant N-acetylcysteine (NAC). (A) Schematic shows methodology for generation of oxidised mtDNA (oxmtDNA). (B) Bar graphs show relative expression of IFN stimulated gene (ISG) Mx1 in control PBMC (n=12) incubated with IFN-alpha, oxmtDNA (with LL-37) or no stimuli (unstim). (C) Bar graphs show relative expression of ISG MX1 in control PBMC incubated with no stimuli, oxmtDNA (+LL-37) (n=12) with or without cGAS inhibitor (n=6), TLR-9 antagonist (ODN TTAGGG(A151)) (n=11) or N-acetylcysteine (NAC) (n=11). (D) Bar graphs show gene expression of ISG MX1 in PBMC from JDM patients pretreatment cultured with or without cGAS inhibitor (n=5), TLR-9 antagonist (n=10), NAC (n=11) or in medium alone (untreated) (n=11). All bar graphs: median with range shown. Statistical analysis: (B–D) Non-parametric Kruskal-Wallis test with Dunn’s multiple comparisons, adjusted p values. JDM, juvenile dermatomyositis; PBMC, peripheral blood mononuclear cell.
Figure 6
Figure 6
Schematic of the proposed mechanism. mitochondria are damaged by reactive oxygen species (ROS) and other mitochondrial stresses, leading to mitochondrial metabolic dysfunction. This dysfunction leads to fragmented mitochondria and the release of mitochondrial (MT) DNA. An increase of superoxide production leads to mtDNA becoming oxidised (ox). This oxmtDNA then activates the cGAS-STING and endosomic TLR9 pathways inducing the upregulation of IFN stimulatory gene (ISG) expression. Potential therapeutic agents (shown as green trapezium symbol), which can block different levels of the mechanism and down regulate oxmtDNA induced ISG expression. These therapeutic agents include the anti-oxidant NAC, which targets oxidative stress, cGAS inhibitor which targets the cGAS-STING pathway, and TLR9 anatagonist which blocks the TLR9 pathway.

References

    1. Meyer A, Meyer N, Schaeffer M, et al. . Incidence and prevalence of inflammatory myopathies: a systematic review. Rheumatology 2015;54:50–63. 10.1093/rheumatology/keu289 - DOI - PubMed
    1. Rider LG, Nistala K. The juvenile idiopathic inflammatory myopathies: pathogenesis, clinical and autoantibody phenotypes, and outcomes. J Intern Med 2016;280:24–38. 10.1111/joim.12444 - DOI - PMC - PubMed
    1. Nistala K, Wedderburn LR. Update in juvenile myositis. Curr Opin Rheumatol 2013;25:742–6. 10.1097/01.bor.0000434674.62644.02 - DOI - PMC - PubMed
    1. Dalakas MC. Mechanisms of disease: signaling pathways and immunobiology of inflammatory myopathies. Nat Clin Pract Rheumatol 2006;2:219–27. 10.1038/ncprheum0140 - DOI - PubMed
    1. Tansley SL, Betteridge ZE, Shaddick G, et al. . Calcinosis in juvenile dermatomyositis is influenced by both anti-NXP2 autoantibody status and age at disease onset. Rheumatology 2014;53:2204–8. 10.1093/rheumatology/keu259 - DOI - PMC - PubMed

Publication types