. 2023 Jan;24(1):174-185.
doi: 10.1038/s41590-022-01366-0. Epub 2022 Dec 23.

Unique roles of co-receptor-bound LCK in helper and cytotoxic T cells

Affiliations

Unique roles of co-receptor-bound LCK in helper and cytotoxic T cells

Veronika Horkova et al. Nat Immunol. 2023 Jan.

Abstract

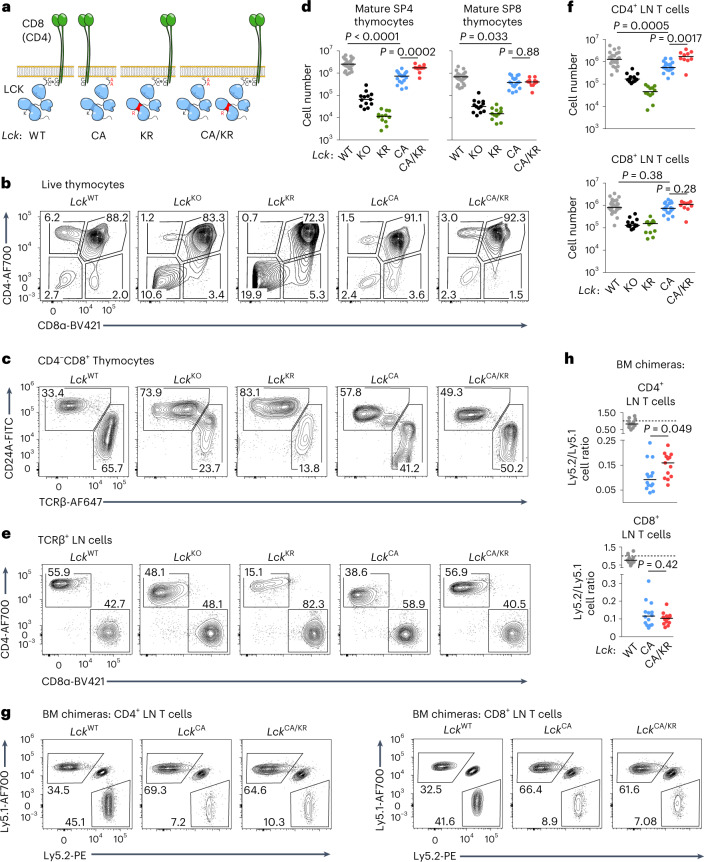
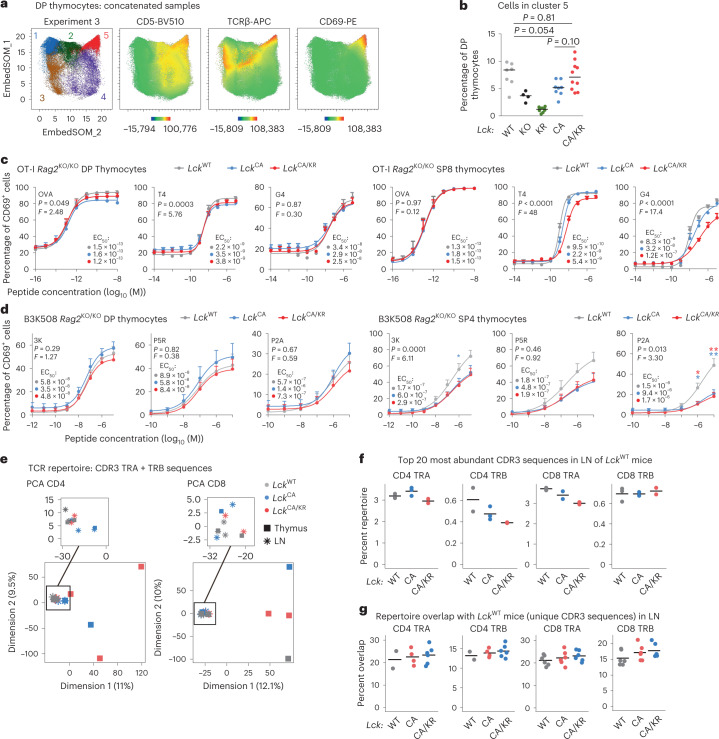
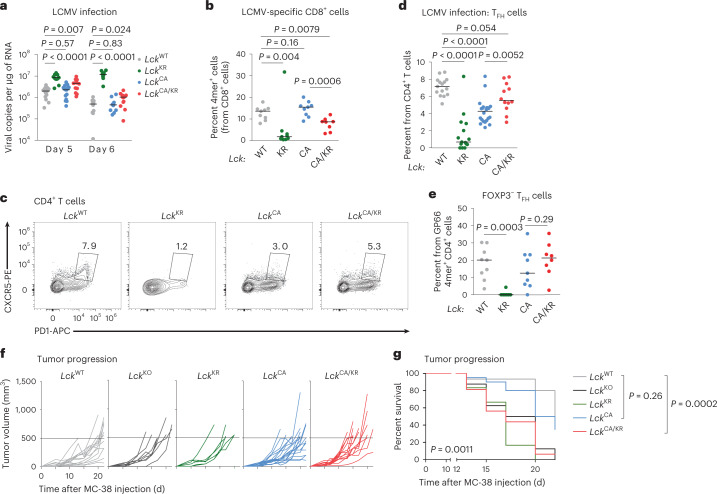
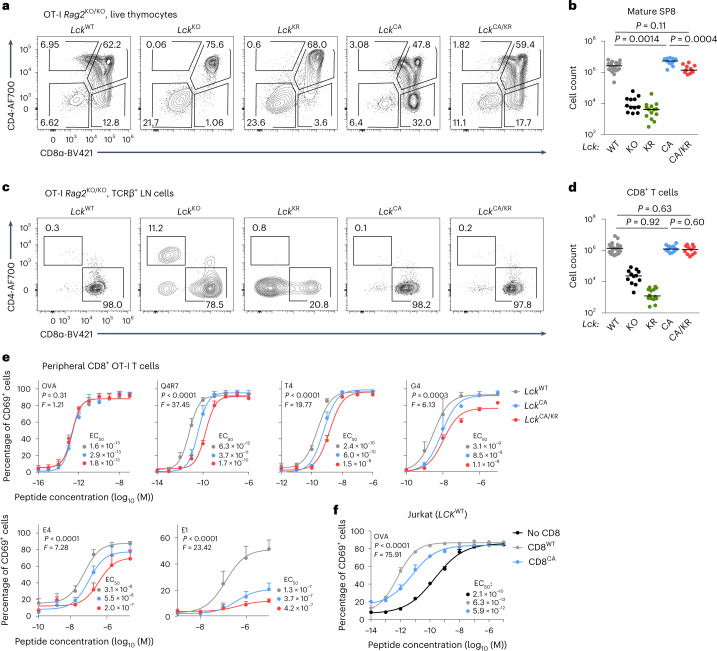
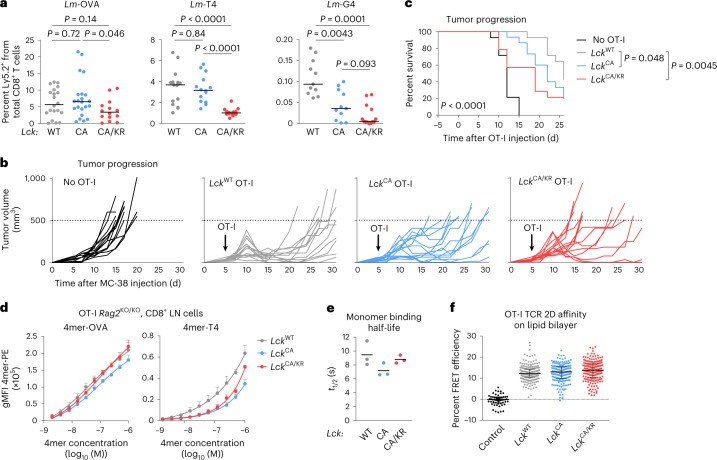
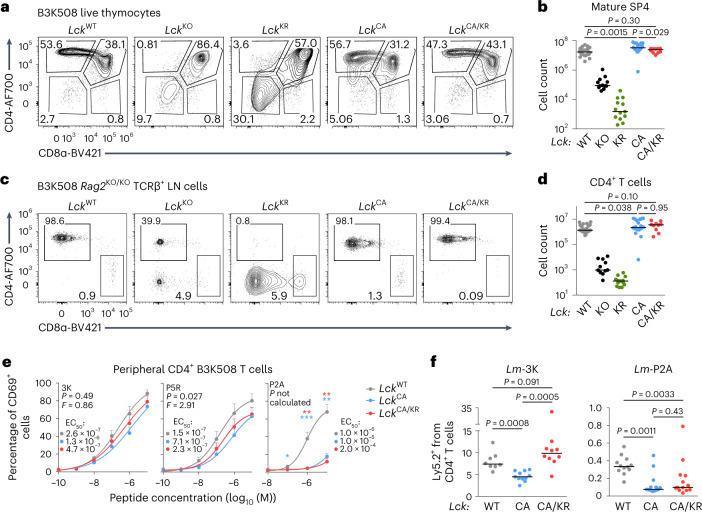
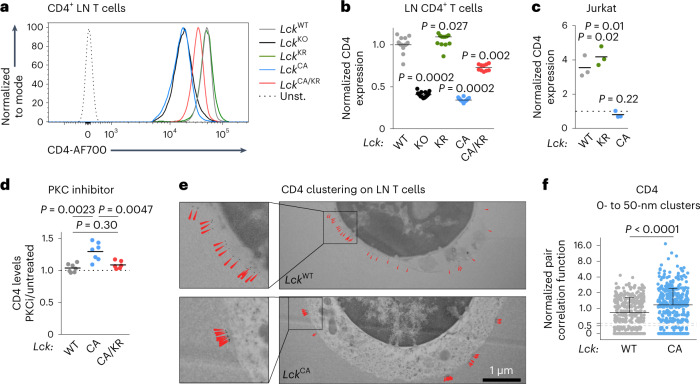
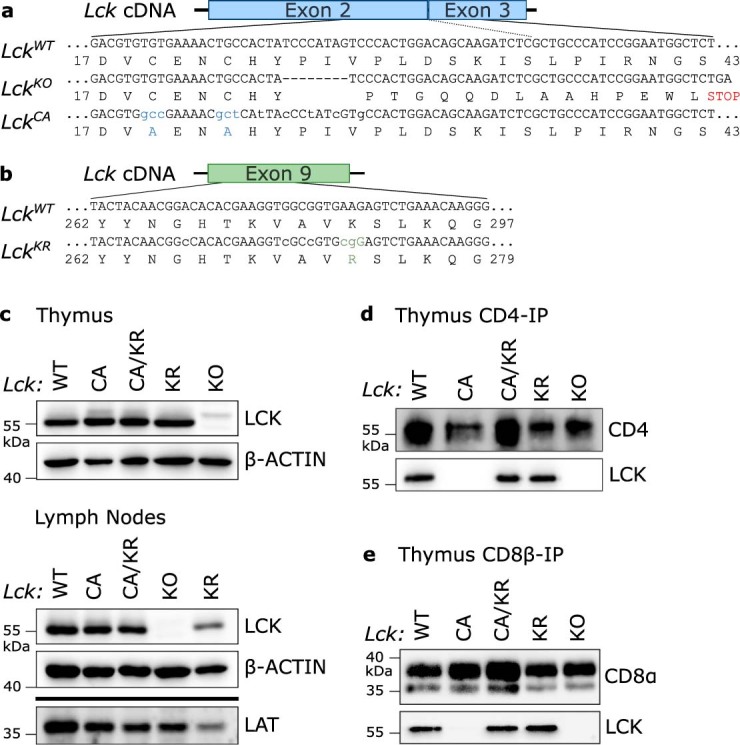
The kinase LCK and CD4/CD8 co-receptors are crucial components of the T cell antigen receptor (TCR) signaling machinery, leading to key T cell fate decisions. Despite decades of research, the roles of CD4-LCK and CD8-LCK interactions in TCR triggering in vivo remain unknown. In this study, we created animal models expressing endogenous levels of modified LCK to resolve whether and how co-receptor-bound LCK drives TCR signaling. We demonstrated that the role of LCK depends on the co-receptor to which it is bound. The CD8-bound LCK is largely dispensable for antiviral and antitumor activity of cytotoxic T cells in mice; however, it facilitates CD8+ T cell responses to suboptimal antigens in a kinase-dependent manner. By contrast, the CD4-bound LCK is required for efficient development and function of helper T cells via a kinase-independent stabilization of surface CD4. Overall, our findings reveal the role of co-receptor-bound LCK in T cell biology, show that CD4- and CD8-bound LCK drive T cell development and effector immune responses using qualitatively different mechanisms and identify the co-receptor-LCK interactions as promising targets for immunomodulation.


Conflict of interest statement

The authors declare no competing interests.

Figures

Fig. 1
Fig. 1. Role of co-receptor–LCK interaction in T cell development.
a, Schematic representation of Lck-variant strains including the LckCA/KR compound heterozygote. bd, Thymocytes from indicated mice were analyzed by flow cytometry. A representative experiment is shown in b and c. Counts of mature SP4 (TCRβ+CD24ACD4+CD8α) and mature SP8 (TCRβ+CD24ACD4CD8α+) thymocytes in individual mice and medians are shown in d; LckWT/WT: n = 25 mice and 11 independent experiments; LckKO/KO: n = 13 mice and 7 independent experiments; LckKR/KR: n = 12 mice and 6 independent experiments; LckCA/CA: n = 18 mice and 8 independent experiments; LckCA/KR: n = 11 mice and 5 independent experiments. e,f, CD4+ (viable TCRβ+CD4+CD8α) and CD8+ (viable TCRβ+CD4CD8α+) T cells in LNs were analyzed by flow cytometry. A representative experiment is shown (e). Cell counts for individual mice and medians are shown in f; LckWT/WT: n = 25 mice and 11 independent experiments; LckKO/KO: n = 13 mice and 7 independent experiments; LckKR/KR: n = 12 mice and 6 independent experiments; LckCA/CA: n = 18 mice and 8 independent experiments; LckCA/KR: n = 10 mice and 5 independent experiments. g,h, BM cells from indicated Lck-variant strains mixed with BM cells from congenic Ly5.1 WT mice were transplanted into Ly5.1/Ly5.2 heterozygous mice at a 1:1 ratio; n = 13 LckWT/WT, n = 14 LckCA/CA and n = 13 LckCA/KR mice from three independent experiments. The ratio of LN CD4+ or CD8+ T cells derived from Ly5.1 and Ly5.2 BM at 8 weeks after transplantation was calculated, and a representative experiment (g) and results from individual mice and medians (h) are shown. A value of 1.0 is indicated by the dashed line. Statistical significance was calculated using a Mann–Whitney test. Source data
Fig. 2
Fig. 2. A modest role of co-receptor–LCK interaction in DP thymocytes.
a,b, EmbedSOM maps of concatenated DP thymocyte samples from Lck-variant mice. a, EmbedSOM maps show individual FlowSOM clusters and the relative expression of indicated markers. A representative experiment out of a total of five experiments is shown. b, Frequency of cells in cluster 5; n = 7 LckWT/WT, n = 4 LckKO/KO, n = 9 LckKR/KR, n = 8 LckCA/CA and n = 10 LckCA/KR in five independent experiments. Medians are shown. Statistical significance was calculated using a Mann–Whitney test. c, Thymocytes from indicated Lck-variant OT-I mice were activated with T2-Kb cells loaded with the indicated peptides (affinity: OVA > T4 > G4) and analyzed for CD69 expression by flow cytometry; n = 3 (OVA and T4) or 4 (G4) independent experiments/mice. d, Thymocytes of indicated Lck-variant B3K508 mice were activated with Ly5.1 splenocytes loaded with indicated peptides (affinity: 3K > P5R > P2A) and analyzed for CD69 expression by flow cytometry; n = 8 (3K and P2A in LckWT/WT and LckCA/CA mice), n = 7 (3K and P2A in LckCA/KR mice) or n = 5 (P5R) independent experiments/mice. Data in c and d are shown as mean + s.e.m. Differences in the EC50 and/or maximum of the fitted non-linear regression curves were tested using an extra sum of squares F-test. F, P and EC50 values are shown. The significance of the differences between LckWT/WT and LckCA/CA mice (blue) and LckWT/WT and LckCA/KR mice (red) at individual concentrations in d was calculated using a Mann–Whitney test; *P < 0.05; **P < 0.01; no symbol, P > 0.05 (Supplementary Table 3). eg, TCR repertoires of FACS-sorted CD4+ and CD8+ mSP cells in the LNs and thymi from indicated mice were profiled. UMI-corrected counts of TCRα (TRA) and TCRβ (TRB) CDR3 amino acid sequences were normalized after the removal of NKT TRAV11-TRAJ18 CDR3 sequences. Sample sizes are in Supplementary Table 4. e, Principal-component analysis of all samples. f, Percentage of the repertoire in the indicated samples constituted by the top 20 most frequent CDR3 amino acid sequences in the LNs of LckWT/WT mice. g, The repertoire overlap was calculated as the percentage of unique CDR3 amino acid sequences in each sample present among the unique CDR3 sequences from each of the (non-identical) LckWT/WT mice. Each dot represents a single comparison. Source data
Fig. 3
Fig. 3. Role of co-receptor–LCK interaction in T cell immunity.
a,b, Indicated Lck-variant mice were infected with LCMV. a, Viral titers in the spleens were determined by RT–qPCR on day 5 or 6 after infection; n = 16 LckWT/WT, n = 15 LckCA/CA, n = 13 LckCA/KR and n = 13 LckKR/KR mice in six independent experiments on day 5; n = 12 LckWT/WT, n = 11 LckCA/CA, n = 13 LckCA/KR and n = 10 LckKR/KR mice in five independent experiments on day 6 after infection. Median values are shown. Statistical significance was calculated using a Mann–Whitney test. b, The frequency of GP33 4mer+ and NP396 4mer+ cells from CD8+ cells on day 8 after infection is displayed; n = 8 (LckCA/KR) or 9 (other strains) mice in two (LckCA/CA) or three (other strains) independent experiments. Means are shown. Statistical significance was calculated using a Mann–Whitney test. c,d, Splenic CD4+ TFH cells were identified on day 8 after infection by flow cytometry. c, Representative mice are shown. d, Percentages of TFH cells among all CD4+ T cells in the indicated mice are shown. Data show the median values; n = 15 LckWT/WT, n = 22 LckCA/CA, n = 12 LckCA/KR, and 15 LckKR/KR mice in three independent experiments. Statistical significance was calculated using a Mann–Whitney test. e, Frequency of FOXP3 TFH cells from GP66 4mer+CD4+ cells on day 8 after infection; n = 8 (LckCA/KR) or 9 (other strains) mice in two (LckCA/CA) or three (other strains) independent experiments. Statistical significance was calculated using a Mann–Whitney test. f,g, MC-38 carcinoma cells (0.5 × 106) were injected into indicated mice subcutaneously, and tumor growth was monitored; n = 15 LckWT/WT, n = 20 LckCA/CA, n = 16 LckCA/KR, n = 8 LckKO/KO and n = 6 LckKR/KR mice in two (LckKR/KR mice) or four (other strains) independent experiments. f, Tumor growth in individual Lck-variant mice is shown. Dashed lines show the endpoint of the experiment (tumor volume of 500 mm3). g, Percentage of mice with a tumor smaller than 500 mm3 in time is shown. The statistical significance was tested using a log-rank (Mantel–Cox) test (all groups) and a Gehan–Breslow–Wilcoxon test (individual groups). Source data
Fig. 4
Fig. 4. CD8-bound LCK is largely dispensable for positive selection and T cell activation.
ad, Thymi (a and b) and LNs (c and d) of indicated Lck-variant OT-I mice were analyzed by flow cytometry. a, Expression of CD4 and CD8α in representative mice (gated on viable cells). b, Numbers of mSP8 (viable CD4CD8α+CD24TCRβ+) T cells. Individual mice and medians are shown; n = 22 LckWT/WT mice in 12 independent experiments, n = 12 LckKO/KO mice in 8 independent experiments, n = 14 LckKR/KR mice in 6 independent experiments, n = 13 LckCA/CA mice in 7 independent experiments and n = 11 LckCA/KR mice in 3 independent experiments. The statistical significance was tested using a Mann–Whitney test. c, CD4+ and CD8+ T cells in representative mice (gated on viable TCRβ+ cells). d, Counts of CD8+ T cells. Individual mice and medians are shown; n = 23 LckWT/WT mice in 12 independent experiments, n = 12 LckKO/KO mice in 8 independent experiments, n = 14 LckKR/KR mice in 6 independent experiments, n = 13 LckCA/CA mice in 7 independent experiments and n = 11 LckCA/KR mice in 3 independent experiments. Statistical significance was tested using a Mann–Whitney test. e, T cells isolated from LNs of indicated Lck-variant OT-I Rag2–/– mice were activated ex vivo with T2-Kb cells loaded with the indicated peptides (affinity: OVA > Q4R7 > T4 > G4 > E4 > E1) overnight and analyzed for expression of CD69 by flow cytometry. Data are shown as the mean + s.e.m.; n = 3 independent experiments/mice for OVA and Q4R7 and n = 4 independent experiments/mice for T4, G4, E4 and E1. Differences in the EC50 and/or maximum of the fitted non-linear regression curves were tested using an extra sum of squares F-test. F, P and EC50 values are shown. f, Jurkat cells expressing OT-I TCR and LCKWT were transduced with CD8WT or with CD8CA. These Jurkat cells were activated with T2-Kb cells loaded with OVA peptide overnight and analyzed for CD69 expression by flow cytometry. Data are shown as mean + s.e.m.; n = 3 independent experiments/mice. Differences in the EC50 and/or maximum of the fitted non-linear regression curves were tested using an extra sum of squares F-test, and P, F and EC50 values are shown. Source data
Fig. 5
Fig. 5. CD8-bound LCK enhances responses to suboptimal antigens in vivo.
a, T cells from indicated Lck-variant OT-I mice were transferred into Ly5.1 mice followed by infection with indicated Lm strains. The percentage of donor cells among all CD8+ T cells on day 5 after infection was quantified by flow cytometry. Medians are shown. Statistical significance was calculated using a Mann–Whitney test; n = 20 LckWT/WT, n = 22 LckCA/CA and n = 14 LckCA/KR mice in five (LckCA/KR) or seven (other strains) independent experiments for Lm-OVA; n = 15 LckWT/WT, n = 14 LckCA/CA and n = 14 LckCA/KR mice in four independent experiments for Lm-T4; n = 11 LckWT/WT, n = 11 LckCA/CA and n = 13 LckCA/KR mice in three independent experiments for Lm-G4. b,c, MC-38 carcinoma cells (0.5 × 106) were injected into Cd3eKO/KO mice subcutaneously. OT-I T cells (0.2 × 106) were adoptively transferred into these mice 5 d later, and the size of the tumor was monitored; n = 14 mice for no OT-I, LckWT/WT OT-I and LckCA/KR OT-I or 15 mice for LckCA/CA OT-I in four independent experiments. b, Tumor growth in individual Lck-variant mice is shown. Dashed lines show the endpoint (tumor volume of 500 mm3). c, The percentage of mice with a tumor smaller than 500 mm3 in time is shown. The statistical significance was tested using a log-rank (Mantel–Cox) test (all groups) and a Gehan–Breslow–Wilcoxon test (individual groups). d, CD8+ T cells from indicated Lck-variant OT-I mice were stained with a dilution series of fluorescently labeled Kb-OVA and Kb-T4 tetramer and analyzed by flow cytometry. Mean values + s.e.m. are shown; n = 4 (LckWT/WT, LckCA/CA for Kb-OVA) or n = 3 (other samples) independent experiments/mice; gMFI, geometric mean fluorescent intensity. e, CD8+ T cells from indicated Lck-variant OT-I mice were stained with Kb-OVA-streptactin multimers. Dissociation of Kb-OVA monomer after the addition of free biotin was measured by flow cytometry. Individual experiments and means are shown; n = 3 independent experiments/mice. f, CD8+ T cells from indicated Lck-variant OT-I mice were stained with AF555-labeled anti-TCRβ scFV and added to planar supported lipid bilayers with ICAM-1 and AF647-labeled Kb-OVA monomers. Relative TCR:Kb-OVA occupancy was measured as a fluorescence resonance energy transfer between the donor and acceptor fluorophores. LckWT/WT OT-I T cells adhered to the lipid bilayer without Kb-OVA monomers were used as a negative control. Individual cells, medians and interquartile ranges are shown; n = 54 control, n = 189 LckWT/WT, n = 179 LckCA/CA and n = 184 LckCA/KR cells in two independent experiments. Source data
Fig. 6
Fig. 6. Kinase-dependent and kinase-independent roles of CD4-bound LCK in T cell responses.
ad, Thymi (a and b) and LNs (c and d) of indicated B3K508 mice were analyzed by flow cytometry. Statistical significance was calculated using a Mann–Whitney test. a, Expression of CD4 and CD8 in representative mice (gated on viable cells). b, Numbers of mSP4 (viable CD4CD8α+CD24TCRβ+) T cells; LckWT/WT: n = 24 mice in 10 independent experiments; LckKO/KO: n = 12 mice in 7 independent experiments; LckKR/KR: n = 13 mice in 6 independent experiments; LckCA/CA: n = 19 mice in 8 independent experiments; LckCA/KR: n = 10 mice in 3 independent experiments. Individual mice and medians are shown. c, CD4+ and CD8+ T cells in representative mice (gated on viable TCRβ+ cells). d, Numbers of CD4+ T cells in individual mice and medians are shown; LckWT/WT: n = 26 mice in 11 independent experiments; LckKO/KO: n = 11 mice in 7 independent experiments; LckKR/KR: n = 13 mice in 6 independent experiments; LckCA/CA: n = 20 mice in 9 independent experiments; LckCA/KR: n = 10 mice in 3 independent experiments. e, T cells isolated from LNs of indicated Lck-variant B3K508 mice were activated ex vivo with splenocytes from Ly5.1 mice loaded with 3K peptide or APLs with decreasing affinity (3K > P5R > P2A) overnight and analyzed for the expression of CD69 by flow cytometry. Mean values + s.e.m. are shown; number of independent experiments/mice: n = 7 (LckCA/KR) or 8 (other strains) for 3K, 5 for P5R and 6 (LckCA/KR) or 8 (other strains) for P2A. Differences in the EC50 and/or maximum of the fitted non-linear regression curves were tested using an extra sum of squares F-test. F, P and EC50 values are shown. The significance of the differences at individual concentrations was calculated using a Mann–Whitney test and is displayed between LckWT/WT and LckCA/CA mice (blue stars) and LckWT/WT and LckCA/KR mice (red stars); *P < 0.05; **P < 0.01; no symbol, P > 0.05 (Supplementary Table 5). f, Indicated Lck-variant B3K508 Rag2KO/KO T cells were transferred into Ly5.1 mice followed by infection with Lm expressing 3K or P2A. Expansion of B3K508 T cells was measured as percentage among total CD4+ T cells on day 5 after infection by flow cytometry. Results for individual mice and medians are shown; n = 8 LckWT/WT, n = 11 LckCA/CA and n = 10 LckCA/KR mice from three independent experiments for Lm-3K; n = 12 LckWT/WT, n = 13 LckCA/CA and n = 13 LckCA/KR mice from three independent experiments for Lm-P2A. Statistical significance was calculated using a Mann–Whitney test. Source data
Fig. 7
Fig. 7. LCK retains CD4 on the surface of T cells in a kinase-independent manner.
a,b, Relative CD4 surface levels on CD4+ T cells isolated from indicated Lck variants were determined by flow cytometry. a, Representative mice; Unst., unstained. b, Normalized CD4 expression (average gMFI of LckWT/WT was set as 1 in each experiment). Individual mice and medians are shown; n = 25 LckWT/WT, n = 13 LckKO/KO, n = 12 LckKR/KR, n = 18 LckCA/CA and n = 10 LckCA/KR mice in 11 independent experiments. The statistical significance was calculated using a Wilcoxon signed-rank test (versus the value of 1). c, Surface CD4 levels on LCKKO Jurkat cells transduced with indicated LCK variants were determined by flow cytometry (gMFI) and normalized to CD4 levels on untransduced LCKKO Jurkat cells (=1, indicated by a dashed line). Independent experiments and means are shown; n = 3 independent experiments. The statistical significance was calculated using a one-value t-test. d, LN T cells of indicated Lck-variant strains were incubated with a PKC inhibitor Ro-32-0432 overnight. CD4 expression was analyzed by flow cytometry (gMFI) and normalized to untreated cells from the same mouse (=1, indicated by a dashed line); n = 7 independent experiments/mice for LckWT/WT and LckCA/CA and n = 6 for LckCA/KR. Independent experiments and means are shown. The statistical significance was tested using a Mann–Whitney test; PKCi, PKC inhibitor. e,f, CD4 on LN CD4+ T cells from LckWT/WT or LckCA/CA B3K508 Rag2KO/KO mice was visualized with gold-labeled antibodies using transmission electron microscopy. e, Representative cells are shown. The arrows indicate CD4 molecules. f, Normalized pair correlation function values for CD4 clustering (clusters of 0–50 nM) were calculated for each cell. Individual values and medians + s.d. are shown; n = 358 LckWT/WT and n = 423 LckCA/CA cells from three independent experiments. The statistical significance was tested using a Mann–Whitney test. Source data
Extended Data Fig. 1
Extended Data Fig. 1. Generation of Lck variant mouse models.
(a) A scheme of targeting of the Lck locus for the generation of the LckCA allele by CRISPR/Cas9. Resulting LckCA (repaired via homologous recombination according to the DNA template) and LckKO (non-homologous end joining causing a short deletion) alleles and the respective LCK protein sequences are shown. (b) A scheme of targeting of the Lck locus for the generation of the LckKR allele by CRISPR/Cas9. Resulting LckKR (repaired via homologous recombination according to the DNA template) allele and the respective LCK protein sequence are shown. (c) LCK protein levels in thymi and LNs of Lck variant mice were detected by immunoblotting showing the comparable expression of Lck in these strains. β-actin staining was used as a loading control. LAT staining was used as a control for T-cell derived proteins in the lysates. A representative experiment out of 3 in total is shown. (d-e) Immunoprecipitation of CD4 (d) and CD8β (e) followed by immunoblotting and LCK staining in indicated Lck variant mice. A representative experiment out of 2 (d) or 3 (e) in total is shown. Source data
Extended Data Fig. 2
Extended Data Fig. 2. The enzymatic activities of LCKWT and LCKCA in cells are comparable.
(a) HEK293 cells were co-transfected with LCK-FLAG variants and CD25-TCRζ fusion protein or empty vector (e.v.) and harvested after 24 h. The phosphorylation of CD25-TCRζ was by detected immunoblotting. A representative experiment out of 2 in total. (b) HEK293 cells were co-transfected with LCK-FLAG variants and ZAP70 or empty vector (e.v.) and harvested after 24 h. The phosphorylation of ZAP70 was by detected immunoblotting. A representative experiment out of 2 in total. (c) LCKKO Jurkat cells reconstituted with indicated LCK variants were activated by anti-TCR antibody for 90 s. The phosphorylation and expression of indicated markers was detected by immunoblotting. A representative experiment out of 3 independent experiments. (d) LCKKO Jurkat cells expressing OT-I TCR were reconstituted with various LCK variants and activated with OVA-loaded T2-Kb cells overnight and analyzed for CD69 expression by flow cytometry. Mean + /- s.e.m. is shown. n = 3 independent experiments. Source data
Extended Data Fig. 3
Extended Data Fig. 3. Characterization of the T-cell compartment in Lck variant mice.
(a-f) Thymocytes and (g-j) LN cells from the indicated mice were analyzed by flow cytometry. (a-b) The percentage of cells at the DN3 stage (CD44 CD25+) out of all DN (viable CD4 CD8α-) thymocytes is shown. (a) Representative mice. (b) Individual values and medians are shown. LckWT/WT: n = 22 mice in 10 independent experiments, LckKO/KO: 12/6, LckKR/KR: 12/6, LckCA/CA: 17/7, LckCA/KR: 11/5. (c) Percentages of mature SP4 (TCRβ+ CD24CD4+ CD8α-) and mature SP8 (TCRβ+ CD24CD4 CD8α+) thymocytes. LckWT/WT: n = 25 mice in 11 independent experiments, LckKO/KO: 13/7 independent experiments, LckKR/KR: 12/6 independent experiments, LckCA/CA: 18/8, LckCA/KR: 11/5, LckWT/KO: 16/7, LckWT/KR: 14/8, LckWT/CA: 19/8. Individual values and medians are shown. (d) Phosphorylation of TCRζ was in thymocytes from the indicated mice was analyzed by immunoblotting. A representative experiment out of 3 in total. (e-f) Phosphorylation of TCRζ in thymocyte subpopulations determined by flow cytometry. (e) A representative experiment out of 6 in total. (f) Normalized TCRζ phosphorylation (net gMFI of LckWT mice were set as 1). n = 6 independent experiments/mice. Means are shown. The statistical significance was determined using a Mann Whitney test. (g) Frequency of TCRβ+ LN cells was analyzed by flow cytometry. A representative experiment out of 11 for LckWT/WT, 7 for LckKO/KO, 6 for LckKR/KR, 8 for LckCA/CA and 5 for LckCA/KR mice in total. (h-i) A percentage of CD44+ CD49d T cells out of CD8+ T cells was determined by flow cytometry. (h) Representative samples of LckWT/WT and LckCA/CA mice are shown. (i) Individual values and medians are shown. LckWT/WT: 25 mice in 11 independent experiments, LckKO/KO: 13/7, LckKR/KR: 12/6, LckCA/CA:18/8, LckCA/KR: 10/5. (j) Frequency of regulatory T cells from overall CD4+ T cells in Lck variant mice is shown. n = 12 LckWT/WT, 14 LckCA/CA, 10 LckCA/KR mice in 3 independent experiments. Statistical significance was calculated using a Mann-Whitney test. (k) Ratio of CD4+/CD8+ T cell counts derived from bone marrows of LckWT/WT, LckCA/CA, and LckCA/KR donors in the mixed bone marrow chimeras (Fig. 1g-h). n = 13 LckWT/WT, 14 LckCA/CA, 13 LckCA/KR mice from 3 independent experiments. Individual values and medians are shown. Source data
Extended Data Fig. 4
Extended Data Fig. 4. Development of DP thymocytes in Lck variant mice.
(a-b) Thymocytes from Lck variant mice were analyzed by flow cytometry. (a) Representative histograms are shown. (b) Normalized expression of indicated surface markers in the Lck variant mice (average gMFI in LckWT/WT mice was set as 1). Individual values and medians are shown. LckWT/WT: 25 mice in 11 independent experiments, LckKO/KO: 13/7, LckKR/KR: 12/6, LckCA/CA:18/8, LckCA/KR: 11/5. The statistical significance was calculated by Wilcoxon Signed Rank Test (vs the value of 1). (c) Additional 4 independent experiments described in Fig. 2a-b. (d) Representative mice from Experiment 3 described in Fig. 2a-b. (e-h) Basal phosphorylation of TCRζ (e-f) and ZAP70 (g-h) in the indicated thymocyte subpopulations (TCRβlow DP, TCRβhigh DP, TCRβhigh SP8, TCRβhigh SP4) in the indicated Lck variant mouse strains was determined by flow cytometry. (e,g) Overall data are shown. Data normalized to gMFI of LckWT/WT mice are displayed. n = 5 independent experiments/mice. The statistical significance was tested using one sample t-test values. (f, h) Representative experiments out of 5 in total. Source data
Extended Data Fig. 5
Extended Data Fig. 5. Signaling in DP thymocytes in Lck variant mice.
(a) Thymocytes of indicated Lck variants OT-I Rag2KO/KO β2mKO/KO mice were activated ex vivo with T2-Kb cells loaded with OVA peptide or APLs with decreasing affinity (OVA > T4 > E4 > E1) overnight and analyzed for the CD69 expression by flow cytometry. Mean values + /- s.e.m. are shown. n = 6 independent experiments/mice for LckWT vs. LckCA (upper row), n = 3 independent experiments/mice for LckWT vs. LckCA/KR (bottom row). Differences in the EC50 of the fitted non-linear regression curves were tested using extra sum-of-squares F test. F, p, and fitted EC50 values are shown. (b) Fetal thymic organ cultures from indicated Lck variant OT-I Rag2KO/KO β2mKO/KO mice were stimulated with OVA peptide (20 µM) or its APLs decreasing affinity (Q4R7 > Q4H7; 2 µM) and analyzed by flow cytometry after 7 days. Individual mice and means are shown. n = 13 for LckWT/WT no peptide and Q4H7 in 5 independent experiments, n = 14 for LckWT/WT Q4R7in 5 independent experiments, n = 4 for LckWT/WT OVA in 2 independent experiments, n = 13 for LckCA/CA no peptide in 5 independent experiments, n = 8 for LckCA/CA Q4H7 in 3 independent experiments, n = 14 for LckCA/CA Q4R7 in 5 independent experiments, n = 5 for LckCACA OVA in 2 independent experiments, n = 10 for LckKO/KO no peptide in 4 independent experiments, n = 8 for LckKO/KO Q4H7 in 3 independent experiments, n = 9 for LckKO/KO Q4R7 in 3 independent experiments, n = 6 for LckKO/KO OVA in 2 independent experiments. Statistical significance was calculated using a Mann-Whitney test. Source data
Extended Data Fig. 6
Extended Data Fig. 6. Gene segment usage analysis of TCR repertoires in Lck variant mice.
(a-d) Analysis of TCR repertoires in CD4+ and CD8+ LN T cells, and mature SP4 and SP8 thymocytes from LckWT/WT (gray), LckCA/CA (blue) and LckCA/KR (red) mice. The information about the sample size are in Supplementary Table 6. Individual mice and means are shown. Related to Fig. 2e-g. (a) The usage of TRAV and TRBV gene segments in the indicated mice. Each bar represents the average frequency of the gene segment among all CDR3 sequences in a particular group of samples. (b) A total percentage of typical TCRβ (TRB) gene segments used by NKT cells (TRBV1,TRBV13-2, and TRBV9) in the indicated samples from the indicated mice. (c) Percentage of TCRs containing TRAV11-TRAJ18 gene segments typically used by NKT cells in the indicated cells from the indicated mice. (d) Diversity of the repertoire of the TCRα (TRA) and TCRβ (TRB) CDR3 amino acid sequences in the indicated cells from the indicated mice calculated using the Chao1 richness estimator. CD4 and CD8 T-cell CDR3 amino acid sequences were analyzed together (left) or separately (right). Invariant NKT TRAV11-TRAJ18 CDR3 amino acid sequences were removed before this analysis. The statistical significance was calculated using a Kruskal-Wallis test with multiple comparison adjustment using the Holm method. Source data
Extended Data Fig. 7
Extended Data Fig. 7. Analysis of T-cell compartment in anti-viral and anti-tumor responses.
(a-g) Indicated Lck variant mice were infected with LCMV and the splenocytes were analyzed on day 8 post-infection. n = 8 (LckCA/KR) or 9 (other strains) mice in 2 (LckCA/CA) or 3 (other strains) independent experiments. Individual mice and means are shown. The statistical significance was calculated using a Mann-Whitney test. Related to Fig. 3a-e. (a) Counts of CD8+ cells in the spleens. (b) Counts of CD4+ cells in the spleens. (c) Counts of GP33 4mer+ and NP396 4mer+ CD8+ cells in the spleens. (d) Frequencies of CD44+ CD49d+ cells from NP396 4mer+ CD8+ cells in the spleens. (e) Frequencies of KLRG1+ CD127 cells from NP396 4mer+ CD8+ cells in the spleens. (f) Frequencies of TFH cells expressing FOXP3 and counts of FOXP3 TFH cells in the spleens. (g) Frequencies and counts of GP66 4mer+ CD4+ cells in the spleens. (h-j) Tumor-infiltrating CD8+ T cells were isolated from MC-38-OVA tumors from Lck variant mice and analyzed by flow cytometry. n = 9 for LckWT/WT, LckCA/KR, n = 8 for LckCA/CA, LckKR/KR from 3 independent experiments. (j) Counts of tumor-infiltrating CD8+ T cells. Individual mice and medians are shown. (k) An example of gating strategy for the detection of Kb-OVA 4mer+ cells. (i) Frequencies and counts of Kb-OVA 4mer+ cells in tumors. Individual mice and medians are shown. Source data
Extended Data Fig. 8
Extended Data Fig. 8. Characterization of CD8+ T cells in the Lck variant mice.
(a-d) Thymi (a-b) and LNs (c-d) of indicated Lck variant F5 Rag1KO/KO mice were analyzed by flow cytometry. (a) Expression of CD4 and CD8α in representative mice (gated on viable cells). (b) Counts of mature SP8 (viable CD4 CD8α+ CD24 TCRβ+) thymocytes. Individual mice and medians are shown. n = 10 LckWT/WT in 7 independent experiments, 5 LckKO/KO in 3 independent experiments, 9 LckKR/KR, 13 LckCA/CA and LckCA/KR in 8 independent experiments. (c) Expression of CD4 and CD8α in representative mice (gated on viable cells). (d) Total numbers of CD8+ T cells in LNs. Individual mice and medians are shown. n = 10 LckWT/WT in 7 independent experiments, 5 LckKO/KO in 3 independent experiments, 9 LckKR/KR, 12 LckCA/CA and 13 LckCA/KR in 8 independent experiments. (e-f) LN cells from indicated Lck variant OT-I mice were loaded with Cell Trace violet (CTV) and stimulated with anti-CD3/CD28 beads. (e) The proliferation was evaluated based on the CTV dilution at 72 hours after activation by flow cytometry. A representative experiment/mice out of 4 in total. (f) Upregulation of CD69 was analyzed by flow cytometry at 16 hours after activation. Mean + s.e.m. n = 3 independent experiments/mice. Differences in the EC50 and/or maximum of the fitted non-linear regression curves were tested using extra sum-of-squares F test. F and p values are shown. (g) Thymocytes from indicated Lck variant CD8 WT or CD8.4 OT-I mice were analyzed by flow cytometry. Representative mice and the frequencies of SP4 T cells from 3 independent experiments/mice are shown. (h) LN cells from indicated Lck variant CD8 WT or CD8.4 OT-I mice were analyzed by flow cytometry. Representative mice and the frequencies of CD44+ CD49d antigen-inexperienced memory-like cells (individual values and means) from 3 independent experiments/mice are shown. Source data
Extended Data Fig. 9
Extended Data Fig. 9. Characterization of CD4 + T cells in the Lck variant mice.
(a-b) LN cells from indicated Lck variant B3K508 mice were loaded with Cell Trace violet (CTV) and stimulated with anti-CD3/CD28 beads. (a) The proliferation was evaluated based on CTV dilution by flow cytometry at 72 hours after activation. A representative experiment/mice out of 4 in total. (b) Upregulation of CD69 was analyzed by flow cytometry at 16 hours after activation. Mean + SEM. n = 3 independent experiments/mice. Differences in the EC50 and/or maximum of the fitted non-linear regression curves were tested using extra sum-of-squares F test. F and p values are shown. (c) Surface levels of CD8α on CD8+ LN T cells in indicated Lck variant mice. A representative experiment and normalized CD8α surface levels (average gMFI of LckWT/WT was set as 1 in each experiment). n = 25 LckWT/WT in 11 independent experiments, 13 LckKO/KO in 7 independent experiments and 18 LckCA/CA in 8 independent experiments. Individual values and means. (d-e) CD4 surface levels on DP thymocytes (d) and mature SP4 thymocytes (e) of Lck variant mice were analyzed by flow cytometry. Representative histograms and the quantification of normalized CD4 surface levels (average gMFI of LckWT/WT was set as 1 in each experiment). n = 25 LckWT/WT in 11 independent experiments, 13 LckKO/KO in 7 independent experiments, 12 LckKR/KR in 6 independent experiments, 18 LckCA/CA in 8 independent experiments, 11 LckCA/KR mice in 5 independent experiments. Individual values and means. The statistical significance was calculated using a Wilcoxon Signed Rank Test (vs the value of 1). (f) CD4 surface levels on WT Jurkat and LCKKO Jurkat cells were analyzed by flow cytometry. A representative experiment out of 3 in total. (g) A representative experiment showing CD4 surface levels on CD4+ T cells upon the overnight treatment with PKC inhibitor as in Fig. 7d. Source data

Comment in

References

    1. Straus DB, Weiss A. Genetic evidence for the involvement of the Lck tyrosine kinase in signal transduction through the T cell antigen receptor. Cell. 1992;70:585–593. doi: 10.1016/0092-8674(92)90428-F. - DOI - PubMed
    1. Veillette A, Bookman MA, Horak EM, Bolen JB. The CD4 and CD8 T cell surface antigens are associated with the internal membrane tyrosine-protein kinase p56lck. Cell. 1988;55:301–308. doi: 10.1016/0092-8674(88)90053-0. - DOI - PubMed
    1. Rudd CE, Trevillyan JM, Dasgupta JD, Wong LL, Schlossman SF. The CD4 receptor is complexed in detergent lysates to a protein-tyrosine kinase (pp58) from human T lymphocytes. Proc. Natl Acad. Sci. USA. 1988;85:5190–5194. doi: 10.1073/pnas.85.14.5190. - DOI - PMC - PubMed
    1. Artyomov MN, Lis M, Devadas S, Davis MM, Chakraborty AK. CD4 and CD8 binding to MHC molecules primarily acts to enhance Lck delivery. P Natl Acad. Sci. USA. 2010;107:16916–16921. doi: 10.1073/pnas.1010568107. - DOI - PMC - PubMed
    1. Stepanek O, et al. Coreceptor scanning by the T cell receptor provides a mechanism for T cell tolerance. Cell. 2014;159:333–345. doi: 10.1016/j.cell.2014.08.042. - DOI - PMC - PubMed

Publication types

MeSH terms

Substances