. 2023 Feb;42(8):613-624.
doi: 10.1038/s41388-022-02579-1. Epub 2022 Dec 23.

PCNA regulates primary metabolism by scaffolding metabolic enzymes

Affiliations

PCNA regulates primary metabolism by scaffolding metabolic enzymes

Lisa M Røst et al. Oncogene. 2023 Feb.

Abstract

The essential roles of proliferating cell nuclear antigen (PCNA) as a scaffold protein in DNA replication and repair are well established, while its cytosolic roles are less explored. Two metabolic enzymes, alpha-enolase (ENO1) and 6-phosphogluconate dehydrogenase (6PGD), both contain PCNA interacting motifs. Mutation of the PCNA interacting motif APIM in ENO1 (F423A) impaired its binding to PCNA and resulted in reduced cellular levels of ENO1 protein, reduced growth rate, reduced glucose consumption, and reduced activation of AKT. Metabolome and signalome analysis reveal large consequences of impairing the direct interaction between PCNA and ENO1. Metabolites above ENO1 in glycolysis accumulated while lower glycolytic and TCA cycle metabolite pools decreased in the APIM-mutated cells; however, their overall energetic status were similar to parental cells. Treating haematological cancer cells or activated primary monocytes with a PCNA targeting peptide drug containing APIM (ATX-101) also lead to a metabolic shift characterized by reduced glycolytic rate. In addition, we show that ATX-101 treatments reduced the ENO1 - PCNA interaction, the ENO1, GAPDH and 6PGD protein levels, as well as the 6PGD activity. Here we report for the first time that PCNA acts as a scaffold for metabolic enzymes, and thereby act as a direct regulator of primary metabolism.


Conflict of interest statement

APIM Therapeutics is a spin-off company of the Norwegian University of Science and Technology, NTNU, developing APIM-peptides for use in cancer therapy. The lead APIM-peptide ATX-101 is currently in Phase II. Professor Marit Otterlei is founder, minority shareholder and part time CSO of this company. The authors have no additional competing financial interests.

Figures
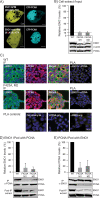
Fig. 1
Fig. 1. Mutation of APIM in ENO1 reduces binding to PCNA and ENO1 protein levels.
A Images of HEK293 cells co-transfected with CFP-PCNA and ENO1 APIM (upper panel) and ENO1 mutated APIM (lower panel) fused to YFP. Scale bar: 5 µm. B Lower panel: representative western blot showing ENO1, PCNA and β-actin levels (input) in parental (WT) and ENO1 F423A (M1 and M2) HAP1 cytosolic cell extracts (50 µg). Upper panel: densitometric quantifications of ENO1 levels normalized to β-actin, presented relative to ENO1 levels in WT cells. Mean ± SD, n = 4. C Immunofluorescence (IF): confocal images of endogenous levels of ENO1 and PCNA in WT (upper panel) and F423A M2 cells (mid panel). α-ENO1 (green), α-PCNA (red), and DAPI (blue). Proximity Ligation Assay (PLA): α-ENO1 and α-PCNA (upper and mid panel), no primary antibodies (ab), only α-PCNA or only α-ENO1 (PLA controls, lower panel). Positive PLA signal (yellow spots). Scale bar: 10 µm. D, E Lower panels: representative western blots showing ENO1 IPed with PCNA (D) or PCNA IPed with ENO1 (E) from WT and F423A M1 and M2 extracts. WB of extracts post-IP shown, ~3% of the total IP solution added (input shown in B). Upper panels: densitometric quantifications of ENO1 normalized to PCNA levels (D) or PCNA normalized to ENO1 (E), presented as relative to ENO1 (D) and PCNA (E) in WT cells. Mean ± SD, n = 3.
Fig. 2
Fig. 2. Mutation of APIM in ENO1 reduces cell growth and alters carbon flux and central carbon metabolite pools.
A Growth of parental (WT) and ENO1 F423A mutant (M1 and M2) HAP1 cells measured over 3 days. Mean ± SD, n = 3. B Glucose consumption and lactate secretion (ng per cell per 24 h) in WT and F423A M1 and M2 cells. Mean ± SD, n = 4. C Simplified schematic overview of central carbon metabolism. Arrows indicate reactions and possible directionalities. Dashed lines link precursor and product metabolite in multistep reactions. Log2 fold changes (FC) of metabolite levels in F423A M2 cells relative to WT cells are heat mapped. Mean from 3 repeated experiments with 3 replicate cultures each are shown (n = 9). Dashed outlines indicates that the metabolite is not covered by the analytical method. The non-essential amino acids are linked to their precursor metabolite while the essential amino acids are presented in the left panel. D Ratios of NADH/NAD+ and NADPH/NADP+ in WT and F423A M1 and M2 cells. Mean ± SD, n = 3. Experimental details are listed in Supplementary Table S1, and metabolite abbreviations with HMDB IDs are listed in Supplementary Table S2A. A complete list of log2 FC relative to WT are listed for all metabolites and repeated experiments in Supplementary Table S2B.
Fig. 3
Fig. 3. Mutation of APIM in ENO1 activates oxidative phosphorylation and reduce activation of AKT.
A Venn diagram of proteins pulled down from cell extracts of parental (WT) and ENO1 F423A (M1 and M2) HAP1 cells using the multiplexed inhibitor bead (MIB)-assay. Only proteins detected in pull downs from all experiments (n = 3) are included. B Summary of STRING network analysis of the 242 proteins pulled down only from F423A M1 and M2 extracts. C Lower panel: representative western blot showing p-Ser 473 AKT, β-actin and total AKT in WT and F423A M1 and M2 extracts. Upper panel: densitometric quantifications of p-Ser 473 AKT and total AKT levels, both normalized to β-actin, presented relative to ENO1 levels in parental WT cells. Mean ± SD, n = 3, quantification of the individual replicas is shown as square, circle and triangle. *p < 0.05, paired two-tailed student t-test.
Fig. 4
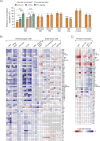
Fig. 4. Targeting protein - PCNA interactions in haematological cells reduced central carbon metabolite pools.
A Glucose consumption (solid bars) and lactate secretion (dashed bars) per cell per 24 h given relative to untreated control (mean ± SD) in JJN3 cells (MM) treated with ATX-101 (orange), ATX-A (brown), or R11-peptide (green) (all 8 µM) (left) and ATX-101 treated MC/CAR (MM, 8 µM), RPMI 8226 (MM, 8 µM), NB4 (AML, 8 µM), HL60 (AML, 8 µM), HEK293 (embryonic kidney, 10 µM), and DU145 (prostate cancer, 8 µM) cells. (JJN3: *p < 0.05, **p < 0.01, ***p < 0.001, ANOVA, post hoc Tukey’s test, n ≥ 4, Other cell lines: *p < 0.05, **p < 0.01, ***p < 0.001, unpaired two-tailed student t-test, n ≥ 3). B Heat mapped log2 fold change of all quantified central carbon metabolites in ATX-101 treated cells given relative to untreated control; JJN3, RPMI 8226, MC/CAR, HL60, NB4, primary monocytes (all 8 µM ATX-101, 4 h), T24 (bladder cancer, 16 µM ATX-101, 24 h), DU145 (8 µM ATX-101, 4, 8, 24 h) and HEK293 (8 µM ATX-101, 4, 8, 24 h). C Heat mapped log2 fold change of central carbon metabolites in primary monocytes from three donors for LPS (10 ng/ml), ATX-101 (8 µM) (same data as monocytes in (B) and the combination treatment relative to untreated control. B, C Grey colour in heat map = not measured. Mean ± SD, n ≥ 3. Absolute Log2 fold changes are listed in Supplementary Table S2C. Experimental details are listed in Supplementary Table S1 and in [9]. Metabolite abbreviations and HMDB IDs are listed in Supplementary Table S2A. These results are previously published in BioRxiv [49].
Fig. 5
Fig. 5. ATX-101 treatment reduces 6PGD activity and 6PGD and ENO1 protein levels and blocks ENO1 – PCNA interactions.
A–E 6PGD activity and protein levels measured in JJN3 cells and cell extracts exposed to no (black), ATX-101 (8 μM, orange), ATX-A (8 μM, brown) and Ebselen (20 μM, blue) treatment. A, B 6PGD activity (OD = 460 nm) are plotted as relative to untreated control, mean ± SEM. (A) 6PGD activity in cell extracts from untreated JJN3 cells after addition of ATX-101 and Ebselen immediately before measurements, n = 11. (B) 6PGD activity in cell extracts from JJN3 cells treated with ATX-101, ATX-A and Ebselen for 4 h, n = 5. (C, E) Lower panels: representative western blots (WB) showing β-actin and (C) 6PGD, (D) ENO1 and (E) PCNA levels in JJN3 cells 24 h after ATX-101 treatment. Upper panel: densitometric quantifications of (C) 6PGD, (D) ENO1 and (E) PCNA levels normalized to β-actin, presented as relative to untreated controls. The mean levels and the levels in each experiments, n = 4 (square, circle, triangle and diamond) are shown. *p < 0.05, ***p < 0.001, two tailed, paired t-test. Experimental details are listed in Supplementary Table S1. F Lower panels: WB showing 6PGD, GAPDH, ENO1, PCNA and H3 (Histone 3) levels in WT HAP1 cells treated with ATX-101 (20 μM) 1-4 times (t = 0, 4, 8, and 12 h) and harvested at t = 24 h. Upper panel: densitometric quantifications of ENO1, 6PGD, GAPDH and PCNA normalized to H3 levels, presented as relative to untreated control. G Proximity Ligation Assay (PLA) analysis of WT HAP1 cells untreated (left image) or treated with ATX-101 (20 μM) (four right images) 5 times. Cells were probed with α-ENO1 and α-PCNA (two left images), and in the PLA controls with only α-PCNA, only α-ENO1 or no primary antibodies (ab). Positive PLA signals (yellow spots), DAPI (blue). Scale bar: 10 µm.

References

    1. Warbrick E. PCNA binding through a conserved motif. Bioessays. 1998;20:195–9. doi: 10.1002/(SICI)1521-1878(199803)20:3<195::AID-BIES2>3.0.CO;2-R. - DOI - PubMed
    1. Gilljam KM, Feyzi E, Aas PA, Sousa MM, Muller R, Vagbo CB, et al. Identification of a novel, widespread, and functionally important PCNA-binding motif. JCB. 2009;186:645–54. doi: 10.1083/jcb.200903138. - DOI - PMC - PubMed
    1. Müller R, Misund K, Holien T, Bachke S, Gilljam KM, Våtsveen TK, et al. Targeting proliferating cell nuclear antigen and its protein interactions induces apoptosis in multiple myeloma cells. PLoS One. 2013;8:e70430. doi: 10.1371/journal.pone.0070430. - DOI - PMC - PubMed
    1. Sebesta M, Cooper CDO, Ariza A, Carnie CJ, Ahel D. Structural insights into the function of ZRANB3 in replication stress response. NatCommun. 2017;8:15847. - PMC - PubMed
    1. Olaisen C, Kvitvang HFN, Lee S, Almaas E, Bruheim P, Drablos F, et al. The role of PCNA as a scaffold protein in cellular signaling is functionally conserved between yeast and humans. FEBS Open Bio. 2018;8:1135–45. doi: 10.1002/2211-5463.12442. - DOI - PMC - PubMed

Publication types