. 2023 Feb;26(2):259-273.
doi: 10.1038/s41593-022-01223-1. Epub 2022 Dec 23.

Neocortical synaptic engrams for remote contextual memories

Affiliations

Neocortical synaptic engrams for remote contextual memories

Ji-Hye Lee et al. Nat Neurosci. 2023 Feb.

Abstract

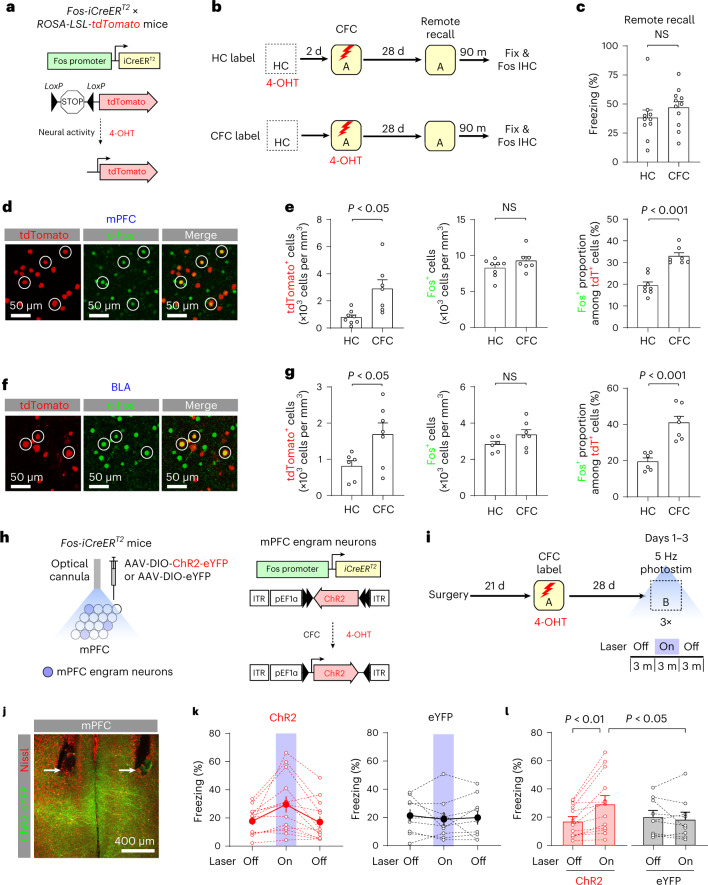
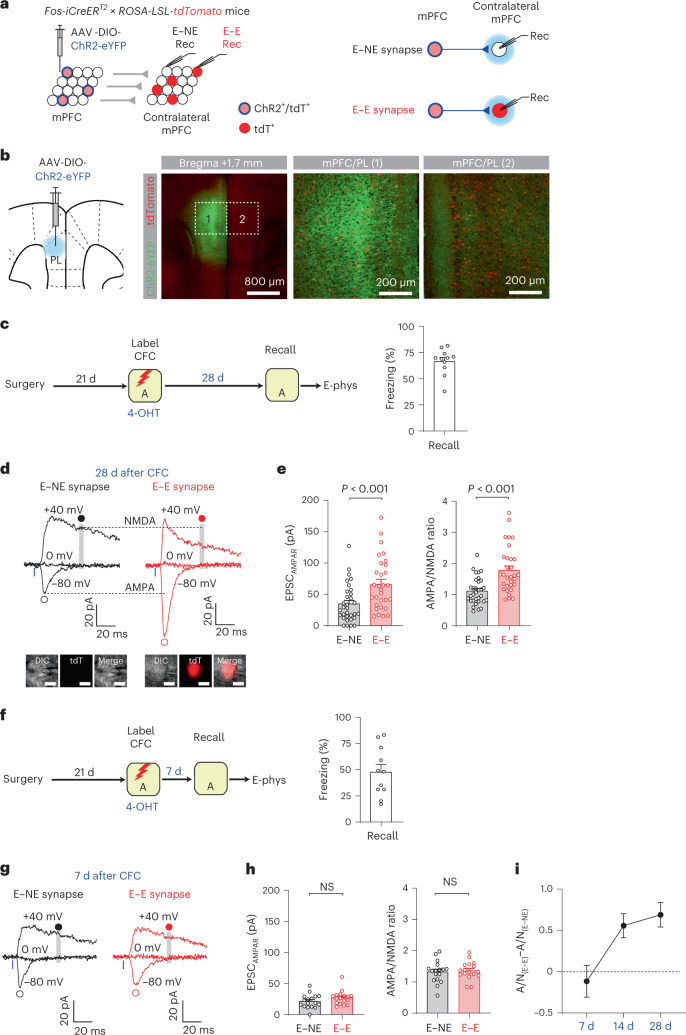
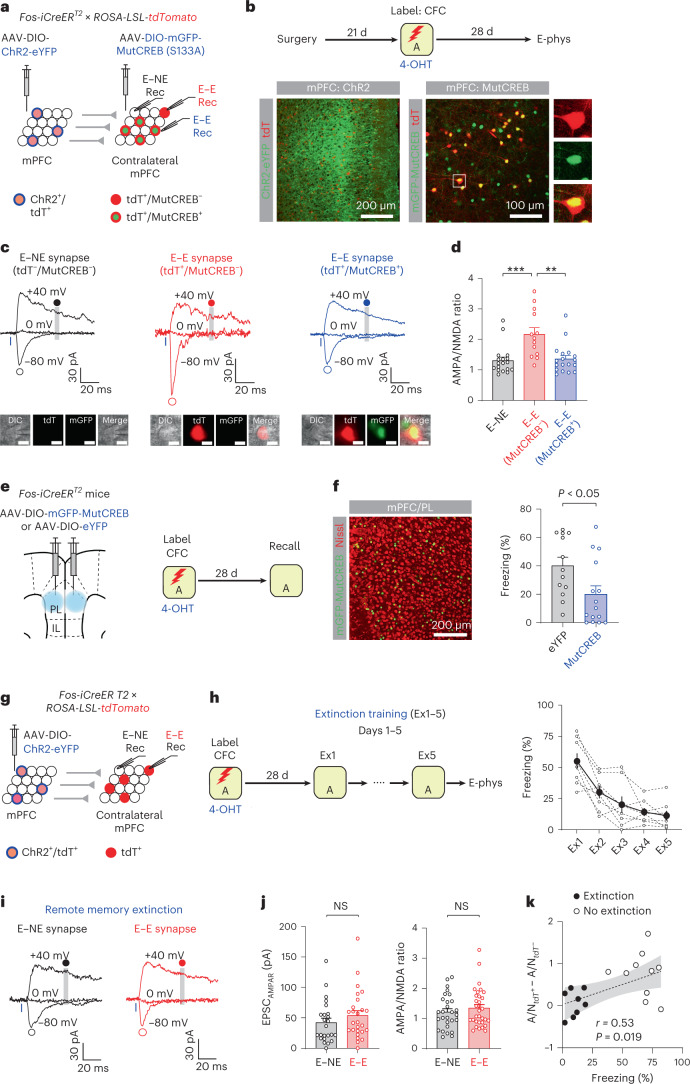
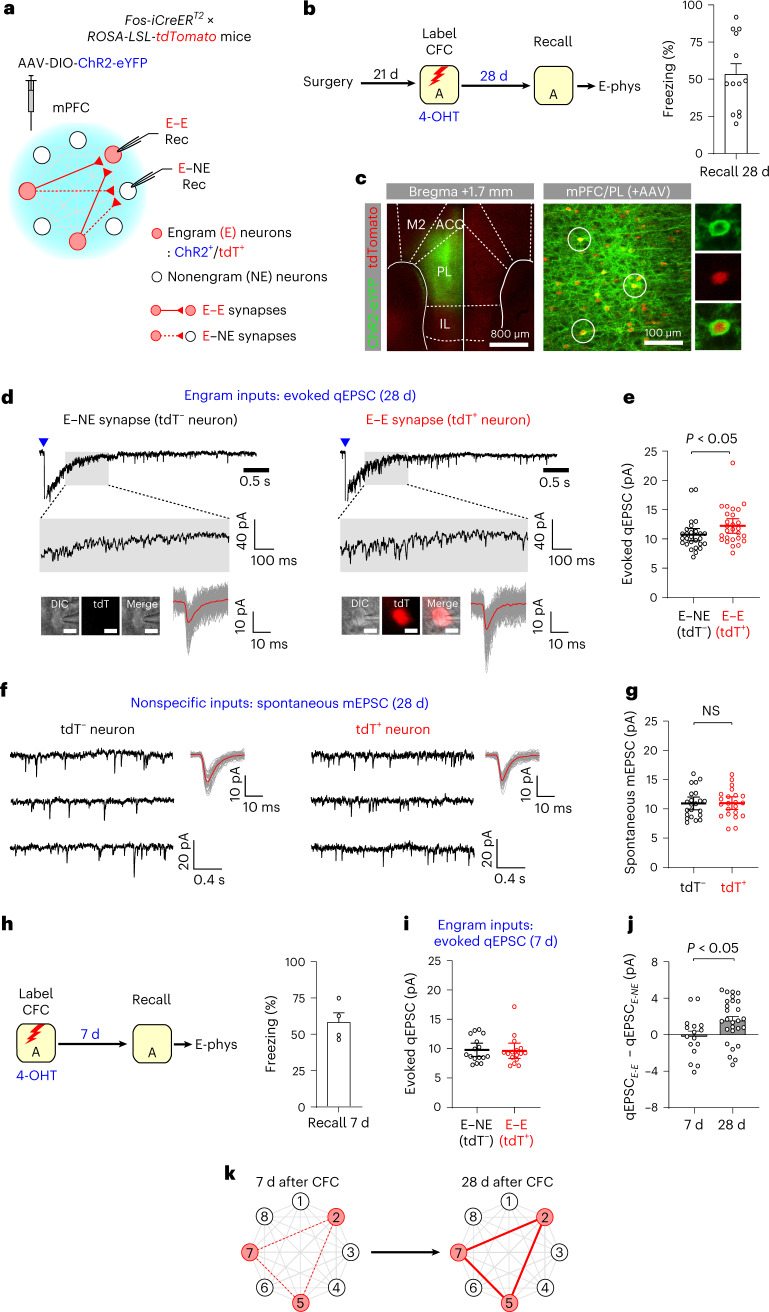
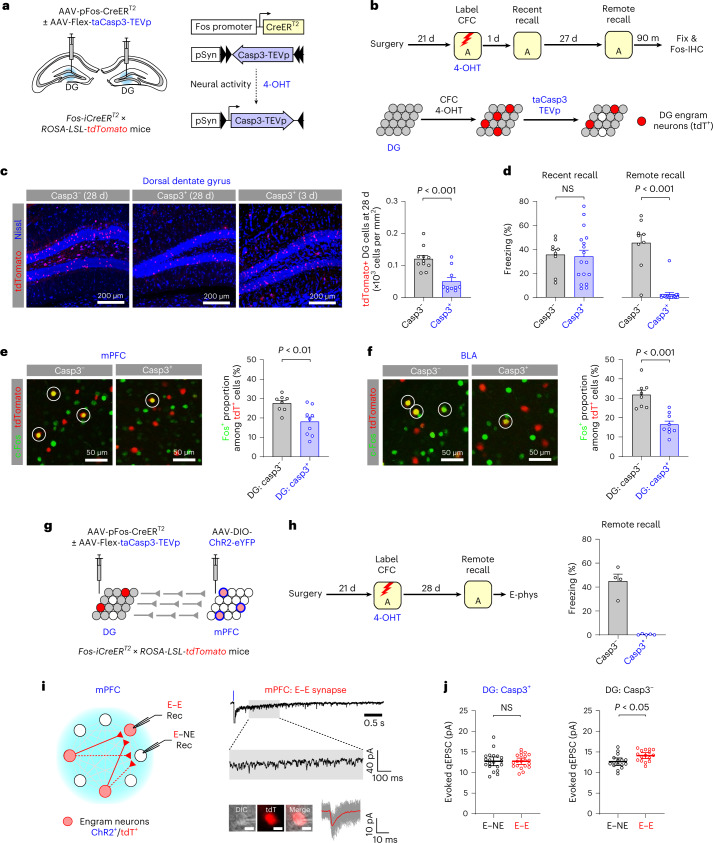
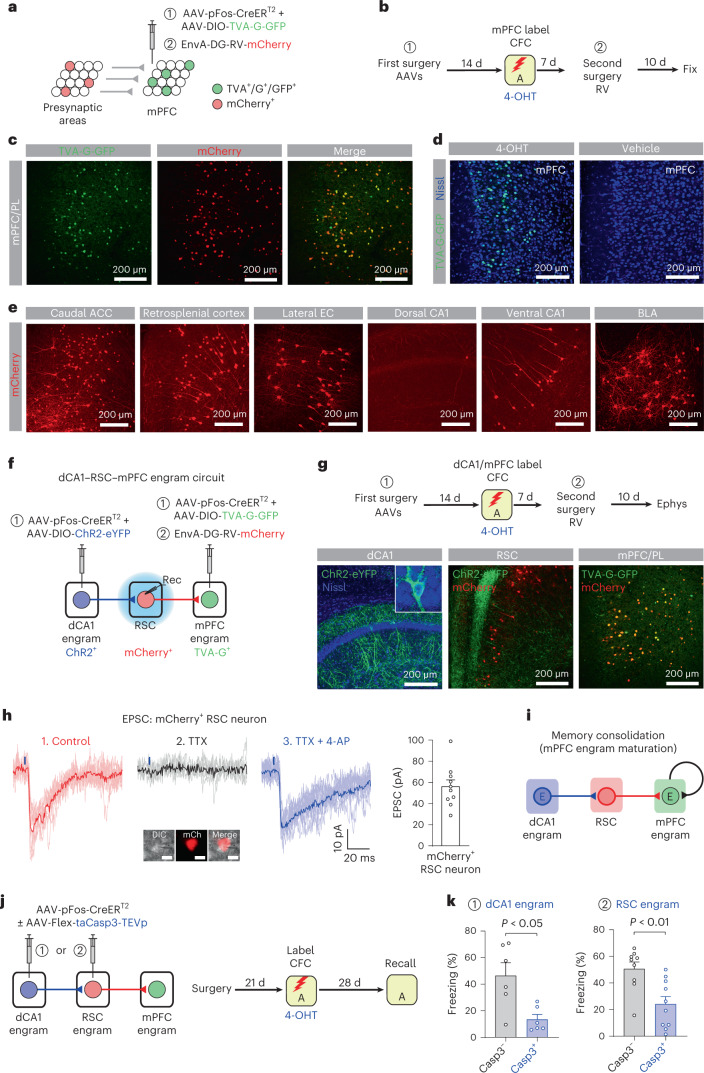
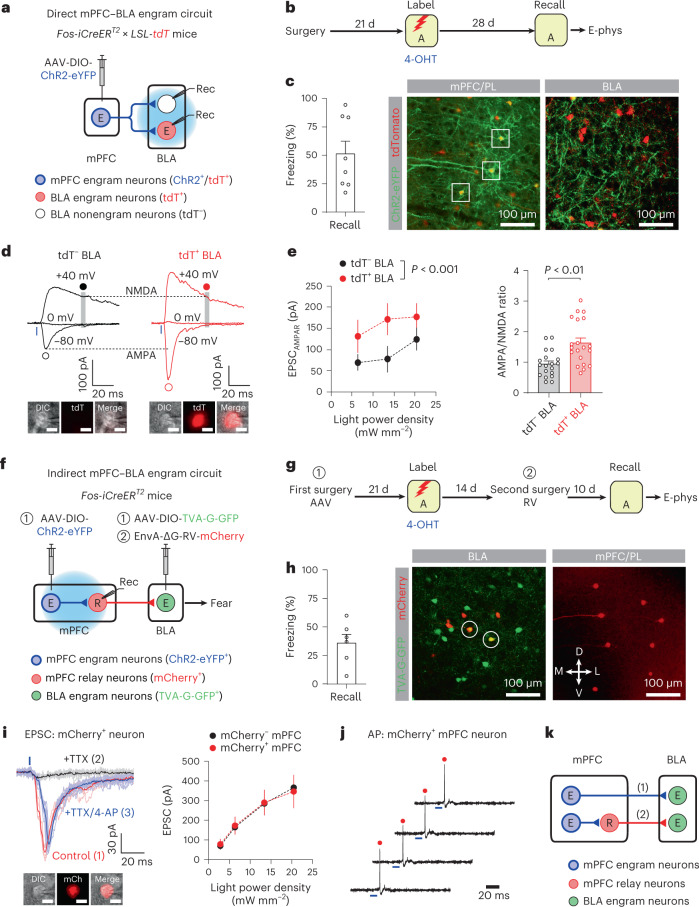
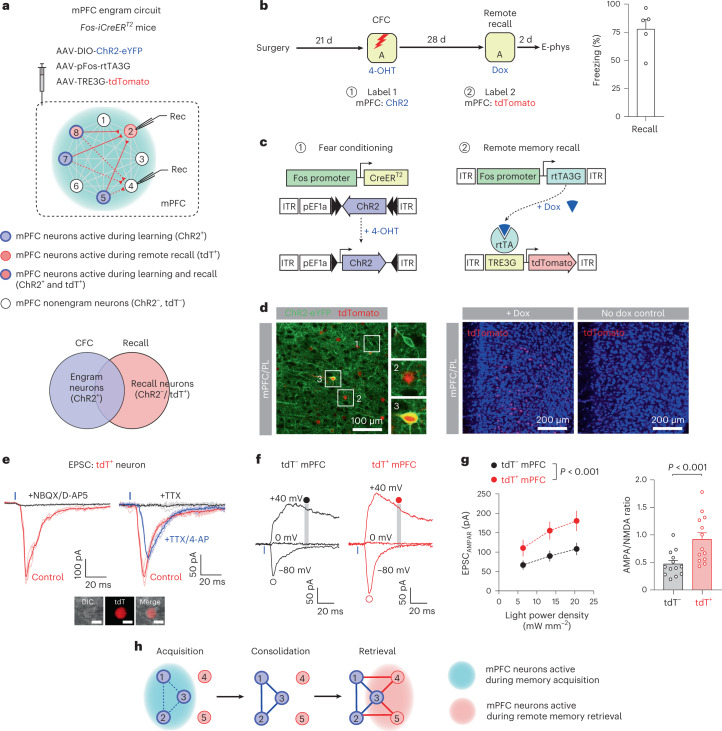
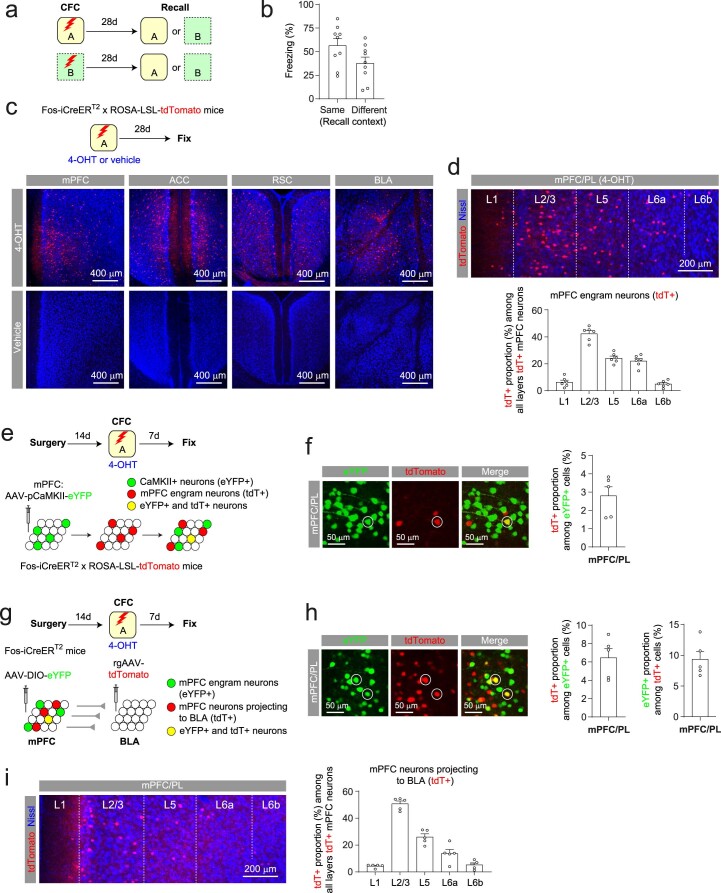
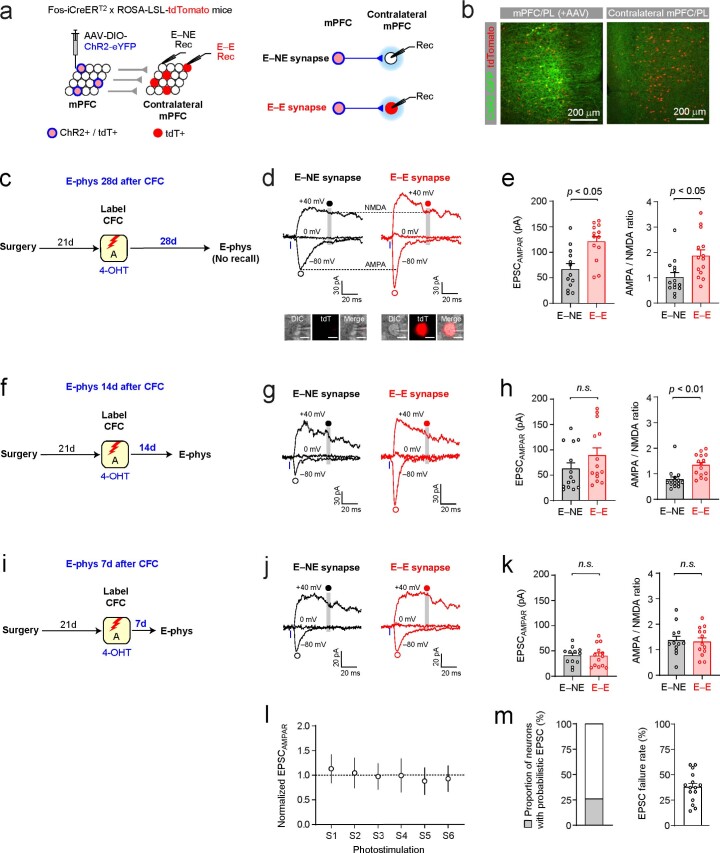
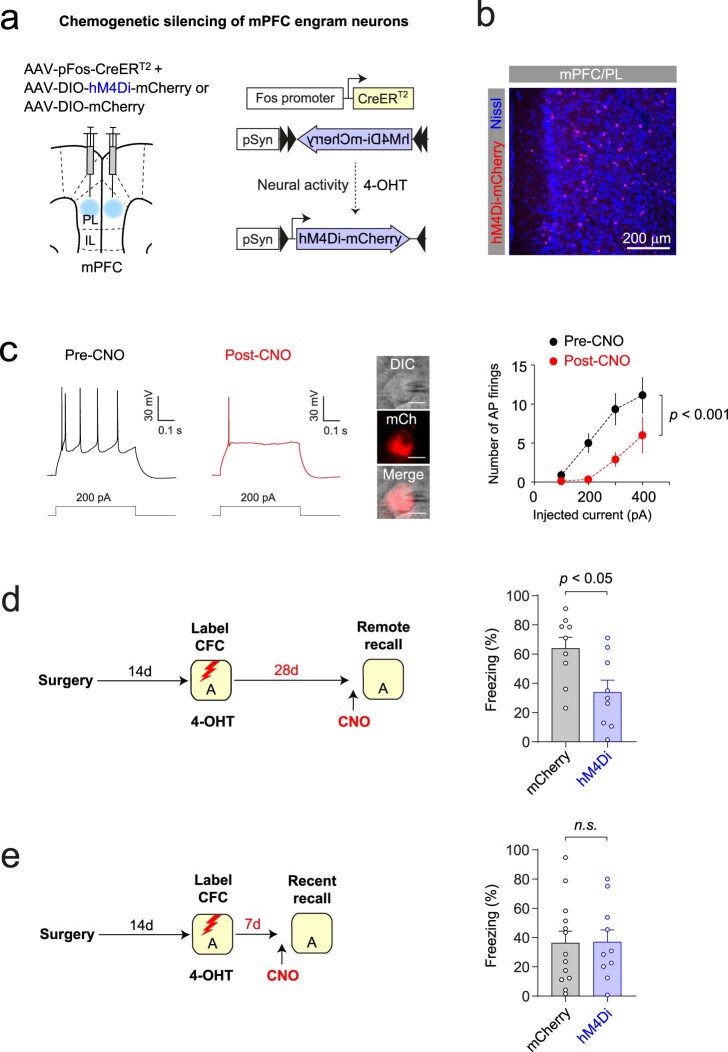
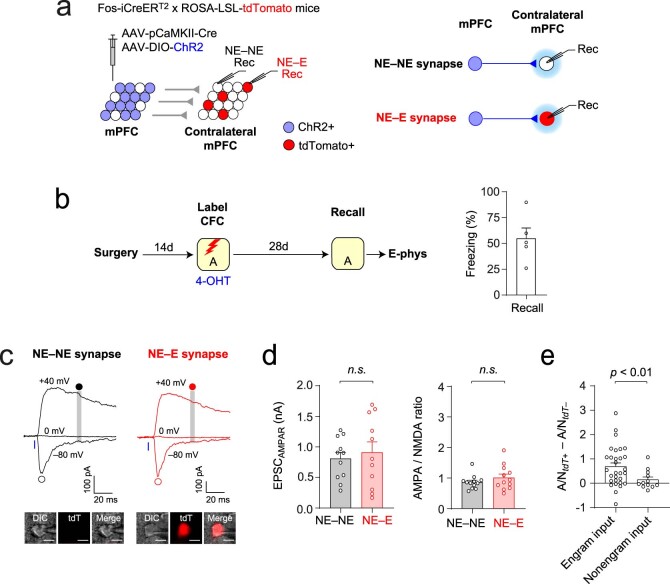
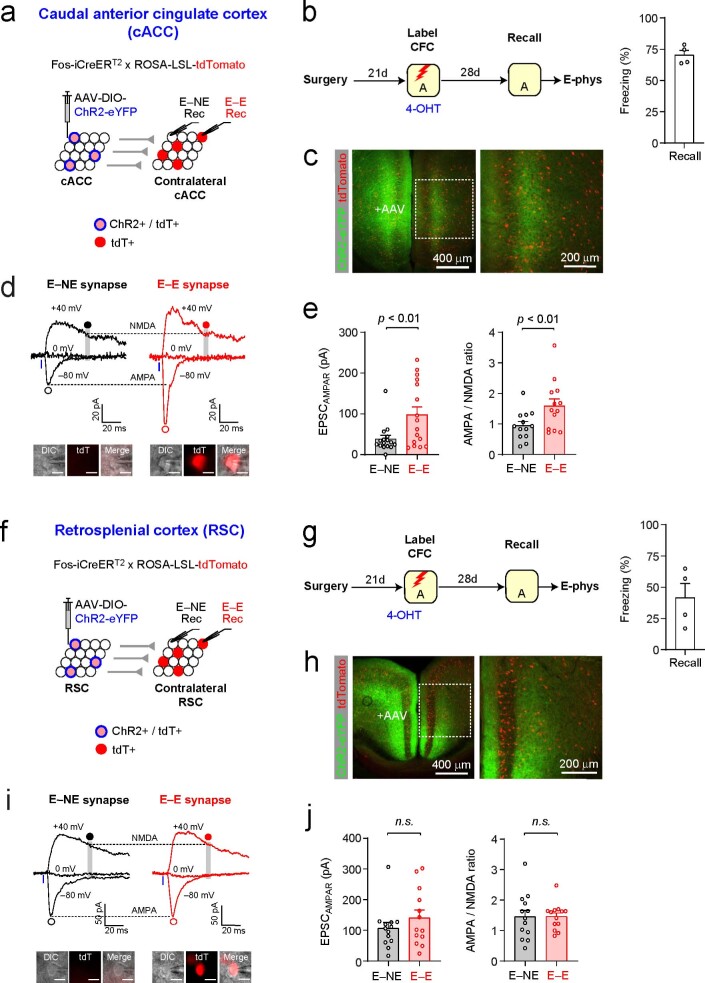
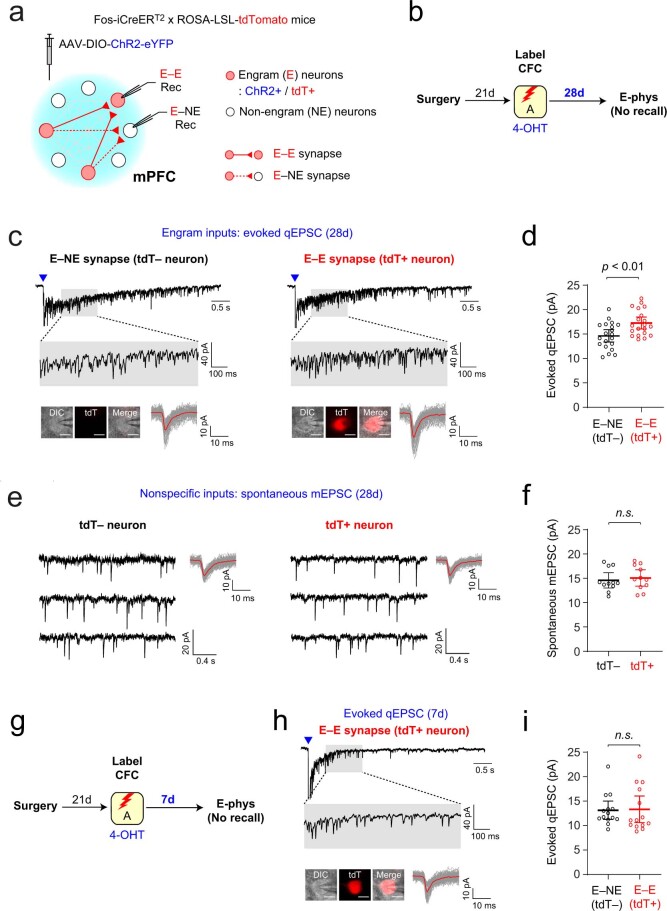
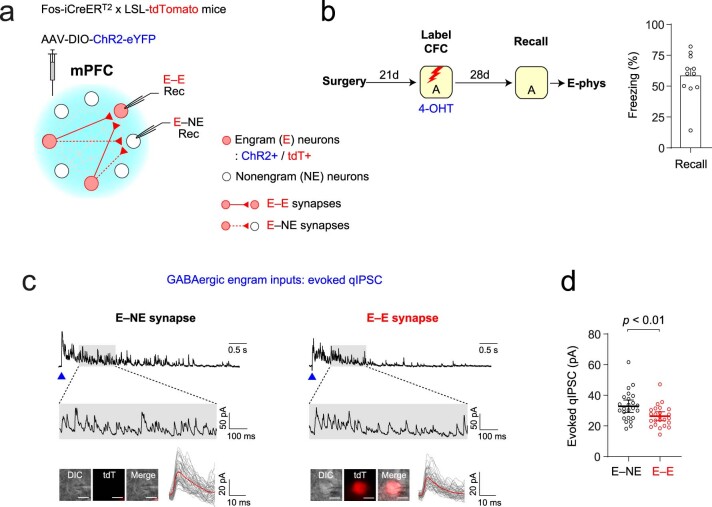
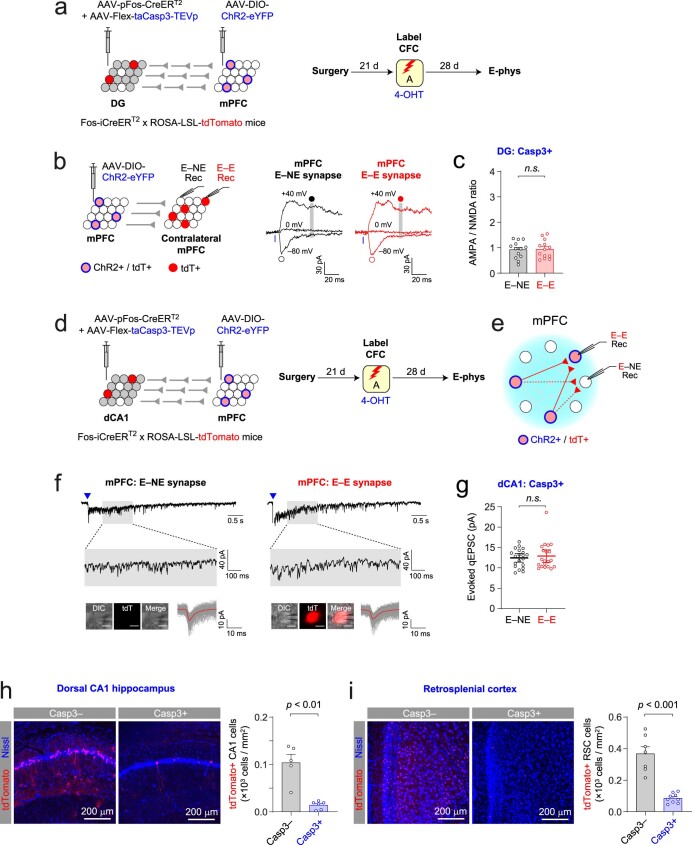
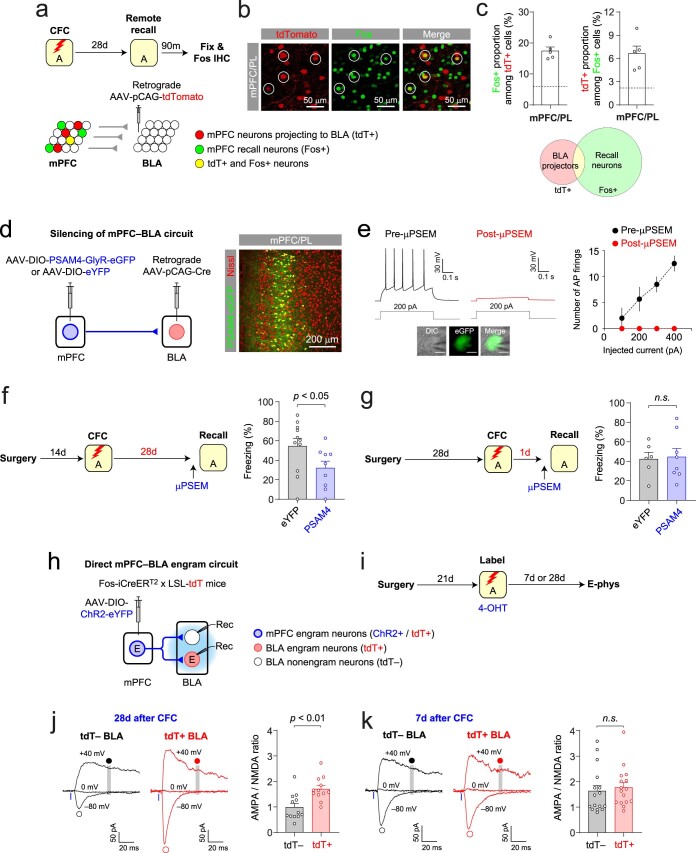
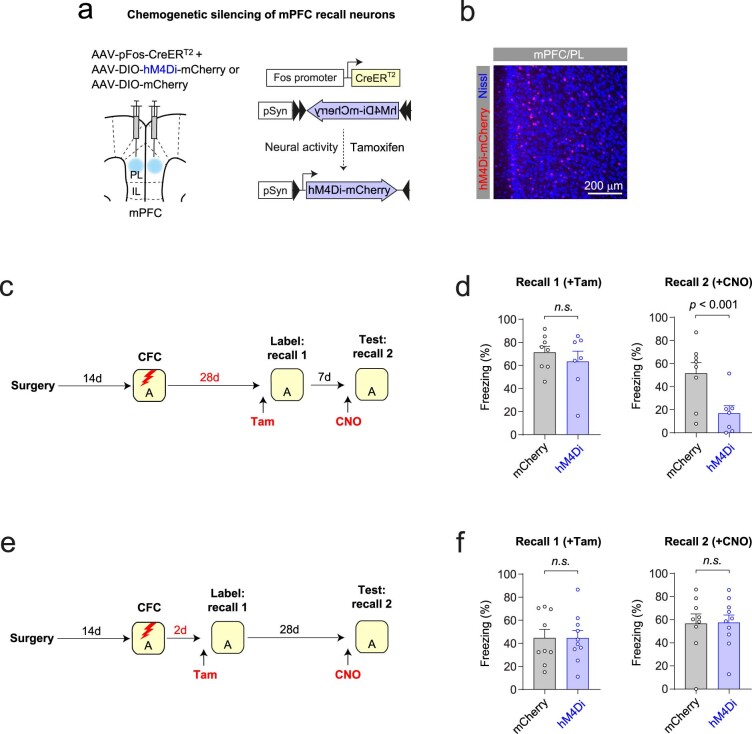
While initial encoding of contextual memories involves the strengthening of hippocampal circuits, these memories progressively mature to stabilized forms in neocortex and become less hippocampus dependent. Although it has been proposed that long-term storage of contextual memories may involve enduring synaptic changes in neocortical circuits, synaptic substrates of remote contextual memories have been elusive. Here we demonstrate that the consolidation of remote contextual fear memories in mice correlated with progressive strengthening of excitatory connections between prefrontal cortical (PFC) engram neurons active during learning and reactivated during remote memory recall, whereas the extinction of remote memories weakened those synapses. This synapse-specific plasticity was CREB-dependent and required sustained hippocampal signals, which the retrosplenial cortex could convey to PFC. Moreover, PFC engram neurons were strongly connected to other PFC neurons recruited during remote memory recall. Our study suggests that progressive and synapse-specific strengthening of PFC circuits can contribute to long-term storage of contextual memories.


Conflict of interest statement

The authors declare no competing interests.

Figures

Fig. 1
Fig. 1. Activity-dependent labeling identified mPFC engram neurons, whose reactivation resulted in memory recall.
a,b, Experimental setup for cg. Active neurons expressed tdT in Fos-iCreERT2 × ROSA-LSL-tdTomato mice. Neurons active in the HC were labeled in the HC group (10 mice), whereas neurons active during CFC were labeled in the CFC group (11 mice). After remote memory recall test, brain tissues were immunolabeled for c-Fos. c, Freezing behavior during remote memory recall. NS, not significant. d, Images showing mPFC/PL neurons labeled with tdT (red) or c-Fos (green). Neurons labeled with both tdT and c-Fos are circled. e, Comparisons of the tdT+ cell density, c-Fos+ cell density and c-Fos+ proportion among all tdT+ neurons in the mPFC/PL. Unpaired t test (HC group: eight mice, CFC group: seven mice). f, Images showing BLA neurons labeled with tdT (red) or c-Fos (green). g, Comparisons of the tdT+ cell density, c-Fos+ cell density and c-Fos+ proportion among all tdT+ neurons in the BLA. Unpaired t-test (HC group: six mice, CFC group: seven mice). h, Experimental setup for (il). mPFC neurons active during CFC expressed ChR2-eYFP or eYFP. i, Four weeks after CFC, the mice received 5 Hz photostimulation in Context B. j, Image showing optical cannula tips (arrows) and ChR2-eYFP+ mPFC neurons (green). k,l, Summary plot showing the average freezing time in the presence and absence of photostimulation in the ChR2 (13 mice) and eYFP groups (nine mice). Repeated measures two-way ANOVA with post hoc comparisons (group × behavioral session interaction, P < 0.01). Data are presented as the mean ± s.e.m. Details of the statistical analyses are presented in Supplementary Tables 1 and 2. Source data
Fig. 2
Fig. 2. Progressive strengthening of interhemispheric excitatory connections between mPFC engram neurons during remote memory consolidation.
a, Photostimulation activated ChR2+ engram inputs. Postsynaptic responses recorded in tdT nonengram (E–NE synapses) and tdT+ engram neurons (E–E synapses). b, Engram neurons in the AAV-injected mPFC (1) expressed ChR2-eYFP (green) and tdT (red). ChR2-eYFP+ axons and tdT+ engram neurons were detected in the contralateral mPFC (2). c, Experimental setup for d and e. Four weeks after CFC, mice were tested for remote fear memory recall (11 mice) and recording experiments were performed. d, Traces of EPSCs in E–NE (black) and E–E synapses (red). Blue light (blue bars) activated ChR2+ engram inputs and induced EPSCs recorded in a tdT nonengram neuron and an adjacent tdT+ engram neuron (red, inset; scale bar, 10 μm). EPSCs were recorded at –80, 0, and +40 mV in voltage-clamp mode in the presence of SR-95531. AMPAR EPSCs were recorded at –80 mV (open circles). NMDAR EPSCs were recorded at +40 mV (gray vertical lines and closed circles). e, Left: comparison of AMPAR EPSC (EPSCAMPAR) induced by the photostimulation of the same intensity (20.5 mW mm2). Right: comparison of the AMPA/NMDA ratios. n = 32 (E–NE) and 31 (E–E). Two-way ANOVA with post hoc comparisons was used to analyze combined data in e and h. f, Experimental setup for g and h. Seven days after CFC, mice were tested for fear memory recall (11 mice), and recording experiments were performed. g, Traces of EPSCs in E–NE (black) and E–E synapses (red) induced and recorded as in d. h, Comparison of EPSCAMPAR (left) and the AMPA/NMDA (right) ratios. n = 17 neurons/group. i, Comparison of difference in the AMPA/NMDA (A/N) ratio between E–NE and E–E synapses in mice examined 7 d (10 pairs), 14 d (15 pairs) and 28 d (30 pairs) after CFC. Data are presented as the mean ± s.e.m. Details of the statistical analyses are presented in Supplementary Table 2. Source data
Fig. 3
Fig. 3. Strengthening of mPFC engram circuit required CREB and remote memory extinction weakened mPFC engram circuit.
a, Experimental setup for bd. Photostimulation of ChR2+ engram inputs induced EPSCs in nonengram (tdT/MutCREB, E–NE synapses) and engram neurons (tdT+/MutCREB or tdT+/MutCREB+, E–E synapses). b, Top: 28 d after CFC, recording experiments were performed. Bottom: images showing ChR2-eYFP+ (green) and/or tdT+ (red) mPFC engram neurons (left) and those labeled with mGFP-MutCREB (green) and/or tdT+ (red) in contralateral mPFC (right). c, Traces of EPSCs in E–NE (tdT/MutCREB, black), E–E (tdT+/MutCREB, red) and E–E synapses (tdT+/MutCREB+, blue). AMPAR EPSCs and NMDAR EPSCs were recorded as in Fig. 2d. Scale bar, 10 μm (inset). d, Comparison of AMPA/NMDA ratios between E–NE (18 cells), E–E (tdT+/MutCREB, 13 cells) and E–E synapses (tdT+/MutCREB+, 18 cells). One-way ANOVA with post hoc comparisons (**P < 0.01, ***P < 0.001). e, Experimental setup for f. mPFC engram neurons expressed mGFP-MutCREB or eYFP. Mice were tested for memory recall 28 d after CFC. f, Left: image showing mGFP-MutCREB+ mPFC neurons (green). Right: freezing behavior during memory recall in MutCREB (15 mice) and eYFP groups (13 mice). Unpaired t-test. g, Experimental setup for hj. Photostimulation of mPFC engram inputs induced EPSCs in tdT nonengram (E–NE synapses) and tdT+ engram neurons (E–E synapses). h, Left: 28 d after CFC, mice received extinction training for 5 d (Ex1-5). Right: freezing behavior during extinction training (eight mice). i, Traces of EPSCs in E–NE (black) and E–E synapses (red). j, Comparison of EPSCAMPAR (24 cells for E–NE, 26 cells for E–E synapses) and AMPA/NMDA ratio (28 cells for E–NE, 32 cells for E–E synapses). Unpaired t-test. k, Average difference in AMPA/NMDA ratio between tdT+ and tdT neurons in each mouse positively correlated with freezing behavior (Pearson correlation test). In the extinction group (eight mice), freezing scores during the last extinction session were used. In the no extinction group (11 mice), data in Fig. 2c–e were used. Gray shaded area indicates 95% confidence bands on the best-fitting regression line. Data are presented as the mean ± s.e.m. Details of the statistical analyses are presented in Supplementary Tables 1 and 2. Source data
Fig. 4
Fig. 4. Progressive strengthening of local recurrent excitatory connections between mPFC engram neurons during remote memory consolidation.
a, Photostimulation activated local recurrent axons of ChR2+ engram neurons and induced postsynaptic responses recorded in engram (tdT+, E–E synapses) and nonengram neurons (tdT, E–NE synapses). b, Experimental setup for cg. Four weeks after CFC, the mice were tested for remote memory recall (13 mice). c, Images showing ChR2-eYFP+ (green) and tdT+ (red) mPFC engram neurons. d, Traces of evoked qEPSCs induced by the photostimulation (blue triangles) of local recurrent engram inputs and recorded in tdT nonengram (E–NE synapses) and tdT+ engram neurons (E–E synapses). The average qEPSC (red) was overlaid onto individual qEPSCs (gray). Scale bar, 10 μm (inset). e, Comparison of the average peak amplitude of evoked qEPSCs recorded in 27 pairs of nonengram (E–NE synapses) and engram neurons (E–E synapses). Two-way ANOVA with post hoc comparisons was used to analyze combined data in e and g. f, Traces of spontaneous mEPSCs in nonspecific inputs to tdT nonengram and tdT+ engram neuron. mEPSCs were recorded at −80 mV in the presence of TTX. Average mEPSCs (red) were overlaid onto individual mEPSCs (gray). g, Comparison of the peak amplitude of spontaneous mEPSCs recorded in 22 pairs of nonengram and engram neurons. h, Experimental setup for i. Seven days after CFC, the mice were tested for memory recall (four mice). i, Comparison of the peak amplitude of evoked qEPSCs recorded in 16 pairs of nonengram (E–NE synapses) and engram neurons (E–E synapses) 7 d after CFC. j, Comparison of difference in evoked qEPSC amplitude between E–NE and E–E synapses in mice examined 7 d (16 pairs) versus 28 d after CFC (27 pairs). Unpaired t-test. k, Local recurrent excitatory connections between mPFC engram neurons were gradually strengthened during systems consolidation. Data are presented as the mean ± s.e.m. in b, h and j, whereas data are presented as the mean ± 95% confidence interval in e, g and i. Details of the statistical analyses are presented in Supplementary Tables 1 and 2. Source data
Fig. 5
Fig. 5. Ablation of DG engram neurons after learning inhibited the reactivation of mPFC engram neurons during memory recall and the strengthening of mPFC engram circuit.
a, Experimental setup for bf. b, Top: mice were tested for memory recall 1 and 28 d after CFC. Brain tissues were immunolabeled for c-Fos (Fos-IHC) after remote memory recall. Bottom: in Casp3+ group, DG engram neurons expressed tdT and taCasp3-TEVp (red circles), resulting in cell death (open circles). c, Left: Casp3-mediated cell death resulted in lower tdT+ DG cell density in Casp3+ group than in Casp3 group 28 d but not 3 d after CFC. Right: tdT+ DG cell density in Casp3+/28 d (10 mice) versus Casp3/28 d groups (11 mice). Unpaired t-test. d, Freezing behavior during memory recall in Casp3+ (17 mice) and Casp3 groups (nine mice). Repeated measures ANOVA with post hoc comparisons. e, Left: images showing tdT+ and/or c-Fos+ mPFC/PL neurons. Both tdT+ and c-Fos+ neurons are circled. Right: c-Fos+ proportion among all tdT+ mPFC/PL neurons in Casp3 (eight mice) and Casp3+ groups (nine mice). Unpaired t-test. f, Left: images showing tdT+ and/or c-Fos+ BLA neurons. Right: c-Fos+ proportion among all tdT+ BLA neurons in Casp3 (eight mice) and Casp3+ groups (nine mice). Unpaired t-test. g, Experimental setup for hj. DG engram neurons underwent cell death in Casp3+ group. mPFC engram neurons expressed ChR2-eYFP and tdT. h, Mice in Casp3+ (five mice) and Casp3 groups (four mice) were tested for memory recall 28 d after CFC. i, Left: photostimulation activated local recurrent axons of ChR2+ engram neurons and induced qEPSCs in nonengram (E–NE synapses) and tdT+ engram neurons (E–E synapses) as in Fig. 4d. Right: trace of evoked qEPSCs in E–E synapses. Scale bar, 10 μm (inset). j, Comparison of qEPSC amplitude between nonengram (E–NE synapses) and engram neurons (E–E synapses) in Casp3+ group (20 pairs, left) and in Casp3 group (16 pairs, right). Paired t-test. Data are presented as the mean ± s.e.m. in c, d, e, f and h or as the mean ± 95% confidence interval in j. Details of statistical analyses are presented in Supplementary Tables 1 and 2. Source data
Fig. 6
Fig. 6. RSC connected hippocampal CA1 engram neurons to mPFC engram neurons.
a, Experimental setup for be. mPFC engram neurons expressed TVA-G-GFP, whereas neurons monosynaptically projecting to mPFC engram neurons expressed mCherry. b, After the injection of AAV-pFos-CreERT2 and AAV-DIO-TVA-G-GFP into mPFC, mice underwent CFC and received 4-OHT injection. After 1 week, EnvA-ΔG-RV-mCherry was injected into mPFC. c, Images showing TVA-G-GFP + mPFC neurons (green) and RV-infected mCherry+ mPFC neurons (red). d, TVA-G-GFP (green) was expressed in mPFC engram neurons in mice that received 4-OHT but not vehicle injection after CFC. e, Images showing mCherry+ neurons in cACC, RSC, lateral EC, ventral CA1 and BLA. Note few mCherry+ neurons in dorsal CA1. f, Experimental setup for gh. mPFC engram neurons expressed TVA-G-GFP, whereas dCA1 engram neurons expressed ChR2-eYFP. RSC neurons projecting to mPFC engram neurons expressed mCherry. g, Top: after injection of AAVs into mPFC and dCA1, mice underwent CFC and received RV injection into mPFC. Bottom: images showing ChR2-eYFP+dCA1 engram neurons (green, left) and TVA-G-GFP+ mPFC engram neurons (green, right). Middle panel shows mCherry+ RSC neurons (red) and ChR2-eYFP+ dCA1 axons (green). h, Left: traces of EPSCs induced by photostimulation of dCA1 engram inputs and recorded in mCherry+ RSC neurons at −80 mV (red). TTX completely blocked EPSCs (black). Subsequent 4-AP application in the presence of TTX rescued EPSCs (blue). Scale bar, 10 μm (inset). Right: plot of EPSC amplitudes in dCA1 engram inputs to mCherry+ RSC neurons. i, RSC connects dCA1 engram neurons to mPFC engram neurons. dCA1−RSC−mPFC engram circuit can contribute to remote memory consolidation. j, Experimental setup for k. dCA1 or RSC engram neurons active during CFC underwent Casp3-mediated cell death in Casp3+ but not Casp3 group. Mice were tested for memory recall 28 d after CFC. k, Comparison of freezing behavior during remote memory recall between Casp3+ and Casp3 groups for the ablation of dCA1 (left, six mice per group) and RSC engram (right, 10 mice for Casp3+ and 9 mice for Casp3). Unpaired t-test. Data are presented as the mean ± s.e.m. Details of the statistical analyses are presented in Supplementary Table 1. Source data
Fig. 7
Fig. 7. mPFC engram neurons were connected to BLA engram neurons through direct and indirect pathways for remote fear memory recall.
a, Experimental setup for be. Photostimulation activated mPFC engram inputs and induced EPSCs in tdT nonengram and tdT+ engram BLA neurons. b, Mice were tested for memory recall 28 d after CFC. c, Left: freezing behavior during memory recall (eight mice). Middle: image showing ChR2-eYFP+/tdT+ mPFC neurons (squares). Right: image showing ChR2-eYFP+ mPFC axons (green) and tdT+ BLA neurons (red). d, Traces of EPSCs induced by photostimulation of mPFC engram inputs and recorded in tdT and tdT+ BLA neurons. AMPAR and NMDAR EPSCs were recorded as in Fig. 2d. Scale bar, 10 μm. e, Left: comparison of EPSCAMPAR in 20 pairs of tdT versus tdT+ BLA neurons. Repeated measures two-way ANOVA. Right: comparison of AMPA/NMDA ratios of EPSCs in tdT (19 cells) versus tdT+ BLA neurons (20 cells). Unpaired t-test. f, Experimental setup for gj. mPFC engram neurons expressed ChR2-eYFP, whereas BLA engram neurons expressed TVA-G-GFP. mPFC relay neurons (R, red) were labeled with mCherry. Photostimulation activated ChR2+ mPFC engram inputs and induced EPSCs in mPFC relay neurons. g, After AAV injection, mice underwent CFC and received RV injection. h, Left: freezing behavior during memory recall (six mice). Middle: BLA engram neurons were labeled with TVA-G-GFP and/or mCherry. TVA-G-GFP+/mCherry+ neurons are circled. Right: image showing mCherry+ mPFC relay neurons. i, Left: EPSCs were induced by photostimulation of mPFC engram inputs and recorded in mCherry+ mPFC relay neurons (red). TTX blocked EPSCs (black), which were rescued by 4-AP (blue). Scale bar, 10 μm. Right: comparison of EPSC amplitude in mCherry+ versus mCherry mPFC neurons (11 pairs) in the presence of TTX, 4-AP and SR-95531. j, Photostimulation (blue) of mPFC engram inputs induced AP firings (red) in mCherry+ mPFC relay neurons in cell-attached mode in the presence of SR-95531. k, mPFC engram neurons project to BLA engram neurons monosynaptically (1) or are connected to BLA engram neurons through mPFC relay neurons (2). Data are presented as the mean ± s.e.m. Details of the statistical analyses are presented in Supplementary Tables 1 and 2. Source data
Fig. 8
Fig. 8. mPFC neurons active during initial learning were strongly connected to mPFC neurons recruited during remote memory recall.
a, Experimental setup. mPFC engram neurons active during CFC expressed ChR2-eYFP (blue). mPFC recall neurons active during remote memory recall expressed tdT (red). b, Left: mice received 4-OHT injection after CFC (label 1). After 28 d, they received Dox injection and were tested for memory recall (label 2). Right: freezing behavior during remote memory recall (five mice). c, Left: mPFC neurons active during CFC expressed iCreERT2, resulting in 4-OHT-dependent recombination and ChR2 expression. Right: mPFC neurons active during remote memory recall expressed rtTA3G, resulting in tdT expression in the presence of Dox. d, Left: images showing mPFC neurons expressing ChR2-eYFP (green, 1), tdT (red, 2) or both (3). Right: mPFC recall neurons expressed tdT in Dox-injected mice. e, Traces of EPSCs induced by photostimulation of ChR2+ axons and recorded in tdT+/ChR2 mPFC neurons (red) at −80 mV. Left: EPSCs were inhibited by NBQX and D-AP5 (black). Right: TTX blocked EPSCs (black), which were rescued by 4-AP (blue). Scale bar, 10 μm. f, Traces of EPSCs induced by photostimulation and recorded in tdT/ChR2 mPFC neuron (black) and tdT+/ChR2 mPFC recall neurons (red). AMPAR EPSCs and NMDAR EPSCs were recorded as in Fig. 2d. TTX and 4-AP were added to isolate monosynaptic EPSCs. g, Left: comparison of the amplitude of EPSCAMPAR recorded in tdT/ChR2 versus tdT+/ChR2 neurons (15 pairs). Repeated measures two-way ANOVA. Right: comparison of AMPA/NMDA ratio between tdT/ChR2 versus tdT+/ChR2 neurons (13 pairs). Paired t-test. h, Left: some mPFC neurons (neurons 1–3) are recruited during learning (memory acquisition). These engram neurons are weakly connected to one another. Middle: excitatory connections between mPFC engram neurons are strengthened during systems consolidation (blue lines). Right: remote memory recall reactivates some mPFC engram neurons (neuron 3), while it also activates mPFC recall neurons (neurons 4 and 5), which receive stronger inputs of mPFC engram neurons (red lines) than other mPFC neurons. Data are presented as the mean ± s.e.m. Details of the statistical analyses are presented in Supplementary Tables 1 and 2. Source data
Extended Data Fig. 1
Extended Data Fig. 1. Labeling of mPFC engram neurons and their proportions among all CaMKII+ neurons and among all BLA projectors.
(a) Mice were fear conditioned in Context A or B and tested for remote memory recall in the same (9 mice) or different context (9 mice). (b) Quantification of freezing behavior during remote memory recall as in (a). Mice tested in the same contexts tended to display more freezing behavior than mice tested in different contexts (p = 0.07, unpaired t-test). (c) Neurons active during CFC (engram neurons) were labeled with tdTomato (tdT). Images show tdT+ neurons (red) in mPFC, caudal anterior cingulate cortex (ACC), retrosplenial cortex (RSC), and basolateral amygdala (BLA) in mice that received 4-OHT but not vehicle injection after CFC (Blue: Nissl stain). (d) Top: tdT+ neurons (red) in different mPFC/PL layers in 4-OHT-injected mice in (c). Bottom: proportion of tdT+ neurons in each mPFC/PL layer among all tdT+ neurons (6 mice). (e) Experimental setup for (f). CaMKII+ mPFC pyramidal neurons expressed eYFP, whereas neurons active during CFC expressed tdT. (f) Left: eYFP+ (green) or tdT+ (red) mPFC/PL neurons. A both eYFP+ and tdT+ neuron is circled. Right: proportion of tdT+ neurons among all eYFP+ mPFC neurons (5 mice). (g) Experimental setup for (h)-(i). mPFC neurons projecting to BLA (BLA projectors) were retrogradely labeled with tdT. mPFC neurons active during CFC expressed eYFP. (h) Left: tdT+ (red) or eYFP+ (green) mPFC/PL neurons. Both tdT+ and eYFP+ neurons are circled. Middle: proportion of tdT+ neurons among all eYFP+ mPFC neurons. Right: proportion of eYFP+ neurons among all tdT+ mPFC neurons (5 mice). (i) Left: BLA projectors (tdT+, red) in different mPFC/PL layers. Right: proportion of BLA projectors in each mPFC/PL layer among all BLA projectors in mPFC (5 mice). Data are presented as the mean ± SEM. Source data
Extended Data Fig. 2
Extended Data Fig. 2. Progressive strengthening of interhemispheric excitatory connections between mPFC engram neurons during remote memory consolidation.
(a) Photostimulation activated ChR2+ engram inputs. EPSCs were recorded in tdT− nonengram (E−NE synapses) and tdT+ engram neurons (E−E synapses) in contralateral mPFC. (b) Left: ChR2-eYFP+ (green) and tdT+ (red) engram neurons in AAV-injected mPFC. Right: ChR2-eYFP+ axons and tdT+ engram neurons in contralateral mPFC. (c) Experimental setup for (d, e). Four weeks after CFC, electrophysiological experiments (E-phys) were performed without memory recall (4 mice). (d) Traces of EPSCs in E−NE and E−E synapses. EPSCs were induced and recorded as in Fig. 2d. (e) Left: comparison of EPSCAMPAR induced by 20.5 mW/mm2 photostimulation in tdT− and tdT+ neurons (13 pairs). Right: comparison of AMPA/NMDA ratios (14 pairs). Paired t-test. (f) Experimental setup for (g, h). Two weeks after CFC, recording experiments were performed (4 mice). (g) Traces of EPSCs in E−NE and E−E synapses. (h) Comparison of EPSCAMPAR (14 pairs of tdT− and tdT+ neurons) and AMPA/NMDA ratios (15 pairs). Paired t-test. (i) Experimental setup for (j)-(k). Seven days after CFC, recording experiments were performed without memory recall (4 mice). (j) Traces of EPSCs in E−NE and E−E synapses. (k) Comparison of EPSCAMPAR (12 pairs of tdT− and tdT+ neurons) and AMPA/NMDA ratios (12 pairs). Paired t-test. (l) Quantification of peak amplitudes of EPSCAMPAR induced by 6 photostimulations (S1-S6, 20 s interval) and normalized to average peak amplitude in each neuron (57 neurons, data from (i–k) and Fig. 2f–h). (m) In 26.3% of 57 neurons examined in (l), photostimulation did not induce EPSC at least once (left), and EPSCs were probabilistic with an average failure rate of 37.8 ± 4.8%. Data are presented as the mean ± SEM in (e), (h), (k), and (m) or as the mean ± standard deviation in (l). Source data
Extended Data Fig. 3
Extended Data Fig. 3. Chemogenetic silencing of mPFC engram neurons inhibited remote but not recent memory recall.
(a) Experimental setup. A mixture of AAV-pFos-CreERT2 and AAV-DIO- hM4Di-mCherry (hM4Di group) or AAV-DIO-mCherry (mCherry group) was bilaterally injected to the mPFC. mPFC engram neurons active during CFC expressed hM4Di-mCherry or mCherry. (b) Image showing mPFC engram neurons expressing hM4Di-mCherry (red). Blue fluorescence indicates Nissl stain. (c) Left: traces of AP firing before (pre-CNO) and 5 minutes after CNO application (10 μM, post-CNO). AP firing was induced by depolarizing current injection (500 ms long) and recorded in the same hM4Di-mCherry (mCh)-expressing mPFC neuron (inset; scale bar, 10 μm) in current-clamp mode. Right: summary plot of AP firing in 9 mPFC neurons expressing hM4Di-mCherry. *** p < 0.001 (pre-CNO versus post-CNO, repeated measures two-way ANOVA). (d) Left: mPFC engram neurons active during CFC in Context A were labeled with hM4Di-mCherry or mCherry. Four weeks after CFC, the mice received a CNO injection and were tested for fear memory recall in the same context 45–60 minutes later. Right: summary plot showing the average freezing time in the hM4Di (9 mice) and mCherry groups (9 mice). Unpaired t-test. (e)Left: mPFC engram neurons active during CFC in Context A were labeled with hM4Di-mCherry or mCherry. Seven days after CFC, the mice received a CNO injection and were tested for fear memory recall in the same context 45–60 minutes later. Right: summary plot showing the average freezing time in the hM4Di (10 mice) and mCherry groups (13 mice). Unpaired t-test. Data are presented as the mean ± SEM. Source data
Extended Data Fig. 4
Extended Data Fig. 4. mPFC nonengram inputs to mPFC engram neurons were not strengthened after remote memory consolidation.
(a) Left: AAV-pCaMKII-Cre and AAV-DIO-ChR2-eYFP were unilaterally injected into the mPFC/PL in Fos-iCreERT2 × ROSA-LSL-tdTomato mice. ChR2-eYFP was globally expressed in CaMKII+ pyramidal neurons of the AAV-injected mPFC (blue), whereas mPFC engram neurons expressed tdT (red). Right: in the contralateral mPFC, photostimulation activated ChR2+ axons of nonengram mPFC neurons. Postsynaptic responses recorded in nonengram (NE, tdT−) and engram neurons (E, tdT+) reflected those in nonengram inputs to nonengram neurons (NE−NE synapses) and to engram neurons (NE−E synapses), respectively. (b) Left: mice were fear conditioned in Context A and received a 4-OHT injection to label mPFC engram neurons with tdT. They were tested for contextual memory recall 28 days later. Right: quantification of freezing behavior during memory recall (5 mice). (c) Representative traces of EPSCs in NE−NE (black) and NE−E synapses (red). EPSCs were induced by the photostimulation (blue bars) of nonengram mPFC inputs and recorded in a pair of tdT− nonengram (NE−NE synapses) and tdT+ engram neurons (NE−E synapses). AMPAR and NMDAR EPSCs were recorded and quantified as in Fig. 2d. Scale bar, 10 μm (inset). (d) Left: comparison of the peak amplitude of AMPAR EPSC (EPSCAMPAR) induced by photostimulation of the same intensity (20.5 mW/mm2) and recorded in 11 pairs of nonengram (NE−NE synapses) versus engram neurons (NE−E synapses). Right: comparison of AMPA/NMDA ratios in 12 pairs of nonengram (NE−NE synapses) versus engram neurons (NE−E synapses). n.s., nonsignificant. Paired t-test. (e) Comparison of difference in AMPA/NMDA (A/N) ratio between E−NE and E−E synapses (engram inputs; 30 pairs, data from Fig. 2e) with difference in AMPA/NMDA ratio between NE−NE and NE−E synapses (nonengram inputs; 12 pairs, data from (d)). Unpaired t-test. Data are presented as the mean ± SEM. Source data
Extended Data Fig. 5
Extended Data Fig. 5. Remote memory consolidation strengthened interhemispheric excitatory connections between engram neurons in the cACC, but not in the RSC.
(a) Experimental setup for (b–e). AAV-DIO-ChR2-eYFP was unilaterally injected into caudal ACC (cACC) in Fos-iCreERT2 × ROSA-LSL-tdTomato mice. Photostimulation of ChR2+ engram inputs induced postsynaptic responses in nonengram (tdT−, E−NE synapses) and engram neurons (tdT+, E−E synapses) in contralateral cACC. (b) Mice were tested for memory recall 28 days after CFC (4 mice). (c) Engram neurons expressed ChR2-eYFP (green) and tdT (red) in AAV-injected cACC (left). Contralateral cACC indicated by a dotted square is magnified in the right panel, showing tdT+ engram neurons and ChR2-eYFP+ axons. (d)Traces of EPSCs induced and recorded as in Fig. 2d. Scale bar, 10 μm (inset). (e) Left: comparison of the amplitude of AMPAR EPSC induced by 20.5 mW/mm2 photostimulation and recorded in tdT− and tdT+ neurons (16 pairs). Right: comparison of AMPA/NMDA ratio (13 pairs). Paired t-test. (f) Experimental setup for (g–j). AAV-DIO-ChR2-eYFP was unilaterally injected into retrosplenial cortex (RSC) in Fos-iCreERT2 × ROSA-LSL-tdTomato mice. Photostimulation of ChR2+ engram inputs induced postsynaptic responses in nonengram (tdT−, E−NE synapses) and engram neurons (tdT+, E−E synapses) in contralateral RSC. (g) Mice were tested for memory recall 28 days after CFC (4 mice). (h) Engram neurons expressed ChR2-eYFP (green) and tdT (red) in AAV-injected RSC (left). Contralateral RSC indicated by a dotted square is magnified in the right panel, showing tdT+ engram neurons and ChR2-eYFP+ axons. (i) Traces of EPSCs induced and recorded as in Fig. 2d. Scale bar, 10 μm (inset). (j) Left: comparison of the amplitude of AMPAR EPSC induced by 20.5 mW/mm2 photostimulation and recorded in tdT− and tdT+ neurons (13 pairs). Right: comparison of AMPA/NMDA ratio (13 pairs). Paired t-test. Data are presented as the mean ± SEM. Source data
Extended Data Fig. 6
Extended Data Fig. 6. Strengthening of local recurrent excitatory connections between mPFC engram neurons during remote memory consolidation.
(a) Photostimulation activated local recurrent axons of ChR2+ engram neurons and induced postsynaptic responses recorded in engram (tdT+, E−E synapses) and nonengram neurons (tdT−, E−NE synapses). (b) Experimental setup for (c–f). Four weeks after CFC, electrophysiological experiments (E-phys) were performed without memory recall (5 mice). (c) Traces of evoked qEPSCs induced by photostimulation (blue triangles) of local recurrent engram inputs and recorded in tdT– nonengram (E−NE synapses) and tdT+ engram neurons (E−E synapses) as in Fig. 4d. Average qEPSC (red) was overlaid onto individual qEPSCs (gray). Scale bar, 10 μm (inset). (d) Comparison of peak amplitude of evoked qEPSCs recorded 20 pairs of tdT– nonengram (E−NE synapses) and tdT+ engram neurons (E−E synapses). Paired t-test. (e) Traces of spontaneous mEPSCs in nonspecific inputs to tdT– nonengram and tdT+ engram neuron. mEPSCs were recorded at −80 mV in the presence of TTX as in Fig. 4f. Average mEPSCs (red) was overlaid onto individual mEPSCs (gray). (f) Comparison of peak amplitude of spontaneous mEPSCs recorded in 11 pairs of tdT– nonengram and tdT+ engram neurons. Paired t-test. (g) Experimental setup for (h, i). Seven days after CFC, electrophysiological experiments (E-phys) were performed without memory recall (4 mice). (h) Traces of evoked qEPSCs induced by photostimulation (blue triangles) of local recurrent engram inputs and recorded in a tdT+ engram neurons (E−E synapses) as in Fig. 4d. Average qEPSC (red) was overlaid onto individual qEPSCs (gray). Scale bar, 10 μm (inset). (i) Comparison of peak amplitude of evoked qEPSCs recorded qEPSCs recorded in 14 pairs of tdT– nonengram (E−NE synapses) and tdT+ engram neurons (E−E synapses) 7 days after CFC. Paired t-test. Data are presented as the mean ± 95% confidence interval. Source data
Extended Data Fig. 7
Extended Data Fig. 7. Comparison of synaptic strength in local inhibitory engram inputs to mPFC engram versus nonengram pyramidal neurons.
(a) Top: AAV-DIO-ChR2-eYFP was injected into the mPFC/PL in Fos-iCreERT2 × ROSA-LSL-tdTomato mice. mPFC engram neurons expressed ChR2-eYFP and tdT. Photostimulation activated axons of local GABAergic engram neurons and induced inhibitory postsynaptic responses recorded in engram (E−E synapses) and nonengram pyramidal neurons (E−NE synapses). (b) Left: 28 days after CFC, the mice were tested for the recall of remote contextual fear memories, and electrophysiological experiments were performed. Right: quantification of freezing behavior during memory recall (11 mice). Data are presented as the mean ± SEM. (c) Representative traces of quantal IPSCs (qIPSCs) induced by the photostimulation of local GABAergic engram inputs and recorded in a tdT− nonengram pyramidal neuron (E−NE synapses) and a tdT+ engram pyramidal neuron (E−E synapses) in the mPFC. Photostimulation (blue triangles) activated local GABAergic inputs of ChR2+ engram neurons and induced IPSCs in postsynaptic pyramidal neurons. qIPSCs were recorded at 0 mV in voltage-clamp mode. Presynaptic GABA release was desynchronized in Ca2+-free and 4 mM Sr2+-containing extracellular solution. In each neuron, peak amplitudes of well-separated qIPSCs recorded 0.5–1.5 s after photostimulation (gray areas) were calculated and averaged. The average qIPSC (red) was overlaid onto individual qIPSC traces (gray). TTX (1 μM) and 4-AP (1 mM) were added in the extracellular solution to block polysynaptic IPSCs. NBQX (10 μM) was also added to block excitatory glutamatergic transmission. Scale bar, 10 μm (inset). (d) Comparison of the peak amplitude of evoked qIPSCs in GABAergic engram inputs to 24 pairs of nonengram neurons (E−NE synapses) versus engram neurons (E−E synapses). Paired t-test. Data are presented as the mean ± 95% confidence interval. Source data
Extended Data Fig. 8
Extended Data Fig. 8. Ablation of dorsal DG or CA1 hippocampal engram neurons inhibited the strengthening of mPFC engram circuits.
(a) Experimental setup for (b, c). DG engram neurons underwent Casp3-mediated cell death. Engram neurons in AAV-injected mPFC expressed ChR2-eYFP and tdTomato (tdT). Recordings experiments were performed 28 days after CFC (4 mice). (b) Left: photostimulation activated ChR2+ interhemispheric engram inputs and induced EPSCs in tdT− nonengram (E−NE) and tdT+ engram neurons (E−E). Right: traces of EPSCs recorded as in Fig. 2d in tdT− and tdT+ neurons. (c) Comparison of AMPA/NMDA ratios (right) in 13 pairs of mPFC nonengram (E−NE) and engram neurons (E−E). Paired t-test. (d) Experimental setup for (e–g). Engram neurons in dorsal CA1 underwent Casp3-mediated cell death. mPFC engram neurons expressed ChR2-eYFP and tdT. Recording experiments were performed 28 days after CFC (5 mice). (e) Photostimulation activated local recurrent axons of ChR2+ engram neurons and induced EPSCs in mPFC nonengram (E−NE) and tdT+ engram neurons (E−E). (f) Traces of evoked qEPSCs recorded as in Fig. 4d in E−NE and E−E synapses. Scale bar, 10 μm. (g) Comparison of peak amplitude of evoked qEPSCs recorded in 20 pairs of mPFC nonengram (E−NE) and engram neurons (E−E). Paired t-test. (h) AAVs were injected to dCA1 as in Fig. 6j in ROSA-LSL-tdTomato mice. Left: Casp3-mediated cell death in Casp3+ group resulted in lower tdT+ dCA1 cell density compared with Casp3− group. Right: tdT+ dCA1 cell density in Casp3+ (6 mice) and Casp3− groups (5 mice) 28 days after CFC. Unpaired t-test. (i) AAVs were injected to RSC as in Fig. 6j in ROSA-LSL-tdTomato mice. Left: Cell death in Casp3+ group resulted in lower tdT+ RSC cell density compared with Casp3− group. Right: tdT+ RSC cell density in Casp3+ (9 mice) and Casp3− groups (7 mice) 28 days after CFC. Unpaired t-test. Data are presented as the mean ± SEM in (c), (h), and (i) or as the mean ± 95% confidence interval in (g). Source data
Extended Data Fig. 9
Extended Data Fig. 9. BLA−mPFC circuit was involved in remote fear memory recall, and mPFC−BLA engram circuit was strengthened during systems consolidation.
(a) Experimental setup for (b, c). mPFC neurons projecting to BLA (BLA projectors) expressed tdTomato (tdT), while mPFC recall neurons were immunostained for c-Fos. (b) Images show tdT+ or Fos+ mPFC/PL neurons. Both tdT+ and Fos+ neurons are circled. (c) Left: proportion of mPFC recall neurons among BLA projectors (5 mice). Right: proportion of BLA projectors among mPFC recall neurons (5 mice). Dotted lines indicate the chance that randomly selected cells were Fos+ (left) or tdT+ (right). (d) Left: experimental setup for (e–g). BLA projectors in bilateral mPFC expressed PSAM4-GlyR-eGFP or eYFP. Right: image showing PSAM4-GlyR-eGFP-labeled mPFC neurons (green). (e) Left: AP firings before and after μPSEM application (10 μM) in the same PSAM4-GlyR-eGFP-expressing mPFC neuron (scale bar, 10 μm). Right: summary plot of AP firing (3 neurons). (f) Left: 28 days after CFC, mice were tested for memory recall after μPSEM injection. Right: freezing behavior during remote memory recall in PSAM4 (9 mice) and eYFP groups (11 mice). Unpaired t-test. (g) Left: a day after CFC, mice were tested for memory recall after μPSEM injection. Right: freezing behavior in PSAM4 (8 mice) and eYFP groups (6 mice). Unpaired t-test. (h) Experimental setup for (i–k). Photostimulation activated ChR2+ mPFC engram inputs and induced EPSCs in tdT− nonengram and tdT+ engram BLA neurons. (i) Electrophysiological experiments were 7 or 28 days after CFC without memory recall test. (j, k) Left: EPSCs in mPFC engram inputs to tdT− and tdT+ BLA neurons were recorded 28 days (j) or 7 days after CFC (k). Right: AMPA/NMDA EPSC ratio in tdT− and tdT+ BLA neurons (12 pairs in (j) and 16 pairs in (k), paired t-test). Data are presented as the mean ± SEM. Source data
Extended Data Fig. 10
Extended Data Fig. 10. Remote memory recall was inhibited by chemogenetic silencing of mPFC neurons active during remote but not recent memory recall.
(a) Experimental setup. A mixture of AAV-pFos-CreERT2 and AAV-DIO- hM4Di-mCherry (hM4Di group) or AAV-DIO-mCherry (mCherry group) was bilaterally injected to the mPFC. mPFC neurons active during memory recall expressed hM4Di-mCherry or mCherry. (b) Image showing mPFC neurons expressing hM4Di-mCherry (red). Blue fluorescence indicates Nissl stain. (c) Four weeks after CFC, the mice receive a tamoxifen injection (Tam) to label mPFC neurons active during remote memory recall (recall 1) with hM4Di-mCherry or mCherry. A week after the recall 1 session, the mice received a CNO injection and were tested for memory recall in the same context (recall 2). (d) Summary plots showing the average freezing time during recall 1 and recall 2 sessions in the hM4Di (7 mice) and mCherry groups (8 mice). Repeated measures two-way ANOVA with post hoc comparisons. (e) Two days after CFC, the mice receive a tamoxifen injection to label mPFC neurons active during recent memory recall (recall 1) with hM4Di-mCherry or mCherry. Four weeks after recall 1 session, the mice received a CNO injection and were tested for remote memory recall in the same context (recall 2). (f) Summary plots showing the average freezing time during recall 1 and recall 2 sessions in the hM4Di (10 mice) and mCherry groups (9 mice). Repeated measures two-way ANOVA with post hoc comparisons. Data are presented as the mean ± SEM. Source data

References

    1. Choi JH, et al. Interregional synaptic maps among engram cells underlie memory formation. Science. 2018;360:430–435. doi: 10.1126/science.aas9204. - DOI - PubMed
    1. Kim WB, Cho JH. Encoding of contextual fear memory in hippocampal-amygdala circuit. Nat. Commun. 2020;11:1382. doi: 10.1038/s41467-020-15121-2. - DOI - PMC - PubMed
    1. Frankland PW, Bontempi B. The organization of recent and remote memories. Nat. Rev. Neurosci. 2005;6:119–130. doi: 10.1038/nrn1607. - DOI - PubMed
    1. Tonegawa S, Morrissey MD, Kitamura T. The role of engram cells in the systems consolidation of memory. Nat. Rev. Neurosci. 2018;19:485–498. doi: 10.1038/s41583-018-0031-2. - DOI - PubMed
    1. Albo Z, Graff J. The mysteries of remote memory. Philos. Trans. R. Soc. Lond. B. 2018;373:20170029. doi: 10.1098/rstb.2017.0029. - DOI - PMC - PubMed

Publication types