. 2023 Jan;30(1):99-106.
doi: 10.1038/s41594-022-00893-6. Epub 2022 Dec 23.

Multiscale reorganization of the genome following DNA damage facilitates chromosome translocations via nuclear actin polymerization

Affiliations

Multiscale reorganization of the genome following DNA damage facilitates chromosome translocations via nuclear actin polymerization

Jennifer Zagelbaum et al. Nat Struct Mol Biol. 2023 Jan.

Erratum in

Abstract

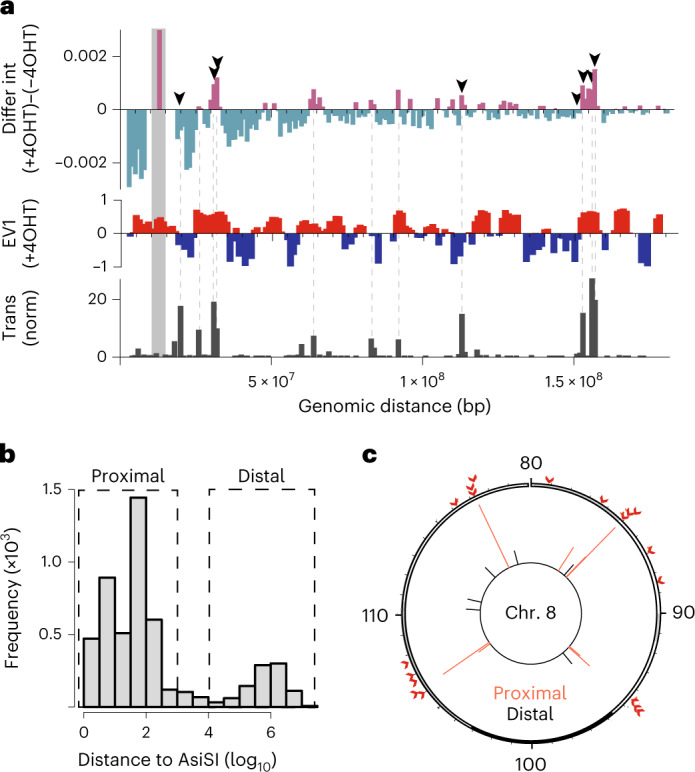
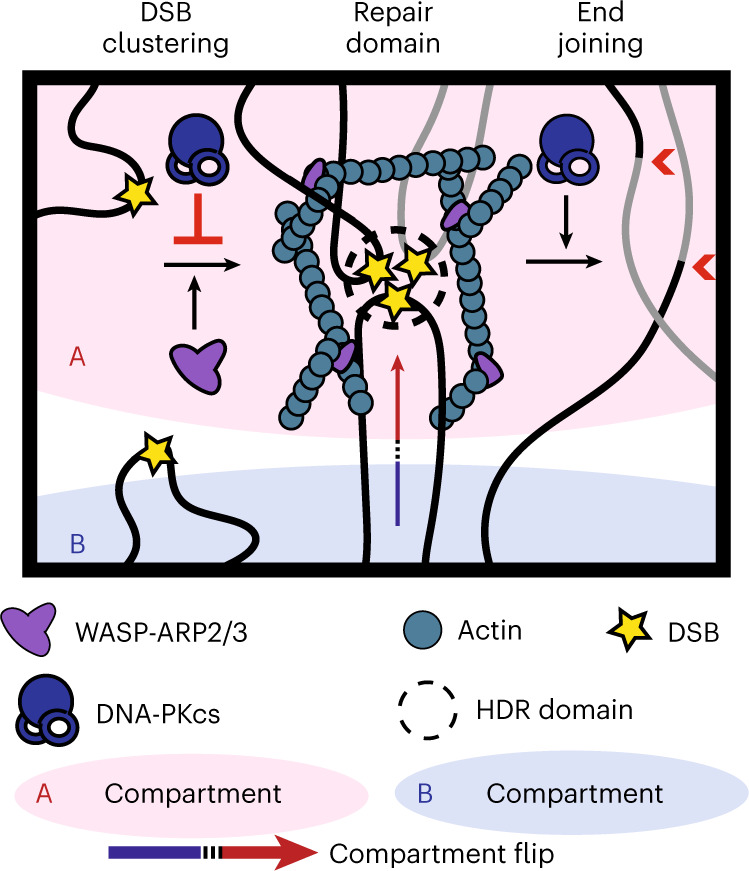
Nuclear actin-based movements have been shown to orchestrate clustering of DNA double-strand breaks (DSBs) into homology-directed repair domains. Here we describe multiscale three-dimensional genome reorganization following DNA damage and analyze the contribution of the nuclear WASP-ARP2/3-actin pathway toward chromatin topology alterations and pathologic repair. Hi-C analysis reveals genome-wide, DNA damage-induced chromatin compartment flips facilitated by ARP2/3 that enrich for open, A compartments. Damage promotes interactions between DSBs, which in turn facilitate aberrant, actin-dependent intra- and inter-chromosomal rearrangements. Our work establishes that clustering of resected DSBs into repair domains by nuclear actin assembly is coordinated with multiscale alterations in genome architecture that enable homology-directed repair while also increasing nonhomologous end-joining-dependent translocation frequency.


Conflict of interest statement

The authors declare no competing interests.

Figures

Fig. 1
Fig. 1. DNA damage induces multiscale alterations of the 3D genome.
a, Representative trajectories of compartment flipping events on Chr. 2. First EV1 tracks for cis interactions in pooled Hi-C replicates binned at 250 kb resolution in the absence (top) or presence (bottom) of DSB induction. Values are phased by gene density (active chromatin/A compartment >0, red; B compartment <0, blue). b, Percentage of A (open) or B (closed) compartment bins (250 kb) that flip genome wide on induction of damage with 4OHT. ND, no damage. c, Aggregate plots of log2(observed/expected) contact frequencies for all possible pairwise combinations of the top 97 AsiSI digested sites (Supplementary Table 1) in cis (304 interactions between damaged bins). Data are binned at 25 kb and averaged over a 2 Mb flanking window. Average observed/expected (O/E) contact frequency (freq.) heatmaps are shown in undamaged cells and following induction of DSBs (+4OHT) without (DMSO) or with CK-666. Cluster enrichment scores as indicated are calculated using the ratios of the average interaction frequency of the five central bins (125 kb)/average interaction frequency of the outside bins (125 kb–1 Mb). Source data
Fig. 2
Fig. 2. Translocations occur at sites of DSB clustering.
a, The top shows differential observed/expected Hi-C interactions (4OHT, ND, pooled Hi-C replicates) anchored at the reference site (bait, Chr. 2 13,000,000 Mb) are plotted at 1 Mb resolution. Arrowheads represent frequently cut AsiSI sites. Data adjacent to the bait site along the main diagonal are highlighted in gray (Chr. 2 11,000,000–16,000,000 Mb). Magenta bars indicate increased interactions following damage and teal bars indicate decreased interactions following damage. The middle shows the EV1 track for cis interactions (250 kb bins) in the presence of DSBs (+4OHT). Values are phased by gene density (active chromatin/A compartment >0, red; B compartment <0, blue). The bottom shows the normalized translocation frequency (translocations per 1,000 events in the dataset) between reference site (bait) and chromosome 2 loci following damage. b, Plot of all translocations as a function of their distance to the nearest AsiSI motif. Data are divided into proximal prey (<500 bp of an AsiSI site) and distal prey (>10 kb from an AsiSI site). c, Distribution of translocations within a representative chromosome (Chr. 8, 80–120 Mb). Proximal (recurrent) translocation prey (red lines, inner circle) are located <500 bp of an AsisI site (red arrowheads, outside circle). Distal (spontaneous) translocation prey (black lines, inner circle) are located >10 kb from an AsiSI site.
Fig. 3
Fig. 3. DSB clustering mediated by the WASP-ARP2/3-nuclear actin pathway facilitates chromosome translocations.
a, One representative Circos plot (out of six biological replicates) visualizing differential normalized translocation frequencies genome wide following damage in the presence or absence of ARP2/3 inhibitor, CK-666 (100 μM) at binned loci that had ≥10 translocation events. Connecting lines are colored according to the log2 fold change following damage between ±CK-666 populations. Chromosome 2 (red) contains the bait site. P = 2.05 × 10−15, Wilcoxon test. Translocations were monitored 6 hours after DSB induction. b, Normalized (norm.) translocation frequency (trans. freq.) to proximal (<500 bp of an AsiSI site) and distal (>10 kb from an AsiSI site) prey in MEF-AsiSI cells ±100 μM CK-666. n = 6 biological replicates. P calculated by Student’s two-tailed t-test. Mean is plotted and bars represent the standard deviation. c, Circos plot visualizing differential normalized translocation frequencies genome wide following damage in the presence or absence of WASP inhibitor, wiskostatin (3 mM) at binned loci that had ≥10 translocation events. Connecting lines are colored according to the log2 fold change following damage between ±wiskostatin populations. Chromosome 2 (red) contains the bait site. Two biological replicates. P = 3.41 × 10−32, Wilcoxon test. d, Circos plot visualizing differential normalized translocation frequencies genome wide following damage in the presence of actinR62D-NLS versus empty vector (EV) at binned loci that had ≥10 translocation events. Connecting lines are colored according to the log2 fold change following damage between ±actinR62D populations. Two biological replicates. Chromosome 2 (red) contains the bait site. P = 6.12 × 10−10, Wilcoxon test. Source data
Fig. 4
Fig. 4. DNA-PKcs promotes translocations while suppressing intrachromosomal interactions.
a, Circos plot visualizing differential normalized translocation frequencies genome wide following damage in the presence or absence of DNA-PKcs inhibitor, NU7441 (10 mM) at binned loci that had ≥10 translocation events. Connecting lines are colored according to the log2 fold change following damage between ±NU7441 populations. Two biological replicates. Chromosome 2 (red) contains the bait site. P = 1.04 × 10−10, Wilcoxon test. b, Normalized (norm.) translocation frequency (trans. freq.) to intra- or inter-chromosomal prey in MEF-AsiSI cells ±0 μM NU441. n = 3 biological replicates. P calculated by Student’s two-tailed t-test. Mean is plotted and bars represent the standard deviation. c, Fraction of junctions exhibiting MH >6 nt (MH > 6), MH 1–5 nt (MH 1–5), blunt ends or insertions following DNA damage in one representative sample. d, Impact of NU7441 on junctions (normalized to DMSO control) as in c. n = 3 biological replicates. Mean is plotted and bars represent standard deviation. P calculated by Student’s two-tailed t-test. NS, not significant. e, Aggregate plots of log2(observed/expected) contact frequencies for all possible pairwise combinations of the top 97 AsiSI digested sites (Supplementary Table 1) in cis (304 interactions between damaged bins) as in Fig. 1 for NU7441-treated (pooled Hi-C replicates), damaged (+4OHT) cells. Cluster enrichment scores as indicated are calculated using the ratios of the average interaction frequency of the five central bins (125 kb)/average interaction frequency of the outside bins (125 kb–1 Mb). Source data
Fig. 5
Fig. 5. Genome reorganization following DNA damage facilitates translocations.
Schematic representation of how multiscale changes in the 3D genome following damage facilitate translocations.
Extended Data Fig. 1
Extended Data Fig. 1. Characterization of AsISI MEFs.
a, Distribution of AsiSI cutting efficiency for all AsiSI motifs in MEFs as measured by END-seq spike-in assays. b, Cutting efficiency of two sites following AsiSI induction (Site 1 = chr2: 13271321, Site 2 = chr3: 88531590) in MEF-AsiSI cells +/− 100 μM CK-666. DNA was extracted from cells 6 hours following damage and % DSBs was measured using quantitative PCR amplification with primers close to the AsiSI sites, normalized to a control (uncleaved) site. Mean and standard deviation. n = 2 biological replicates. c, Hi-C interaction frequency maps for a region of chromosome 2 (5–175 Mb) binned at 250 kb and accompanying first eigenvector tracks (EV1) for cis interactions phased by gene density (A > 0). Top 97 frequently digested AsiSI sites in MEFs are indicated by arrows, top. d, Hi-C statistics. Source data
Extended Data Fig. 2
Extended Data Fig. 2. Compartment flips following DNA damage enrich for open (A compartment) chromatin.
a, b, Trajectories of compartment flipping events for individual Hi-C replicates (pooled, Fig. 1a) +/− DNA damage in the presence or absence of ck666. First eigenvector (EV1) tracks for cis interactions at 250 kb resolution before (top) and after (bottom) DSB induction are shown for chromosome 2 (a), 8 (b left), and 5 (b right). Values are phased by gene density (A > 0, red; B < 0, blue). Frequently digested AsISI sites are indicated. c, Percent of A (open) or B (closed) compartment bins (250 kb) that flip genome-wide upon DSB induction with 4OHT in individual replicates. Flipped bins are normalized based on A or B compartment status in the matched no damage control. d, Fraction of all 250 kb genomic bins assigned to the A (EV1 > 0) or B (EV1 < 0) compartment before and after damage +/− CK-666 (100 μM) in individual replicates. e, Genome wide changes in EV1 (+4OHT vs N.D. control) for pooled Hi-C replicates in the absence (DMSO) or presence of ck666 plotted as a function of stratified binned eigenvector values in the matched undamaged control. f, Relative Log2 observed/expected contact frequencies (250 kb bins) for pooled Hi-C replicates are binned by EV1 of the matched DMSO control (y-axis) for loci that flip from B to A in both individual replicates +4OHT (x-axis). Flipped loci are stratified on the x-axis by the EV1 of the undamaged DMSO control. Average interaction heatmaps are plotted for the ratio of +4OHT/N.D. interactions in the absence or presence of ck666 (top two panels) as well as the difference between these ratios (DMSO - CK-666, bottom panel). g, Saddle plots representing chromatin compartmentalization in pooled Hi-C replicates in the absence or presence of DNA damage (−/+4OHT), −/+ CK-666. The first eigenvector from each library (as indicated) was used to rank 250 kb genomic bins into equal quantiles, excluding the extreme 0.02% of data. The average interaction frequency between these ranked bins was normalized to the expected interactions and used to build the saddle plot. Histograms along the X-axis show the distribution of the A-A and B-B saddle strength, which was quantified by comparing the average interaction frequency of each A-A or B-B quantile bin or bins to the corresponding A-B interactions. Quantification of the preferential A-A and B-B interactions for the top 20% of the strongest A and B loci are indicated. h, Quantification of the preferential A-A and B-B interactions for the top 20% of the strongest A and B loci based on saddle plots for individual replicates. Source data
Extended Data Fig. 3
Extended Data Fig. 3. Multiscale genome reorganization following damage.
a, Top: Contact probability P for pooled Hi-C replicates plotted as a function of genomic distance s (P(s)) for chromosome 2 in the presence or absence of DNA damage (4OHT) +/− CK-666. Bottom: Derivative P(s) plots. b, Average log2(observed/expected) Hi-C interaction frequency maps in the 200 kb regions flanking top CTCF sites (4052) binned at 5 kb resolution (left=no damage, middle + 4OHT, right = ratio +/− damage). c, Aggregate plots of log2(observed/expected) Hi-C contact frequencies centered on all possible pairwise combinations of convergent CTCF sites (64044 interactions) binned at 5 kb resolution and averaged for a 200 kb flanking window (left=no damage, middle + 4OHT, right = ratio +/− damage). d, Fraction of 25 kb bins overlapping a compartment boundary or CTCF site for the entire genome (left), for bins containing an AsiSI motif (middle), or for bins containing a frequently cut AsiSI motif (right, Supplementary Table 1). e, Average log2(observed/expected) Hi-C interaction frequency maps in the 1 Mb regions flanking the most frequently cut AsiSI sites in MEF-AsiSI cells at 25 kb resolution +/− CK-666. f, Gene set enrichment analysis (GSEA) plot (score curves) assessing the enrichment of the frequently cut AsiSI sites in transcriptionally active regions. Source data
Extended Data Fig. 4
Extended Data Fig. 4. DSB clustering following DNA damage.
a, Aggregate plots of log2(observed/expected) Hi-C contact frequencies for all possible pairwise combinations of the top 97 AsiSI digested sites (Supplementary Table 1) in cis (304 interactions between damaged bins). Data from individual replicates is binned at 25 kb and averaged for a 2 Mb flanking window. Hi-C maps are made for individual replicate libraries for undamaged or damaged MEF-AsiS1 cells -/+ CK-666. Cluster enrichment scores are calculated using the ratios of the average interaction frequency of the 5 central bins (125 kb) / average interaction frequency of the outside bins (125 kb – 1 Mb) and summarized in b. Cluster enrichment scores are plotted for pooled damaged and undamaged MEF-AsiS1 libraries -/+ CK-666 and individual replicate scores are indicated (R1=circle, R2=triangle). Source data
Extended Data Fig. 5
Extended Data Fig. 5. Hi-C analysis in WT-MEF cells.
a, Average log2(observed/expected) Hi-C interaction frequency for individual replicates maps in the 1 Mb regions flanking the most frequently cut AsiSI sites in WT MEFs without inducible AsiSI-ER at 25 kb resolution. b, Aggregate plots of log2(observed/expected) Hi-C contact frequencies for all possible pairwise combinations of the top 97 AsiSI digested sites (Supplementary Table 1) in cis (304 interactions between bins). Data from individual Hi-C replicates is binned at 25 kb and averaged for a 2 Mb flanking window. Cluster enrichment scores as indicated are calculated using the ratios of the average interaction frequency of the 5 central bins (125 kb) / average interaction frequency of the outside bins (125 kb – 1 Mb).
Extended Data Fig. 6
Extended Data Fig. 6. Role of damage-induced genome reorganization in chromosome translocations.
a, Observed Hi-C interactions in the presence or absence of 4OHT-induced DNA damage (bait, Chr2: 13000000 Mb) and plotted at 1 Mb resolution. Red dotted lines represent frequently cut AsiSI sites. Data adjacent to the bait site along the main diagonal are highlighted in gray (Chr2:11000000-16000000 Mb). b, Fraction of bins (1 Mb) that remained in the A compartment (EV1 > 1; red), remained in the B compartment (EV1 < 1; blue), or flipped from the B to the A compartment (white) following DNA damage for a subset of loci on chromosome 2. Analysis includes the 20 bins that displayed the most notable increase in interaction frequency +/− damage. No bins in this subset flipped from compartment A to B. c, Schematic of HTGTS experiment. The bait site is located on chromosome 2, 13271321 bp. d Normalized translocation frequency from a representative sample plotted for 1 MB bins that had increased interactions following damage (red) or those that had decreased interactions following damage (blue). Bins that did not have any translocations were excluded. P was calculated using Student’s two-tailed t-test. Mean is plotted. e, Normalized translocation frequency from a representative sample plotted for 250 kb bins that remained in the A compartment (EV1 > 1; a:a), remained in the B compartment (EV1 < 1; b:b), or flipped from the B to the A compartment (b:a) following DNA damage. Data are shown as box-and-whisker plot in which he box represents the bulk of the data (25th percentile through 75th percentile), whisker lines represent statistical minimum and maximum values, and each dot represents an individual data point. Bins that did not have any translocations were excluded. Median is plotted. P was calculated using Student’s two-tailed t-test. f, Distribution of distal prey along chromosome 8 in two individual libraries. g, Distribution of proximal (<500 bp from an AsisI site) and distal (>10 kb from an AsiSI site) prey into promoter, gene body, and intergenic categories. Source data
Extended Data Fig. 7
Extended Data Fig. 7. Nuclear-actin-mediated DSB mobility facilitates chromosome translocations.
a, Normalized translocation frequency to intrachromosomal (chr2) or intrachromosomal prey in MEF AsiSI cells +/− 100 μM CK-666. n = 6 biological replicates. P calculated by Student’s two-tailed t-test. Mean is plotted and bars represent the standard deviation. b, Normalized translocation frequency to intrachromosomal prey (chr2) following induction of damage with a cas9-induced bait in WT MEFs (no AsiSI-ER) +/− CK-666. Translocations were assessed 48 hours following transfection with cas9 plasmid containing sgRNA targeting chromosome 2. n = 3 biological replicates. P calculated by Student’s two-tailed t-test. Mean is plotted and bars represent the standard deviation. c, Circos plots of individual replicates visualizing differential normalized translocation frequencies genome-wide following damage in the presence or absence of WASP inhibitor, wiskostatin (3 μM) at binned loci that had ≥10 translocation events. Connecting lines are colored according to the log2 fold change following damage between +/− wiskostatin populations. Chromosome 2 (red) contains the bait site. P calculated by Wilcoxon test. d, Circos plots of individual replicates visualizing differential normalized translocation frequencies genome-wide following damage in the presence of actinR62D-NLS versus empty vector (EV) at binned loci that had ≥10 translocation events. Connecting lines are colored according to the log2 fold change following damage between +/− actinR62D populations. Chromosome 2 (red) contains the bait site. P calculated by Wilcoxon test. Source data
Extended Data Fig. 8
Extended Data Fig. 8. Junctional analysis of translocation events.
a, Schematic representation of insertion events. b, Example reads that contain an insertion event (underline) in between bait (purple) and prey (green). c, Impact of CK-666 on fraction of junctions exhibiting microhomology > 6 nt (MH>6), microhomology 1–5 nt (MH 1-5), blunt ends, or insertions following DNA damage. n = 3 biological replicates. Mean is plotted and bars represent standard deviation. Source data
Extended Data Fig. 9
Extended Data Fig. 9. Effect of DNA-PKcs inhibition on damage-induced genome reorganization.
a, Aggregate plots of Log2(observed/expected) contact frequencies for all possible pairwise combinations of the top 97 AsiSI digested sites (Supplementary Table 1) in cis (304 interactions between damaged bins). Data is binned at 25 kb and averaged over a 2 Mb flanking window. Average observed/expected contact frequency heatmaps are shown for individual Hi-C replicates in the presence of DNA damage and the DNA-PKcs inhibitor, NU7441. Cluster enrichment scores as indicated are calculated using the ratios of the average interaction frequency of the 5 central bins (125 kb) / average interaction frequency of the outside bins (125 kb – 1 Mb). b, Aggregate plots of Log2(observed/expected) contact frequencies for all possible pairwise combinations of equivalent (see methods) non-AsiS1 loci in cis (304 interactions between undamaged bins) averaged over 100 random selections for individual Hi-C replicates in the presence or absence of DNA damage +/− DNA-PKcs inhibitor, NU7441. Average cluster enrichment scores as indicated are calculated using the ratios of the average interaction frequency of the 5 central bins (125 kb) / average interaction frequency of the outside bins (125 kb – 1 Mb). The standard deviation from the mean cluster enrichment scores of 100 random non-AsiS1 pile-ups is indicated. c, Top: Contact probability P plotted as a function of genomic distance s (P(s)) for chromosome 2 in the presence or absence.

References

    1. Symington LS, Gautier J. Double-strand break end resection and repair pathway choice. Annu. Rev. Genet. 2011;45:247–271. doi: 10.1146/annurev-genet-110410-132435. - DOI - PubMed
    1. Jackson SP, Bartek J. The DNA-damage response in human biology and disease. Nature. 2009;461:1071–1078. doi: 10.1038/nature08467. - DOI - PMC - PubMed
    1. Cortes-Ciriano I, et al. Comprehensive analysis of chromothripsis in 2,658 human cancers using whole-genome sequencing. Nat. Genet. 2020;52:331–341. doi: 10.1038/s41588-019-0576-7. - DOI - PMC - PubMed
    1. Li Y, et al. Patterns of somatic structural variation in human cancer genomes. Nature. 2020;578:112–121. doi: 10.1038/s41586-019-1913-9. - DOI - PMC - PubMed
    1. Alexandrov LB, et al. The repertoire of mutational signatures in human cancer. Nature. 2020;578:94–101. doi: 10.1038/s41586-020-1943-3. - DOI - PMC - PubMed

Publication types