. 2023 Jul;13(7):1912-1924.
doi: 10.1007/s13346-022-01284-6. Epub 2022 Dec 24.

Short-chain fatty acid-mediated epigenetic modulation of inflammatory T cells in vitro

Affiliations

Short-chain fatty acid-mediated epigenetic modulation of inflammatory T cells in vitro

David A McBride et al. Drug Deliv Transl Res. 2023 Jul.

Abstract

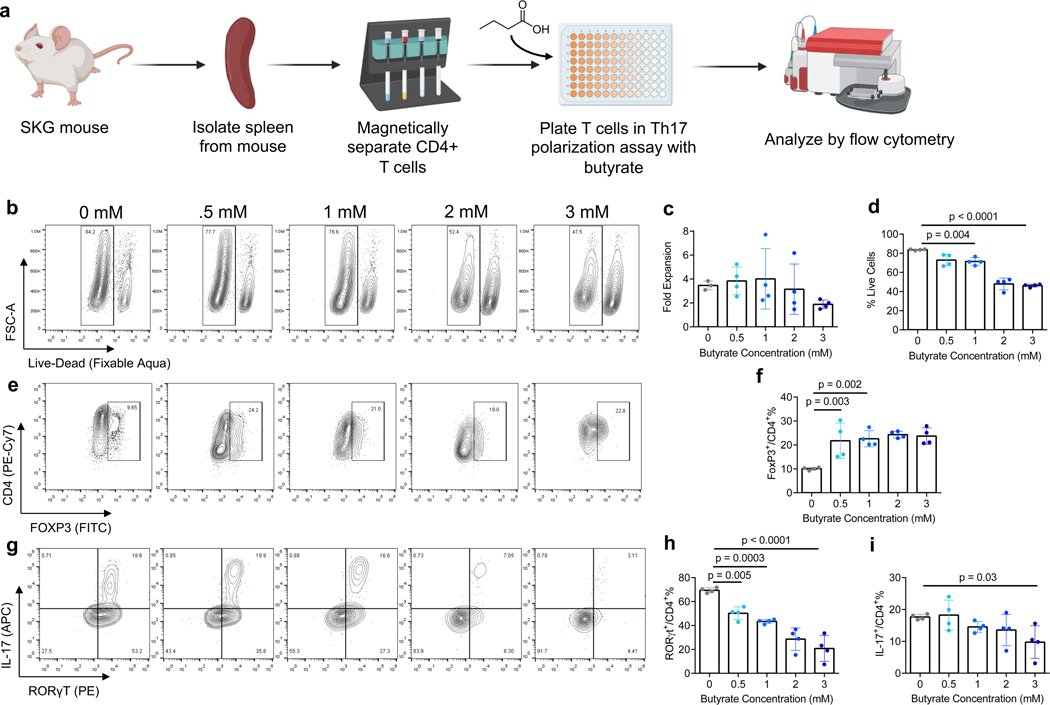
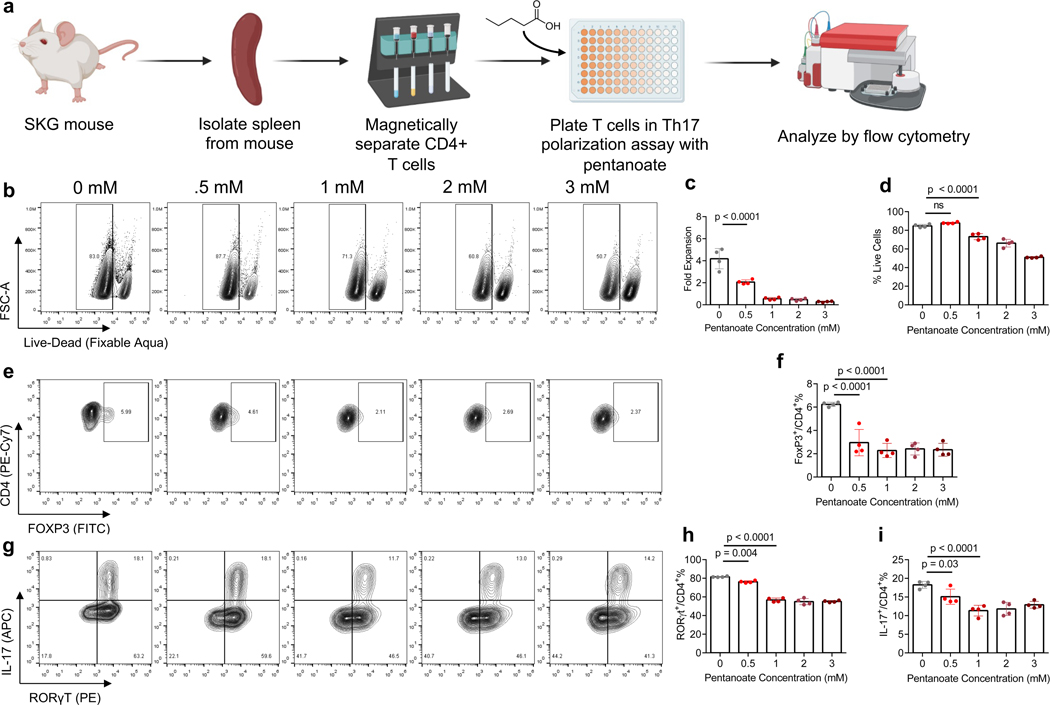
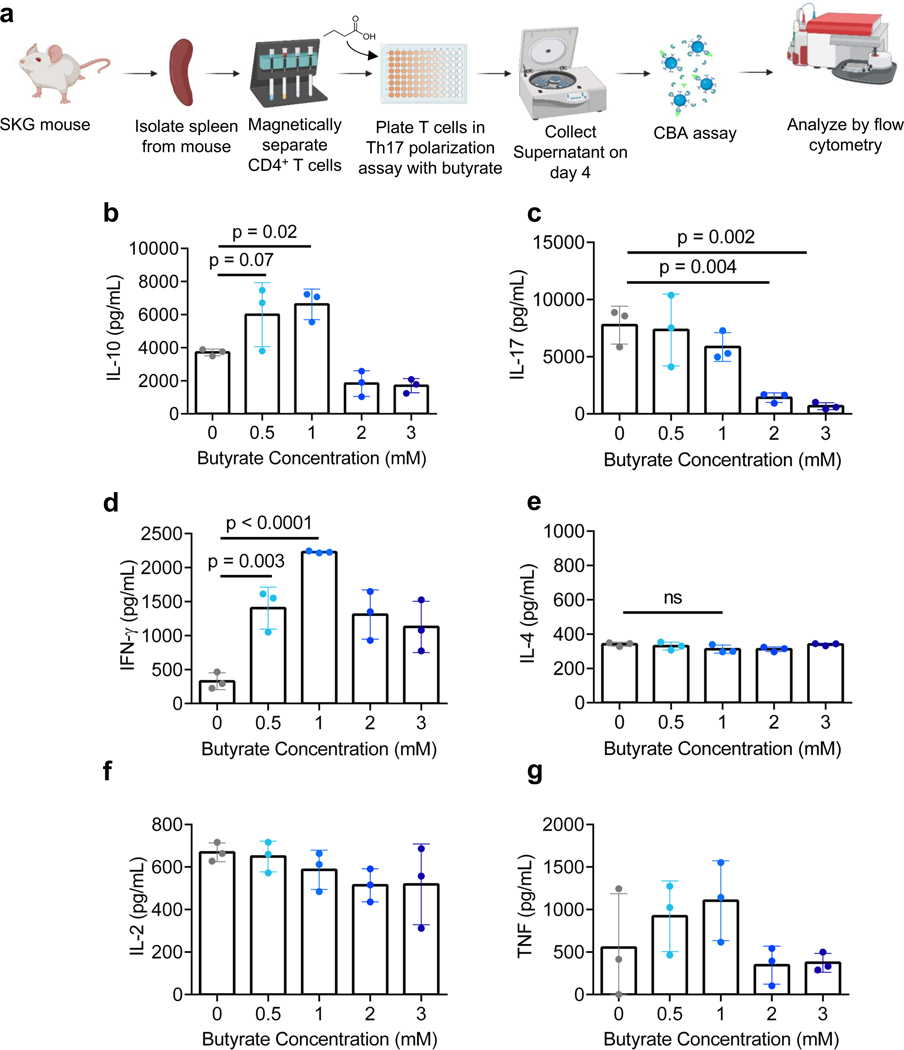
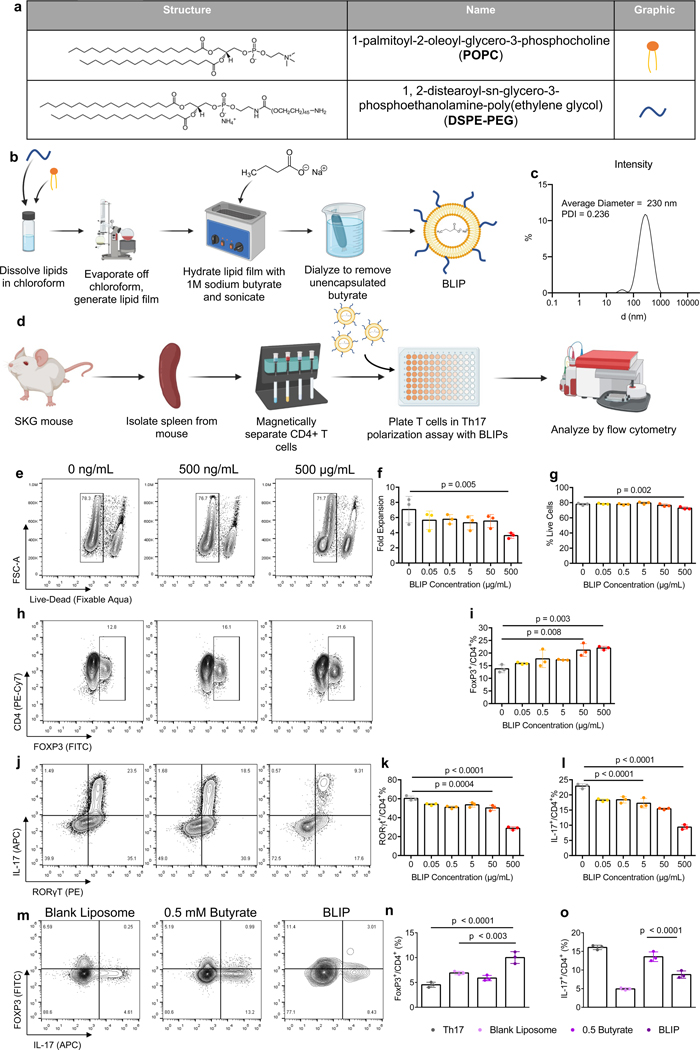
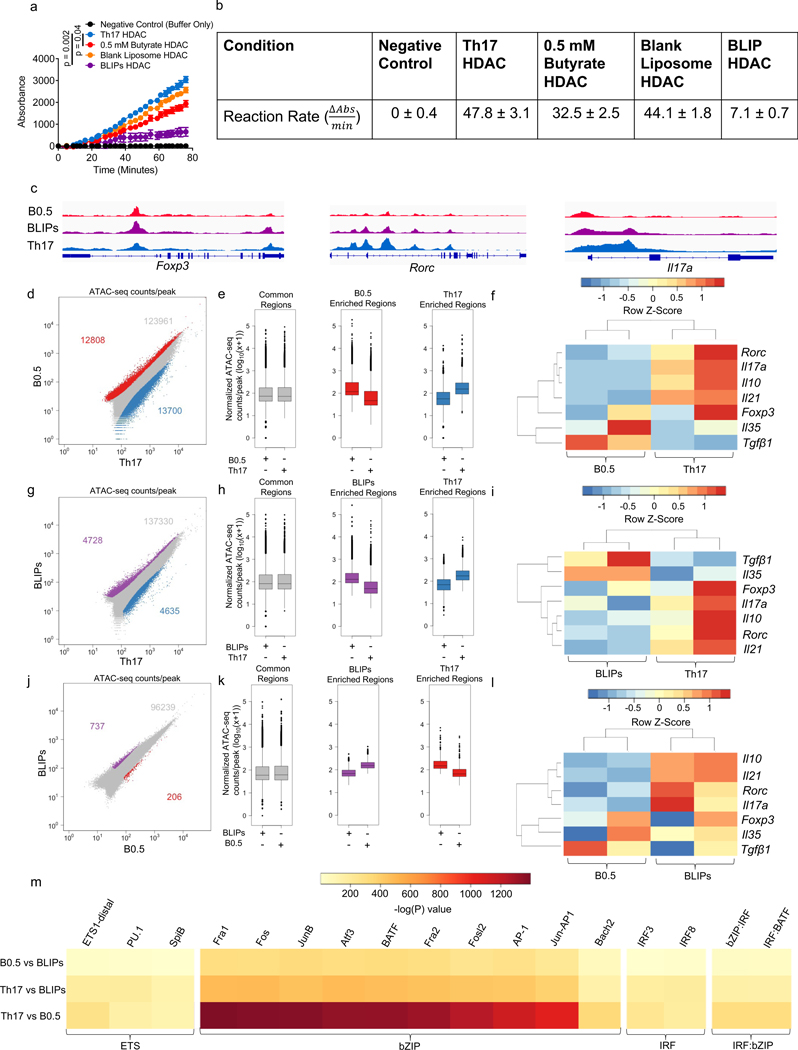
Short-chain fatty acids (SCFAs) are major metabolic products of indigestible polysaccharides in the gut and mediate the function of immune cells to facilitate homeostasis. The immunomodulatory effect of SCFAs has been attributed, at least in part, to the epigenetic modulation of immune cells through the inhibition the nucleus-resident enzyme histone deacetylase (HDAC). Among the downstream effects, SCFAs enhance regulatory T cells (Treg) over inflammatory T helper (Th) cells, including Th17 cells, which can be pathogenic. Here, we characterize the potential of two common SCFAs-butyrate and pentanoate-in modulating differentiation of T cells in vitro. We show that butyrate but not pentanoate exerts a concentration-dependent effect on Treg and Th17 differentiation. Increasing the concentration of butyrate suppresses the Th17-associated RORγtt and IL-17 and increases the expression of Treg-associated FoxP3. To effectively deliver butyrate, encapsulation of butyrate in a liposomal carrier, termed BLIPs, reduced cytotoxicity while maintaining the immunomodulatory effect on T cells. Consistent with these results, butyrate and BLIPs inhibit HDAC and promote a unique chromatin landscape in T cells under conditions that otherwise promote conversion into a pro-inflammatory phenotype. Motif enrichment analysis revealed that butyrate and BLIP-mediated suppression of Th17-associated chromatin accessibility corresponded with a marked decrease in bZIP family transcription factor binding sites. These results support the utility and further evaluation of BLIPs as an immunomodulatory agent for autoimmune disorders that are characterized by chronic inflammation and pathogenic inflammatory T cells.

Keywords: Epigenetic modulation; Immunomodulation; Short-chain fatty acids; T cells.


Conflict of interest statement

Competing interests:

The authors have no relevant financial or non-financial interests to disclose

Figures

Figure 1.
Figure 1.. Butyrate suppresses induction of Th17 and enhances Treg in inflammatory conditions
a) Schematic of in vitro cell culture assessing effects of butyrate concentration on Th17 and Treg differentiation from CD4+ mouse T (mT) cells. b) Representative flow plot of cell viability of CD4+ mT cells in Th17 inducing conditions. (c-d) quantification of c) fold expansion d) % live CD4+ mT cells in Th17 inducing conditions. e) representative flow plot and f) quantification of FoxP3 expression in CD4+ mT cells in inflammatory conditions. (g-i) g) representative flow plot and quantification of h) RORγt and i) IL-17 expression in CD4+ mT cells in the aforementioned culture conditions. Data in c,d,f,h,i are the mean ± S.D. of representative experiments. Statistical analyses in c,d,f,h,i were performed using one-way ANOVA with a post-hoc Dunnet’s multiple comparison test.
Figure 2.
Figure 2.. Pentanoate modulates FoxP3 and IL-17 expression in CD4+ T cells
a) Schematic of in vitro cell culture assessing effects of pentanoate concentration on Th17 and Treg differentiation from CD4+ mT cells. b) Representative flow plot of cell viability of CD4+ mT cells in Th17 inducing conditions. (c-d) quantification of c) fold expansion d) % live CD4+ mT cells in Th17 inducing conditions. e) representative flow plot and f) quantification of FoxP3 expression in CD4+ mT cells in inflammatory conditions. (g-i) g) representative flow plot and quantification of h) RORγt and i) IL-17 expression in CD4+ mT cells in the aforementioned culture conditions. Data in c,d,f,h,I are the mean ± S.D. of representative experiments. Statistical analyses in c,d,f,h,I were performed using one-way ANOVA with a post-hoc Dunnet’s multiple comparison test.
Figure 3.
Figure 3.. Butyrate modulates CD4+ T cell cytokine secretion in in vitro inflammatory conditions
a) Schematic of in vitro cell culture assessing effects of butyrate on CD4+ mT cell cytokine secretion in inflammatory conditions. (b-g) Quantification of b) IL-10, c) IL-17, d) IFN-γ, e) IL-4, f) IL-2 and g) TNF cytokine secretion as analyzed by multiplex assay in vitro. Data in b-g represented as the mean ± S.D. of representative experiments. Statistical analyses in b-g were performed using one-way ANOVA with a post-hoc Dunnet’s multiple comparison test.
Figure 4.
Figure 4.. Butyrate-loaded liposomes maintain Treg immunomodulatory effects while improving viability
a) Chemical structure of components of PEGylated Butyrate Liposome (BLIP) formulation. b) Schematic of BLIP synthesis. c) Intensity of BLIP particles as measured by dynamic light scattering. d) Schematic of in vitro cell culture assessing effects of BLIP concentration on Th17 and Treg differentiation from CD4+ mT cells. e) Representative flow plot of cell viability of CD4+ mT cells in Th17 inducing conditions. (f-g) quantification of f) fold expansion and g) % live CD4+ mT cells in Th17 inducing conditions. h) representative flow plot and i) quantification of FoxP3 expression in CD4+ mT cells in inflammatory conditions. (j-l) j) Representative flow plot and quantification of k) RORγt and l) IL-17 expression in CD4+ mT cells in the aforementioned culture conditions. (m-o) m) Representative flow plot and quantification of n) FoxP3 and o) IL-17 expression in mT cells from male mice differentiated in Th17-polarizing conditions treated as indicated. Data in f,g,i,k,l,n,o are the mean ± S.D. of representative experiments. Statistical analyses in f,g,I,k,l were performed using one-way ANOVA with a post-hoc Dunnet’s multiple comparison test. Statistical analysis in n, o were performed using one-way ANOVA with post-hoc Tukey test for multiple comparison.
Figure 5.
Figure 5.. Butyrate affects chromatin accessibility of Th17-associated genes
(a,b) HDAC activity readouts from nuclear protein extracts from groups of mT cells treated as indicated represented as a) standardized absorbance values over time after addition of nuclear extracts and b) average rate of reaction between 39–76 minutes, after reaction rate stabilized. c) Normalized ATAC-seq coverage at the Foxp3, Rorc, and Il17a loci in average representations of the 0.5 mM butyrate (B0.5, red), 500 μg/mL BLIPs (BLIPs, purple), and Th17 polarization only conditions (Th17, blue). d) Scatter plots of ATAC-seq counts per peak comparing cells from the B0.5 condition to the Th17 condition. Red corresponds to differentially accessible regions (DARs) enriched in the B0.5 condition, blue corresponds to DARs enriched in the Th17 condition, and grey corresponds to regions that are accessible in both conditions, but not significantly different. e) Boxplots of ATAC-Seq counts per peak from B0.5 and Th17 conditions at common (grey) or differentially accessible regions enriched in either the B0.5 (red) or the Th17 group (blue) from the comparison in Fig. 5b. f) Heatmap of select Th17 and Treg associated genes in B0.5 and Th17 conditions with dendrograms showing relatedness of samples (columns) and individual genes (rows). (g-i) g) Scatter plots of ATAC-seq counts per peak, h) boxplots of ATAC-seq counts per peak, and i) heatmap of select Th17 and Treg associated genes comparing cells from the BLIPs (purple) and Th17 (blue) conditions. (j-l) j) Scatter plots of ATAC-seq counts per peak, k) boxplots of ATAC-seq counts per peak, and l) heatmap of select Th17 and Treg associated genes comparing cells from the BLIPs (purple) and B0.5 (red) conditions. m) Motif enrichment analysis comparing peaks pairwise between cells treated with BLIPs, B0.5, and Th17, with enrichment of motifs quantified as -log(P) value. Data in a are the mean ± S.D. of n = 2 absorbance values per group standardized by subtracting the average absorbance value of the no enzyme control from the sample absorbance value. Data in b represent mean ± S.D.. Scales in c are as follows: Foxp3 [0–200], Rorc [0–400], Il17a [0–130]; data in f, i, l represent the integrated ATAC signal across each known gene promoter region ranked as z-scores using data across each row; data in m represent motifs with an enrichment log p-value less than −35 found in 10% or more regions with coverage showing a fold increase of at least 1.5 over background coverage in at least one pairwise comparison. Statistical analysis in a was performed using one-way ANOVA with post-hoc Tukey test for multiple comparisons on area under the curve.

References

    1. Workman CJ, Szymczak-Workman AL, Collison LW, Pillai MR & Vignali DAA The development and function of regulatory T cells. Cellular and Molecular Life Sciences 66, 2603–2622 (2009). - PMC - PubMed
    1. Paust S. & Cantor H. Regulatory T cells and autoimmune disease. Immunol Rev 204, 195–207 (2005). - PubMed
    1. Ohl K. & Tenbrock K. Regulatory T cells in systemic lupus erythematosus. Eur J Immunol 45, 344–355 (2015). - PubMed
    1. Littman DR & Rudensky AY Th17 and Regulatory T Cells in Mediating and Restraining Inflammation. Cell 140, 845–858 (2010). - PubMed
    1. Park H. et al. A distinct lineage of CD4 T cells regulates tissue inflammation by producing interleukin 17. Nat Immunol 6, 1133–1141 (2005). - PMC - PubMed

Publication types

MeSH terms

LinkOut - more resources