. 2022 Dec 24;13(12):1070.
doi: 10.1038/s41419-022-05515-z.

UHRF1-mediated ferroptosis promotes pulmonary fibrosis via epigenetic repression of GPX4 and FSP1 genes

Affiliations

UHRF1-mediated ferroptosis promotes pulmonary fibrosis via epigenetic repression of GPX4 and FSP1 genes

Yi Liu et al. Cell Death Dis. .

Abstract

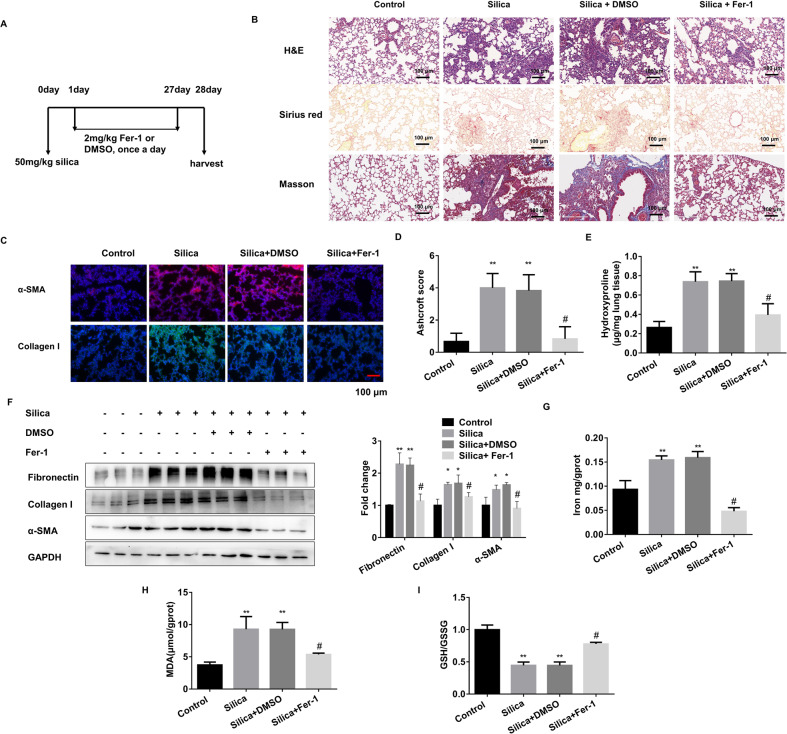
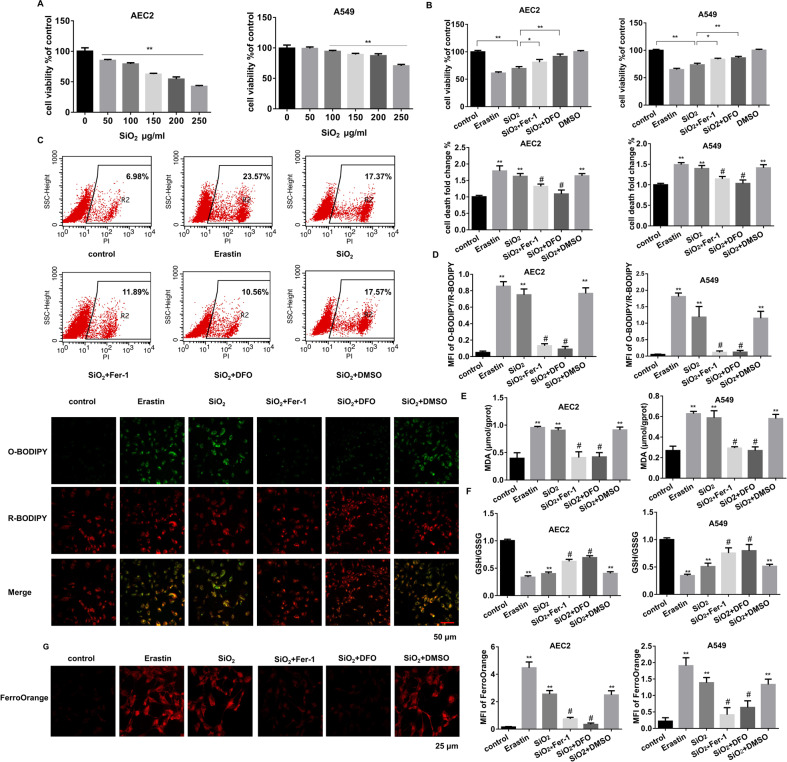
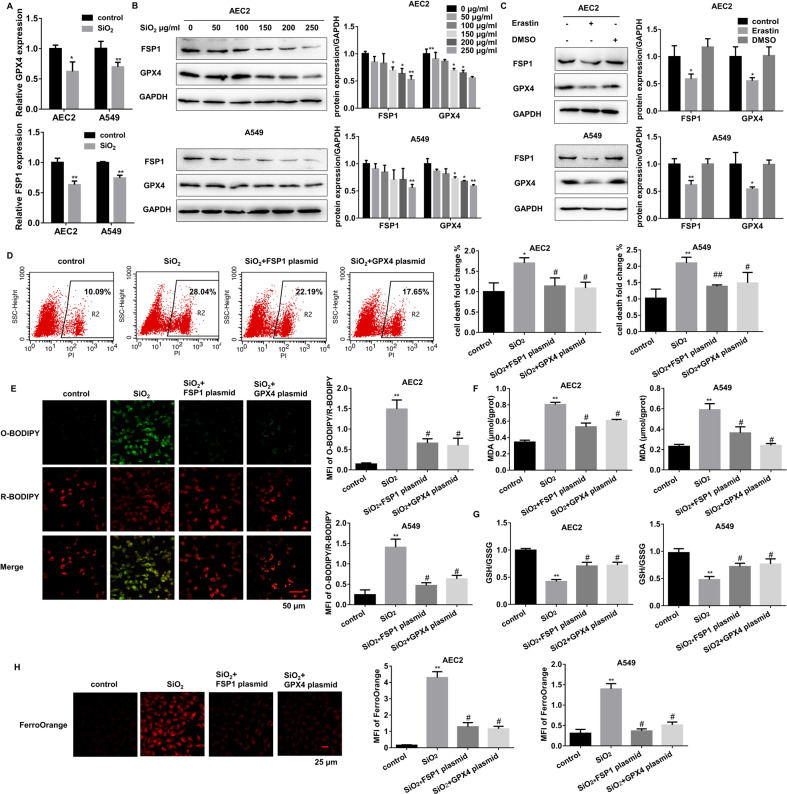
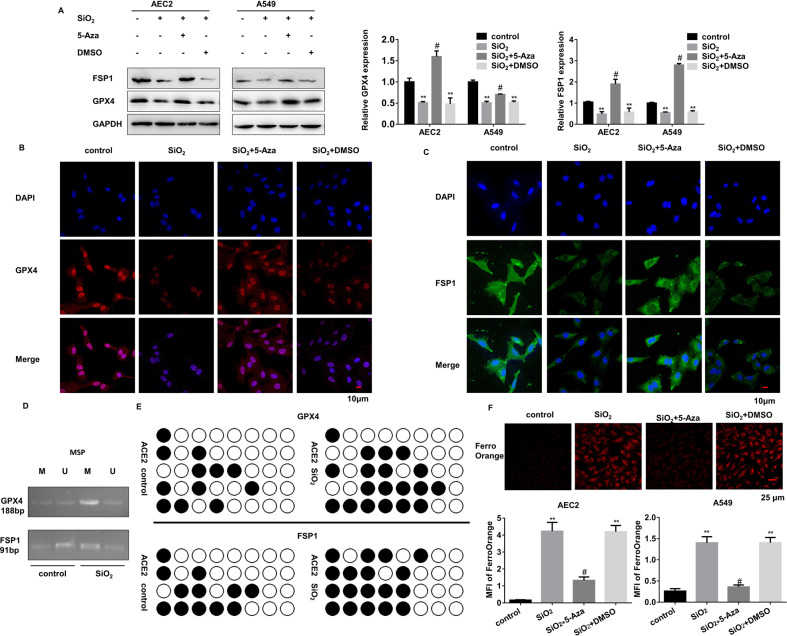
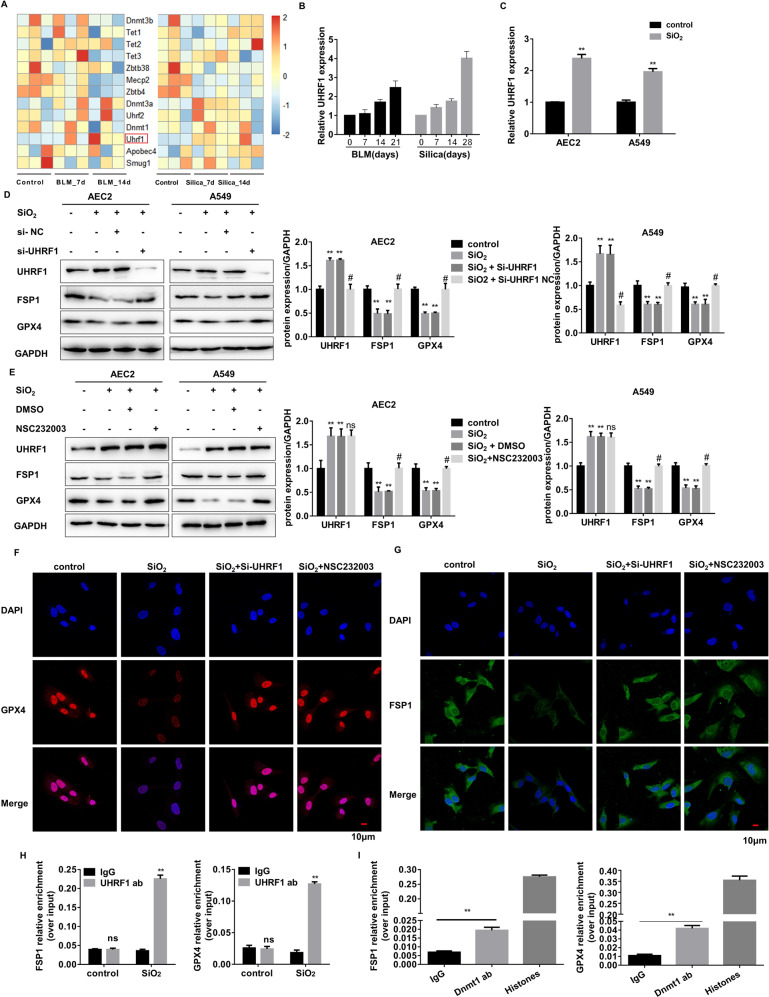
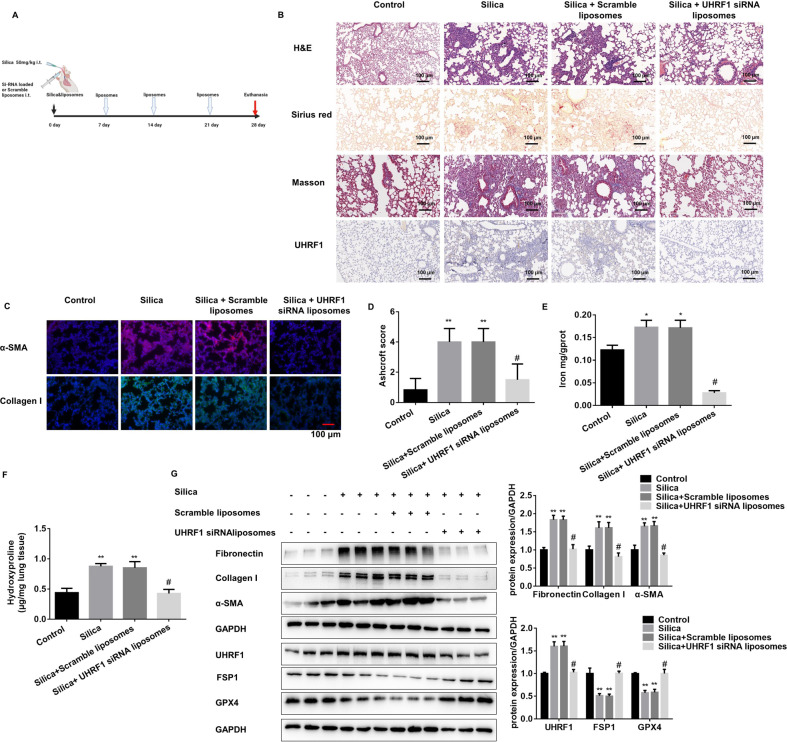
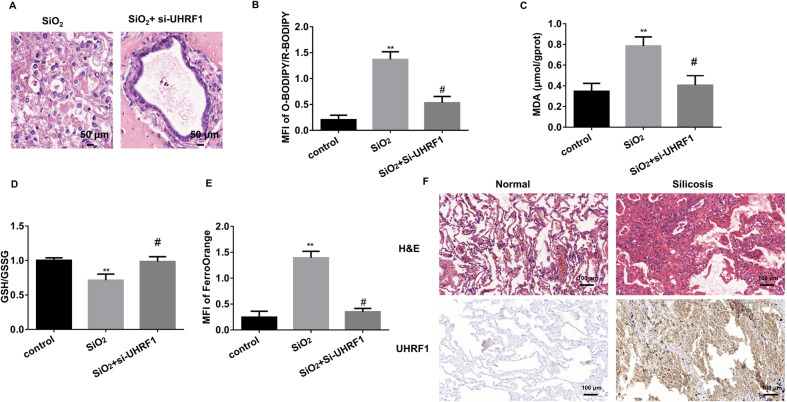
Pulmonary fibrosis (PF), as an end-stage clinical phenotype of interstitial lung diseases (ILDs), is frequently initiated after alveolar injury, in which ferroptosis has been identified as a critical event aggravating the pathophysiological progression of this disease. Here in, a comprehensive analysis of two mouse models of pulmonary fibrosis developed in our lab demonstrated that lung damage-induced ferroptosis of alveolar epithelial Type2 cells (AEC2) significantly accumulates during the development of pulmonary fibrosis while ferroptosis suppressor genes GPX4 and FSP1 are dramatically inactivated. Mechanistically, upregulation of de novo methylation regulator Uhrf1 sensitively elevates CpG site methylation levels in promoters of both GPX4 and FSP1 genes and induces the epigenetic repression of both genes, subsequently leading to ferroptosis in chemically interfered AEC2 cells. Meanwhile, specific inhibition of UHRF1 highly arrests the ferroptosis formation and blocks the progression of pulmonary fibrosis in both of our research models. This study first, to our knowledge, identified the involvement of Uhrf1 in mediating the ferroptosis of chemically injured AEC2s via de novo promoter-specific methylation of both GPX4 and FSP1 genes, which consequently accelerates the process of pulmonary fibrosis. The above findings also strongly suggested Uhrf1 as a novel potential target in the treatment of pulmonary fibrosis.


Conflict of interest statement

The authors declare no competing interests.

Figures

Fig. 1
Fig. 1. Ferroptosis inhibitor Fer-1 alleviates silica-induced PF in vivo.
A Schematic diagram of Fer-1 or DMSO-treated mouse silicosis model. Mice from control, 50 mg/kg silica, 50 mg/kg silica with 2 mg/kg Fer-1, and 50 mg/kg silica with DMSO-treated groups were sacrificed on day 28. B Representative hematoxylin/eosin (HE), Sirius red, and Masson staining of lung tissues from each group were presented (scale bars, 100 µm). C Representative immunofluorescence staining of α-SMA and Collagen I from mouse lung tissues (scale bars, 100 µm). D Ashcroft score of mice from each group. E The levels of hydroxyproline content were determined at 550 nm and expressed as micrograms per mg of lung tissues, determined by the hydroxyproline content assay kit. F The protein levels of Fibronectin, Collagen I, and α-SMA in lung tissues from each group were detected by western blot and qualified (means ± SD, n = 3). G The labile iron concentration of lung tissues was assessed using an Iron Colorimetric Assay Kit. H MDA concentration lung tissues was measured using a Lipid Peroxidation MDA Assay Kit. I GSH/GSSG ratio of lung tissues. *P < 0.05, **P < 0.01 versus control group, #P < 0.01 versus silica+DMSO treated group.
Fig. 2
Fig. 2. AEC2s undergo ferroptosis upon SiO2 stimulation.
A CCK8 detected mouse primary AEC2 and A549 cell viability after treated with 0, 50, 100, 150, 200, and 250 μg/mL SiO2 for 24 h (**P < 0.01). Then AEC2 and A549 cells were treated with 1 μM erastin, 150 or 250 µg/mL SiO2 individually, SiO2 with 1 μM Fer-1, SiO2 with 100 μM DFO, and DMSO for 24 h. CCK8 (B), flow cytometry representative pictures of primary AEC2 and quantification results of both primary AEC2 and A549 cells (C) were shown. D Representative images of C11-BODIPY in treated-primary AEC cells (red: reduced C11-BODIPY, green: oxidized C11-BODIPY; scale bars, 50 µm; lower panel), and quantification of C11-BODIPY fluorescence in primary AEC2 and A549 cells (upper panel). E MDA concentration in cell lysates from primary AEC2 and A549 cells was measured using a Lipid Peroxidation MDA Assay Kit. F GSH/GSSG ratio of primary AEC2 and A549 cells. G Intracellular Fe2+ was detected with the FerroOrange probe, and representative images of primary AEC2 cells were shown (red: FerroOrange-stained Fe2+; scale bars, 25 µm; left panel). Fe2+ fluorescence intensity was quantified by ImageJ in both primary AEC2 and A549 cells (right panel). *P < 0.05, **P < 0.01 versus control group, #P < 0.01 versus SiO2 + DMSO treated group.
Fig. 3
Fig. 3. GPX4 cooperates with FSP1 to regulate SiO2-induced AEC2 ferroptosis.
A mRNA levels of GPX4 and FSP1 were measured in 150 µg/mL SiO2 treated primary AEC and 250 µg/mL SiO2 treated A549 cells (*P < 0.05 versus control group, **P < 0.01 versus control group). B Representative immunoblotting of GPX4 and FSP1 in 0, 50, 100, 150, 200, and 250 µg/mL SiO2 treated primary AEC2 and A549 cells (left panel), means ± SEM of three independent experiments (right) are shown. C Mouse primary AEC2 and A549 cells were treated with 1 μM erastin or DMSO, representative immunoblotting of GPX4 and FSP1 (left), as well as means ± SEM of three independent experiments (right) are shown. Then AEC2 and A549 cells were treated with 150 or 250 µg/mL SiO2 individually, SiO2 with FSP1 plasmid, and SiO2 with GPX4 plasmid. D Flow cytometry representative pictures of primary AEC2 and quantification results of both primary AEC2 and A549 cells. E Representative images of C11-BODIPY in treated-primary AEC cells (red: reduced C11-BODIPY, green: oxidized C11-BODIPY; scale bars, 50 µm; left panel), and quantification of C11-BODIPY fluorescence in primary AEC2 and A549 cells (right panel). F MDA concentration in cell lysates from primary AEC2 and A549 cells was measured using a Lipid Peroxidation MDA Assay Kit. G GSH/GSSG ratio of primary AEC2 and A549 cells. H Intracellular Fe2+ was detected with the FerroOrange probe, and representative images of primary AEC2 cells were shown (red: FerroOrange-stained Fe2+; scale bars, 25 µm; left panel). Fe2+ fluorescence intensity was quantified by ImageJ in both primary AEC2 and A549 cells (right panel). **P < 0.01 versus control group, #P < 0.01 versus SiO2-treated group.
Fig. 4
Fig. 4. DNA-methylation occurs in GPX4 and FSP1 promoter regions in SiO2-stimulated AEC2s.
Primary AEC2 and A549 cells were treated with SiO2, SiO2 + 5-Aza, and SiO2 + DMSO. A Protein levels of GPX4 and FSP1 were detected by western blot and qualified (means ± SD, n = 3) (**P < 0.01 versus control group, #P < 0.01 versus SiO2 + DMSO group). B Representative immunofluorescence staining of GPX4 (red) and C FSP1 (green) in primary AEC2 cells were shown, scale bars, 10 μm. D Methylation-specific PCR detected DNA methylation levels of ACE2 cells with or without SiO2. E DNA from control and SiO2-treated AEC2 cells were subjected to bisulfite sequencing of 5′UTR. Methylated CpG sites are shown with black circles and unmethylated sites with open circles. F Intracellular Fe2+ was detected with the FerroOrange probe, and representative images of primary AEC2 cells were shown (red: FerroOrange-stained Fe2+; scale bars, 25 µm; upper panel). Fe2+ fluorescence intensity was quantified by ImageJ in both primary AEC2 and A549 cells (**P < 0.01 versus control group, #P < 0.01 versus SiO2 + DMSO group; lower panel).
Fig. 5
Fig. 5. UHRF1 exerts DNA methylation recruitment function in GPX4 and FSP1 genes.
A A heat map representing the differentially expressed DNA methylation related-RNA in the bleomycin or silica-treated mice lung tissues. The up-regulated mRNAs are indicated in progressively brighter shades of red, and the down-regulated mRNAs are indicated in progressively brighter shades of blue (n = 3). B qRT-PCR of Uhrf1 RNA levels in bleomycin-treated 0, 7, 14, and 21 days mouse lung tissues, and silica-treated 0, 7, 14, and 28 days mouse lung tissues (**P < 0.01 versus control group). C qRT-PCR of Uhrf1 RNA levels in 150 µg/mL SiO2-treated primary AEC2 cells or 250 µg/mL SiO2-treated A549 cells (**P < 0.01 versus control group). D Protein levels of UHRF1, GPX4, and FSP1 were detected by western blot and qualified (means ± SD, n = 3) after being treated with SiO2, SiO2 + UHRF1 siRNA, or SiO2 + NC siRNA (**P < 0.01 versus control group, #P < 0.01 versus SiO2 + NC siRNA group). E Protein levels of UHRF1, GPX4, and FSP1 were detected by western blot and qualified (means ± SD, n = 3) after treated with SiO2, SiO2 + NSC232003, or SiO2 + DMSO (**P < 0.01 versus control group, #P < 0.01 versus SiO2 + DMSO group). F Representative immunofluorescence staining of GPX4 (red) and G FSP1 (green) in SiO2, SiO2 + UHRF1 siRNA, or SIO2 + NSC232003-treated primary AEC2 cells were shown, scale bars, 10 μm. ChIP assay detected UHRF1 (H) enrichment of the promoter region of GPX4/FSP1 in control and SiO2-treated AEC2 cells, and DNMT1 (I) enrichment of the promoter region of GPX4/FSP1 in SiO2-treated AEC2 cells (**P < 0.01 versus IgG group).
Fig. 6
Fig. 6. UHRF1 liposomal siRNA could block PF progression in mouse models.
A Schematic diagram of UHRF1 siRNA liposome or scramble liposome together with silica-treated mouse experiment. B Representative HE, Sirius red, UHRF1 IHC, and Masson staining of lung tissues from each group of C57BL/6 mice sacrificed on day 28 (scale bars, 100 µm). C Representative immunofluorescence staining of α-SMA and Collagen I from mouse lung tissues (scale bars, 100 µm). D Ashcroft score of mice from each group. E The labile iron concentration of lung tissues was assessed using an Iron Colorimetric Assay Kit. F The levels of hydroxyproline content were determined at 550 nm and expressed as micrograms per mg of lung tissues, determined by the hydroxyproline content assay kit. G The protein levels of Fibronectin, Collagen I, α-SMA in lung tissues, and UHRF1, FSP1, GPX4 in primary AEC2 cells from each group were detected by western blot and qualified (means ± SD, n = 3). *P < 0.05 versus control group, **P < 0.01 versus control group, #P < 0.01 versus silica+scramble liposomes group.
Fig. 7
Fig. 7. AEC2 3D model confirms UHRF1-regulated ferroptosis in PF.
A Representative HE staining of primary AEC2 cell 3D culture treated by SiO2 with or without UHRF1 siRNA for 14 days. B quantification of C11-BODIPY fluorescence in primary AEC2 organoid cells (**P < 0.01 versus control group, #P < 0.01 versus SiO2-treated group). C MDA concentration in cell lysates from primary AEC2 organoid (**P < 0.01 versus control group, #P < 0.01 versus SiO2-treated group). D GSH/GSSG ratio of primary AEC2 organoid cells (**P < 0.01 versus control group, #P < 0.01 versus SiO2-treated group). E Intracellular Fe2+ fluorescence intensity was quantified in both primary AEC2 organoid cells (**P < 0.01 versus control group, #P < 0.01 versus SiO2-treated group; right panel). F Representative HE and UHRF1 IHC staining in normal and silicosis patient lung tissues (scale bars, 100 µm).

References

    1. Lederer DJ, Martinez FJ. Idiopathic pulmonary fibrosis. N Engl J Med. 2018;378:1811–23. doi: 10.1056/NEJMra1705751. - DOI - PubMed
    1. Noble PW, Barkauskas CE, Jiang D. Pulmonary fibrosis: patterns and perpetrators. J Clin Invest. 2012;122:2756–62. doi: 10.1172/JCI60323. - DOI - PMC - PubMed
    1. King TE, Jr, Bradford WZ, Castro-Bernardini S, Fagan EA, Glaspole I, Glassberg MK, et al. A phase 3 trial of pirfenidone in patients with idiopathic pulmonary fibrosis. N Engl J Med. 2014;370:2083–92. doi: 10.1056/NEJMoa1402582. - DOI - PubMed
    1. Lancaster L, Crestani B, Hernandez P, Inoue Y, Wachtlin D, Loaiza L, et al. Safety and survival data in patients with idiopathic pulmonary fibrosis treated with nintedanib: pooled data from six clinical trials. BMJ Open Respir Res. 2019;6:e000397. doi: 10.1136/bmjresp-2018-000397. - DOI - PMC - PubMed
    1. Maher TM, Wells AU, Laurent GJ. Idiopathic pulmonary fibrosis: multiple causes and multiple mechanisms? Eur Respir J. 2007;30:835–9. doi: 10.1183/09031936.00069307. - DOI - PubMed

Publication types

MeSH terms

Substances