. 2022 Dec 26;22(1):75.
doi: 10.1186/s40644-022-00506-x.

CT texture analysis and node-RADS CT score of mediastinal lymph nodes - diagnostic performance in lung cancer patients

Affiliations

CT texture analysis and node-RADS CT score of mediastinal lymph nodes - diagnostic performance in lung cancer patients

Hans-Jonas Meyer et al. Cancer Imaging. .

Abstract

Background: Texture analysis derived from computed tomography (CT) can provide clinically relevant imaging biomarkers. Node-RADS is a recently proposed classification to categorize lymph nodes in radiological images. The present study sought to investigate the diagnostic abilities of CT texture analysis and Node-RADS to discriminate benign from malignant mediastinal lymph nodes in patients with lung cancer.

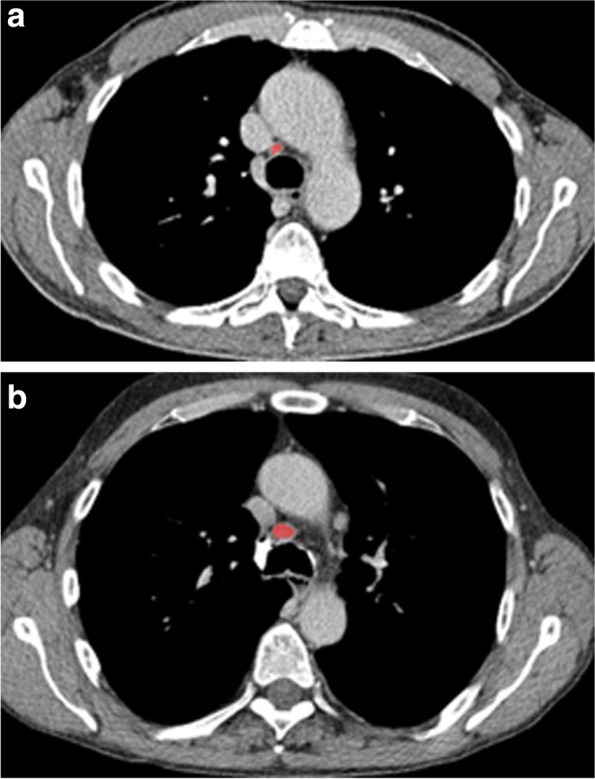
Methods: Ninety-one patients (n = 32 females, 35%) with a mean age of 64.8 ± 10.8 years were included in this retrospective study. Texture analysis was performed using the free available Mazda software. All lymph nodes were scored accordingly to the Node-RADS classification. All primary tumors and all investigated mediastinal lymph nodes were histopathologically confirmed during clinical workup.

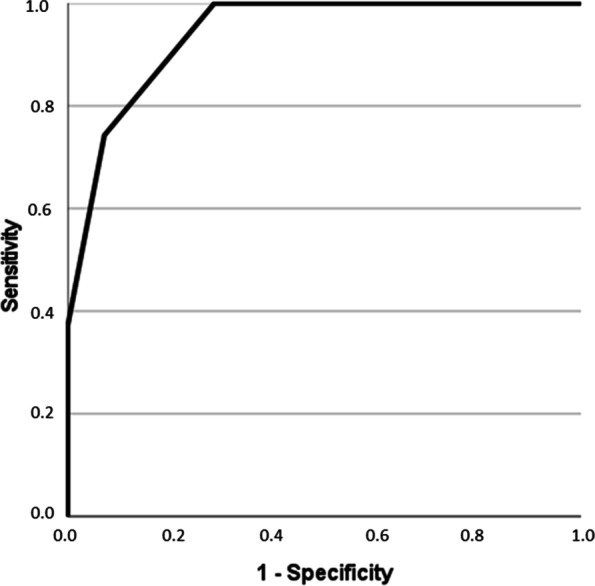
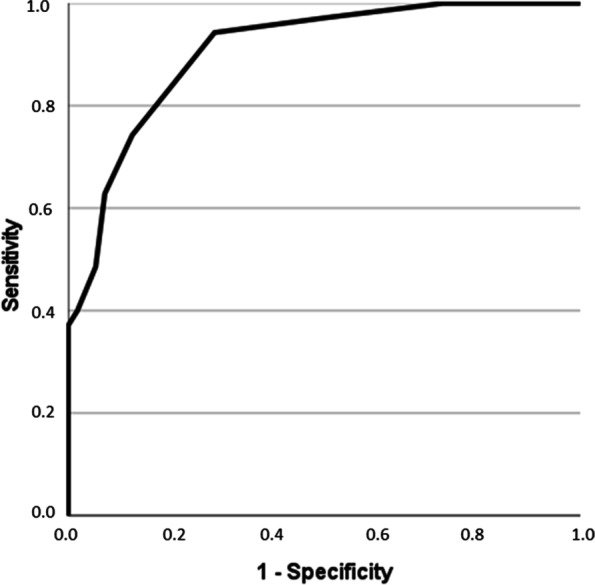
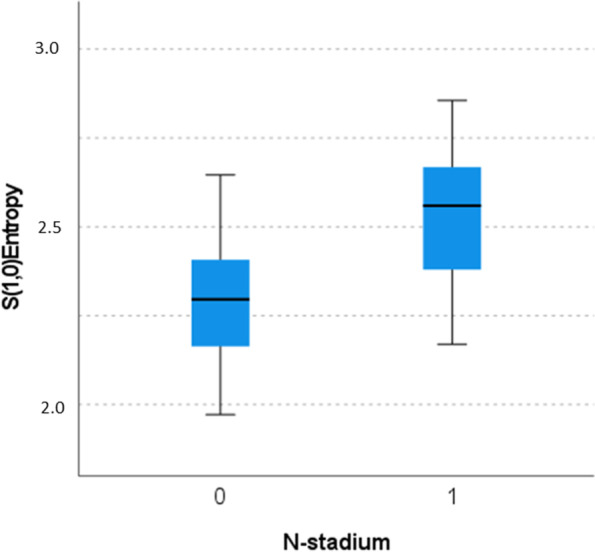
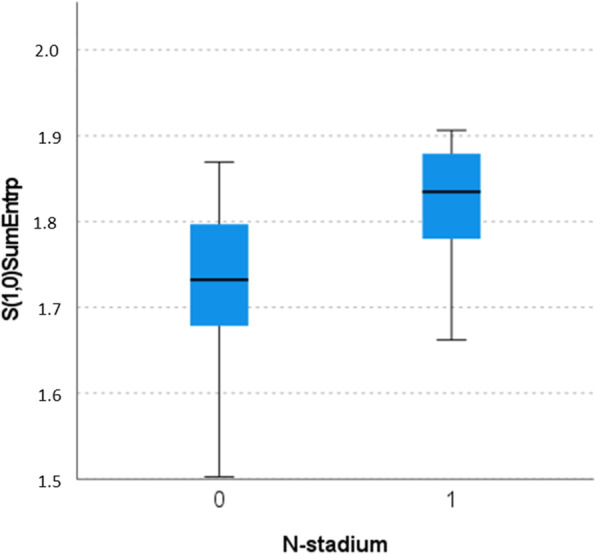
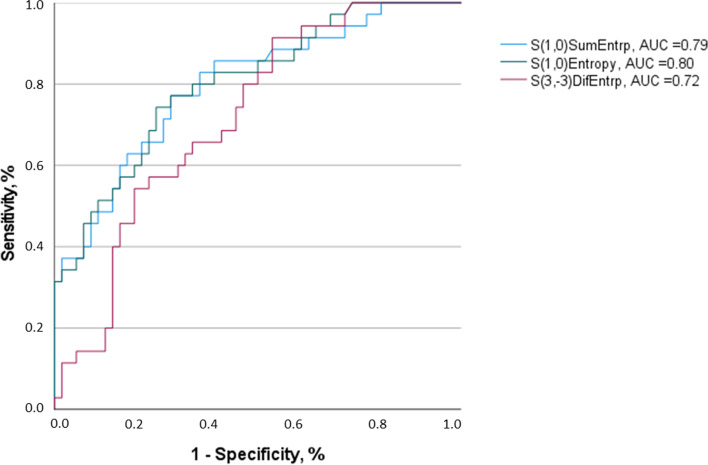
Results: In discrimination analysis, Node-RADS score showed statistically significant differences between N0 and N1-3 (p < 0.001). Multiple texture features were different between benign and malignant lymph nodes: S(1,0)AngScMom, S(1,0)SumEntrp, S(1,0)Entropy, S(0,1)SumAverg. Correlation analysis revealed positive associations between the texture features with Node-RADS score: S(4,0)Entropy (r = 0.72, p < 0.001), S(3,0) Entropy (r = 0.72, p < 0.001), S(2,2)Entropy (r = 0.72, p < 0.001).

Conclusions: Several texture features and Node-RADS derived from CT were associated with the malignancy of mediastinal lymph nodes and might therefore be helpful for discrimination purposes. Both of the two quantitative assessments could be translated and used in clinical routine.

Keywords: Computed tomography; Lung cancer; Lymph node; Texture.


Conflict of interest statement

None to declare.

Figures

Fig. 1
Fig. 1
Representative cases of the patient sample. The mediastinal lymph node is highlighted in red, which was also the region of the interest for the texture analysis. a UICC IA, N0, Node-RADS category of 0, short-axis-diameter of 6 mm. b UICC IIA, N1, Node-RADS category of 3, short-axis-diameter of 11 mm
Fig. 2
Fig. 2
Result of the ROC curve analysis for discrimination of N0 versus N1-3 with total Node-RADS-Score with an AUC of 0.94. A threshold value of 2 resulted in a sensitivity of 0.74 and a specificity of 0.93
Fig. 3
Fig. 3
Results of the ROC curve analysis for discrimination of N0 vs N1-3 with texture features and short axis diameter. A threshold value of 10 mm was selected and resulted in an AUC of 0.91 with a sensitivity of 0.74 and a specificity of 0.88
Fig. 4
Fig. 4
Discrimination analysis between N0 versus N1-3. The parameter “S(1,0)SumEntrp” reached statistical significance (Mann-Whitney test): 1.73 (IQR 0.12) versus 1.83 (IQR 0.11), p < 0.001
Fig. 5
Fig. 5
Discrimination analysis between N0 versus N1-3. The parameter “S(1,0)Entropy” reached statistical significance (Mann-Whitney test): mean 2.30 (IQR 0.26) versus 2.56 (0.30), p < 0.001
Fig. 6
Fig. 6
Results of the ROC-Analysis for discrimination of N0 vs N1-3 employing texture features S(1,0)SumEntrp, S(1,0)Entropy and S(3,-3)DifEntrp

References

    1. Rogers W, Thulasi Seetha S, Refaee TAG, et al. Radiomics: from qualitative to quantitative imaging. Br J Radiol. 2020;93:20190948. doi: 10.1259/bjr.20190948. - DOI - PMC - PubMed
    1. Lubner MG, Smith AD, Sandrasegaran K, et al. CT texture analysis: definitions, applications, biologic correlates, and challenges. Radiographics. 2017;37:1483–1503. doi: 10.1148/rg.2017170056. - DOI - PubMed
    1. Varghese BA, Cen SY, Hwang DH, Duddalwar VA. Texture analysis of imaging: what radiologists need to know. AJR Am J Roentgenol. 2019;212:520–528. doi: 10.2214/AJR.18.20624. - DOI - PubMed
    1. Lambin P, Rios-Velazquez E, Leijenaar R, et al. Radiomics: extracting more information from medical images using advanced feature analysis. Eur J Cancer. 2012;48:441–446. doi: 10.1016/j.ejca.2011.11.036. - DOI - PMC - PubMed
    1. Aerts HJ, Velazquez ER, Leijenaar RT, et al. Decoding tumour phenotype by noninvasive imaging using a quantitative radiomics approach. Nat Commun. 2014;5:4006. doi: 10.1038/ncomms5006. - DOI - PMC - PubMed