. 2022;7(1):85.
doi: 10.1007/s41109-022-00525-4. Epub 2022 Dec 19.

A framework for reconstructing transmission networks in infectious diseases

Affiliations

A framework for reconstructing transmission networks in infectious diseases

Sara Najem et al. Appl Netw Sci. 2022.

Abstract

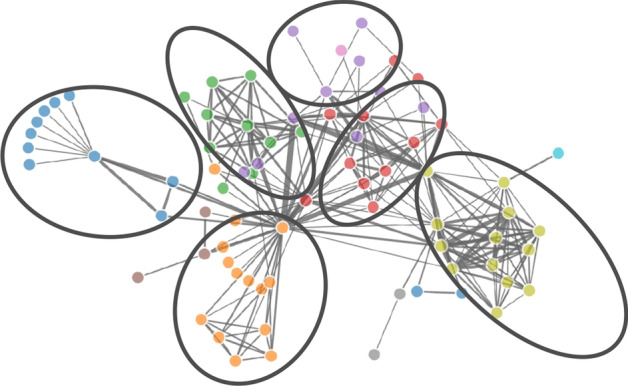
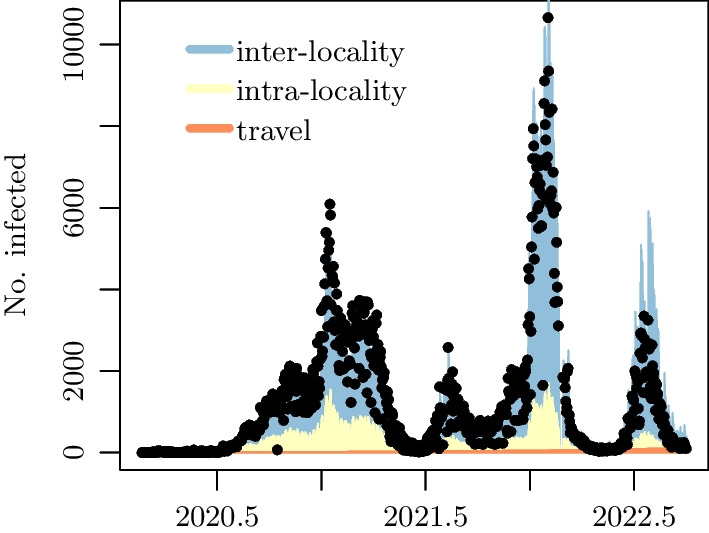
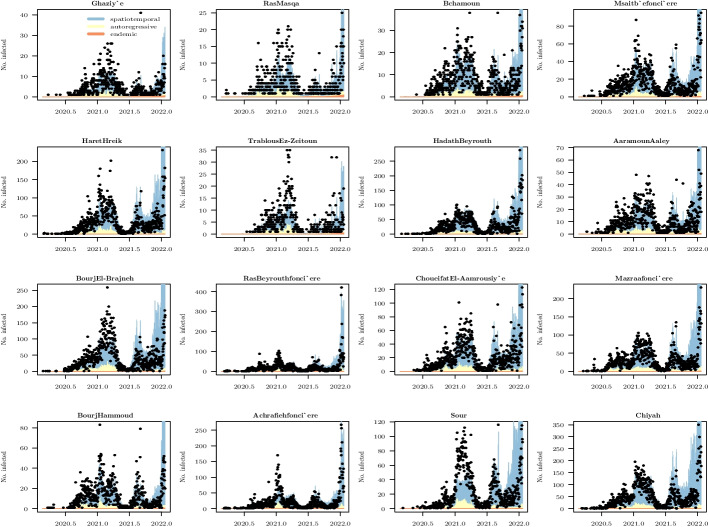
In this paper, we propose a general framework for the reconstruction of the underlying cross-regional transmission network contributing to the spread of an infectious disease. We employ an autoregressive model that allows to decompose the mean number of infections into three components that describe: intra-locality infections, inter-locality infections, and infections from other sources such as travelers arriving to a country from abroad. This model is commonly used in the identification of spatiotemporal patterns in seasonal infectious diseases and thus in forecasting infection counts. However, our contribution lies in identifying the inter-locality term as a time-evolving network, and rather than using the model for forecasting, we focus on the network properties without any assumption on seasonality or recurrence of the disease. The topology of the network is then studied to get insight into the disease dynamics. Building on this, and particularly on the centrality of the nodes of the identified network, a strategy for intervention and disease control is devised.

Keywords: Autoregressive model; Betweenness centrality; COVID-19; Network reconstruction; Optimal control.


Conflict of interest statement

Competing interestsThe authors declare that they have no competing interests.

Figures

Fig. 1
Fig. 1
An example of modular network along with its detected communities (encircled) is shown. The nodes are color-coded based on their memberships to these communities
Fig. 2
Fig. 2
Example of a network with C=1/3 and l=8/6 is shown. It has three triplets, one of which is closed (triangle). The lengths of the paths from j2 to all others is 1, while that from j1 to j4 is 2
Fig. 3
Fig. 3
Examples of random, scale-free, and ordered (lattice-like) networks are shown respectively
Fig. 4
Fig. 4
Data and fit under the model of Eq. (1) with negative binomial distributed counts. The three colors show the decomposition of the fitted aggregate counts into travel, intra-locality, and inter-locality contributions to infections amounting to 3%, 10%, and 87% respectively
Fig. 5
Fig. 5
Time evolution of the inter-locality parameter ϕit is shown for the regions with the highest centrality (see Sect. 3)
Fig. 6
Fig. 6
The network A(15)(t=300) is overlaid on the map of Lebanon to illustrate its complexity. It is evaluated at the 300-th day of the pandemic using all 15 time interval of our collected data, that is the time span [0,20·15]
Fig. 7
Fig. 7
The modularity of the network A(n)(t) is shown as a function of time t=20·n, with n=141. It is measure of the quality of the division of a graph into subgraphs
Fig. 8
Fig. 8
The figure shows the clustering coefficient and average path length for A(41)(t), which are the matrices estimated using the data from the start of the pandemic to the 820-th day (41·20) evaluated at t=20·n, where n is the index of the time intervals
Fig. 9
Fig. 9
Empirical and estimated distributions of the strength for the matrices A(n)(t=20·n) with n=1,,20 are shown
Fig. 10
Fig. 10
Empirical and estimated distributions of the strength for the matrices A(n)(t=20·n) with n=21,,35 are shown
Fig. 11
Fig. 11
Estimated values α^ of the exponent of the power-law distributions of the strengths of the nodes of the 41 matrices A(n)(t=20·n), n=1,,41, which are represented in Fig. 9. Vertical bars indicate ±2σ^α^
Fig. 12
Fig. 12
The figure illustrates the iterative scheme. First, the node with the highest centrality j2 is disconnected by removing all its links, as it is the node with the highest number of shortest paths. The resulting network has j1 and j3 with equal centralities and either one can be disconnected. This leads to a total loss of connectivity in the network at the end of the process
Fig. 13
Fig. 13
The loss of connectivity versus the fraction of removed nodes for the cascading and non-cascading strategies
Fig. 14
Fig. 14
The map shows the localities with the highest centrality whose removals lead to 80% loss of connectivity
Fig. 15
Fig. 15
The figure shows the counts, along with the fitted model, for twelve localities ordered by decreasing betweenness centrality

References

    1. Mohamadou Y, Halidou A, Kapen PT. A review of mathematical modeling, artificial intelligence and datasets used in the study, prediction and management of COVID-19. Appl Intell. 2020;50(11):3913–3925. doi: 10.1007/s10489-020-01770-9. - DOI - PMC - PubMed
    1. Guan J, Wei Y, Zhao Y, Chen F. Modeling the transmission dynamics of COVID-19 epidemic: a systematic review. J Biomed Res. 2020;34(6):422. doi: 10.7555/JBR.34.20200119. - DOI - PMC - PubMed
    1. Celani A, Giudici P. Endemic-epidemic models to understand COVID-19 spatio-temporal evolution. Spat Stat. 2021;49:100528. doi: 10.1016/j.spasta.2021.100528. - DOI - PMC - PubMed
    1. Ssentongo P, Fronterre C, Geronimo A, Greybush SJ, Mbabazi PK, Muvawala J, Nahalamba SB, Omadi PO, Opar BT, Sinnar SA, et al. Pan-African evolution of within-and between-country COVID-19 dynamics. Proc Natl Acad Sci. 2021;118(28):e2026664118. doi: 10.1073/pnas.2026664118. - DOI - PMC - PubMed
    1. Dickson MM, Espa G, Giuliani D, Santi F, Savadori L. Assessing the effect of containment measures on the spatio-temporal dynamic of COVID-19 in Italy. Nonlinear Dyn. 2020;101(3):1833–1846. doi: 10.1007/s11071-020-05853-7. - DOI - PMC - PubMed

LinkOut - more resources