. 2022 Dec 8:5:1027783.
doi: 10.3389/fdata.2022.1027783. eCollection 2022.

Worldwide impact of lifestyle predictors of dementia prevalence: An eXplainable Artificial Intelligence analysis

Affiliations

Worldwide impact of lifestyle predictors of dementia prevalence: An eXplainable Artificial Intelligence analysis

Loredana Bellantuono et al. Front Big Data. .

Abstract

Introduction: Dementia is an umbrella term indicating a group of diseases that affect the cognitive sphere. Dementia is not a mere individual health issue, since its interference with the ability to carry out daily activities entails a series of collateral problems, comprising exclusion of patients from civil rights and welfare, unpaid caregiving work, mostly performed by women, and an additional burden on the public healthcare systems. Thus, gender and wealth inequalities (both among individuals and among countries) tend to amplify the social impact of such a disease. Since at present there is no cure for dementia but only drug treatments to slow down its progress and mitigate the symptoms, it is essential to work on prevention and early diagnosis, identifying the risk factors that increase the probability of its onset. The complex and multifactorial etiology of dementia, resulting from an interplay between genetics and environmental factors, can benefit from a multidisciplinary approach that follows the "One Health" guidelines of the World Health Organization.

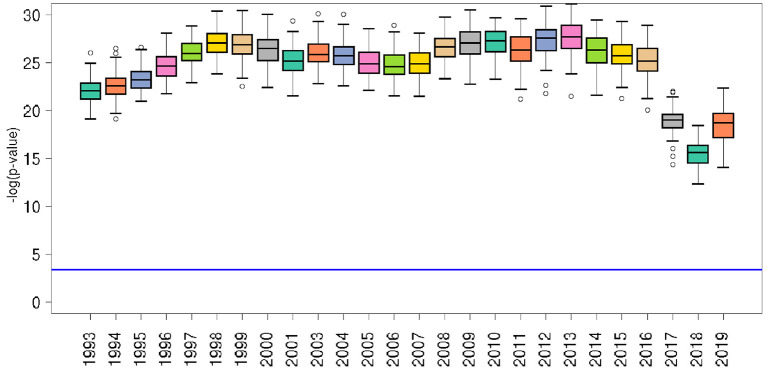
Methods: In this work, we apply methods of Artificial Intelligence and complex systems physics to investigate the possibility to predict dementia prevalence throughout world countries from a set of variables concerning individual health, food consumption, substance use and abuse, healthcare system efficiency. The analysis uses publicly available indicator values at a country level, referred to a time window of 26 years.

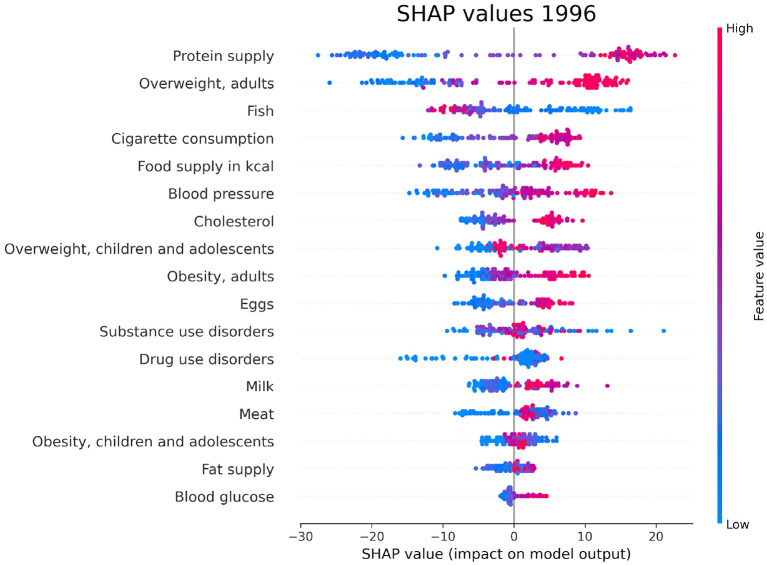
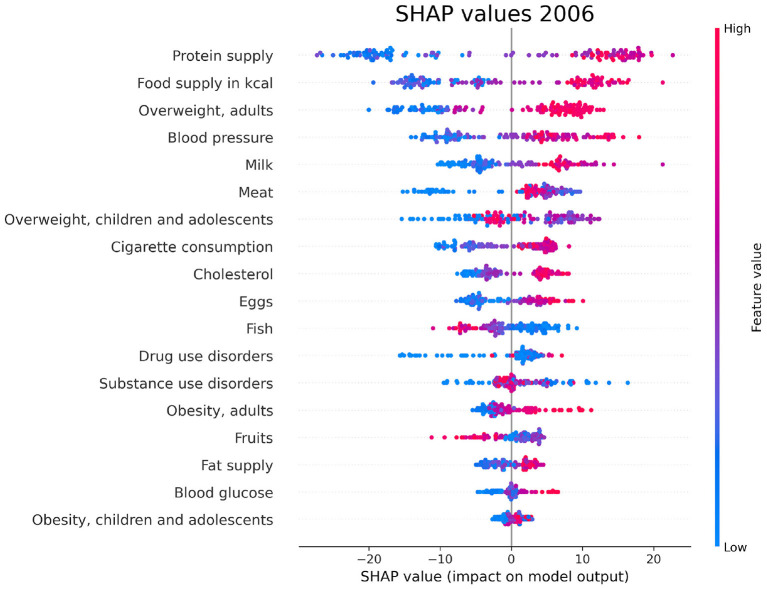
Results: Employing methods based on eXplainable Artificial Intelligence (XAI) and complex networks, we identify a group of lifestyle factors, mostly concerning nutrition, that contribute the most to dementia incidence prediction.

Discussion: The proposed approach provides a methodological basis to develop quantitative tools for action patterns against such a disease, which involves issues deeply related with sustainable, such as good health and resposible food consumption.

Keywords: AI for social good; One Health; complex systems; computational social science; data science for social good; dementia; eXplainable Artificial Intelligence; sustainable development goals.


Conflict of interest statement

The authors declare that the research was conducted in the absence of any commercial or financial relationships that could be construed as a potential conflict of interest.

Figures

Figure 1
Figure 1
Prevalence of AD and other forms of dementia (PAD) in 137 UN countries for the year 2003.
Figure 2
Figure 2
Flowchart of the proposed analysis. After a pre-processing phase, we applied a machine learning framework to predict the PAD for 137 UN countries between 1993 and 2019. In addition, we implemented a feature selection procedure to assess the role of each feature in the model.
Figure 3
Figure 3
Properties of the competition network based on the rankings of Boruta feature importance values for different years. The upper panel shows the network structure, consisting of 34 nodes representing features, and 338 weighted edges that quantify the tendency of different features to switch their positions in the importance rankings. The lower panel reports in a scatter plot the network degree of features and their mean Boruta importance values. In both panels, features are colored according to the number of Boruta rankings in which they appear.
Figure 4
Figure 4
Significance of the RF model for each year, in terms of the relative p-value of the agreement (R2) between PAD actual values and RF predictions for each year. The horizontal blue line represents the p = 0.01 after correction for multiple hypothesis testing according to Bonferroni. Empty bullets represent distribution outliers.
Figure 5
Figure 5
Average importance of the features used in the RF model over 100 repetitions of the 5-fold cross validation procedure, for 26 different years. The white boxes indicate that the corresponding feature was discarded in the preselection based on the Boruta algorithm. The gray boxes indicate that the corresponding indicators are missing for those years.
Figure 6
Figure 6
SHAP values corresponding to the features that are most influential in the prediction of PAD for the year 1996. Different points in the same row are associated to the prediction made for different countries.
Figure 7
Figure 7
SHAP values corresponding to the features that are most influential in the prediction of PAD for the year 2006. Different points in the same row are associated to the prediction made for different countries.
Figure 8
Figure 8
SHAP values corresponding to the features that are most influential in the prediction of PAD for the year 2016. Different points in the same row are associated to the prediction made for different countries.
Figure 9
Figure 9
World maps of SHAP values associated with PAD prediction, related to the feature and year indicated in the each map label. Color bars are reported for numerical reference.
Figure 10
Figure 10
SHAP values corresponding to the features that are most influential in the prediction of PAD for the year 2013, obtained with the extended dataset described in Section 3.6. Different points in the same row are associated to the prediction made for different countries.

References

    1. Adadi A., Berrada M. (2018). Peeking inside the black-box: a survey on explainable artificial intelligence (XAI). IEEE Access 6, 52138–52160. 10.1109/ACCESS.2018.2870052 - DOI
    1. Alessandretti L., Sapiezynski P., Sekara V., Lehmann S., Baronchelli A. (2018). Evidence for a conserved quantity in human mobility. Nat. Hum. Behav. 2, 485–491. 10.1038/s41562-018-0364-x - DOI - PubMed
    1. Amoroso N., Bellantuono L., Monaco A., De Nicolò F., Somma E., Bellotti R. (2021a). Economic interplay forecasting business success. Complexity 2021, 8861267. 10.1155/2021/8861267 - DOI
    1. Amoroso N., Bellantuono L., Pascazio S., Lombardi A., Monaco A., Tangaro S., et al. . (2020). Potential energy of complex networks: a quantum mechanical perspective. Sci. Rep. 10, 18387. 10.1038/s41598-020-75147-w - DOI - PMC - PubMed
    1. Amoroso N., Bellantuono L., Pascazio S., Monaco A., Bellotti R. (2021b). Characterization of real-world networks through quantum potentials. PLoS ONE 16, e0254384. 10.1371/journal.pone.0254384 - DOI - PMC - PubMed

LinkOut - more resources