. 2022 Dec 14;4(12):e0805.
doi: 10.1097/CCE.0000000000000805. eCollection 2022 Dec.

Physiologic Effects of the Awake Prone Position Combined With High-Flow Nasal Oxygen on Gas Exchange and Work of Breathing in Patients With Severe COVID-19 Pneumonia: A Randomized Crossover Trial

Affiliations

Physiologic Effects of the Awake Prone Position Combined With High-Flow Nasal Oxygen on Gas Exchange and Work of Breathing in Patients With Severe COVID-19 Pneumonia: A Randomized Crossover Trial

Samuel Lehingue et al. Crit Care Explor. .

Abstract

To determine the effect of the awake prone position (APP) on gas exchange and the work of breathing in spontaneously breathing patients with COVID-19-associated acute hypoxemic respiratory failure (AHRF) supported by high-flow nasal oxygen.

Design: Prospective randomized physiologic crossover multicenter trial.

Settings: Four ICUs in Marseille, France.

Patients: Seventeen patients with laboratory-confirmed COVID-19 pneumonia and Pao2/Fio2 less than or equal to 300 mm Hg while treated with high-flow nasal cannula oxygen therapy.

Interventions: Periods of APP and semirecumbent position (SRP) were randomly applied for 2 hours and separated by a 2-hour washout period.

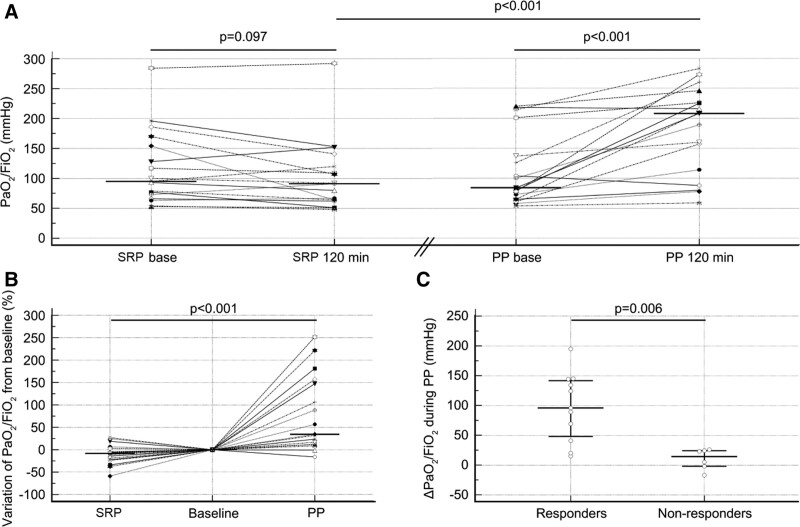
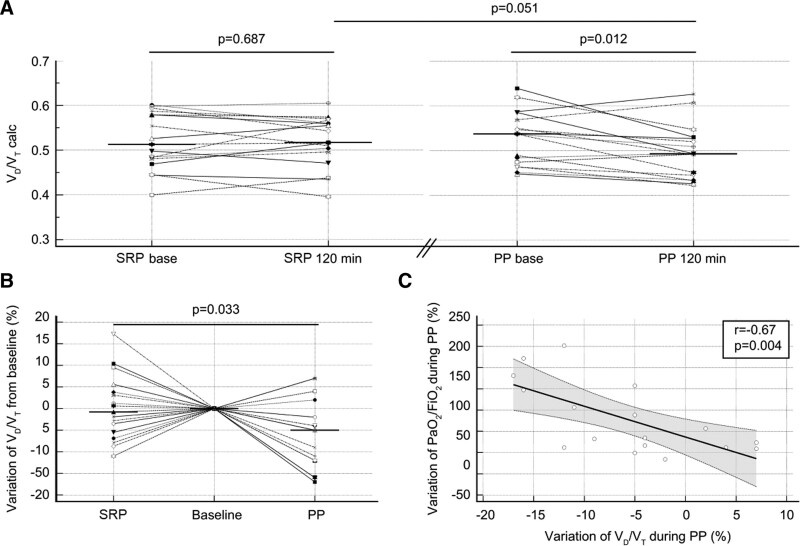
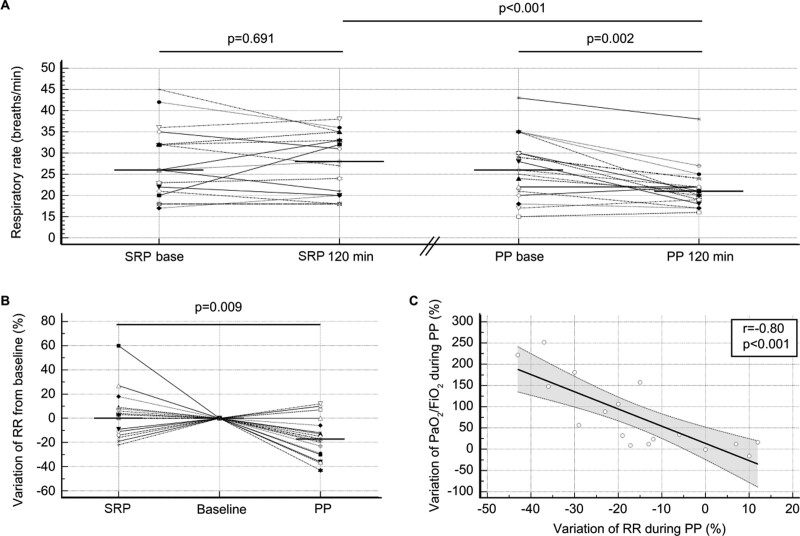
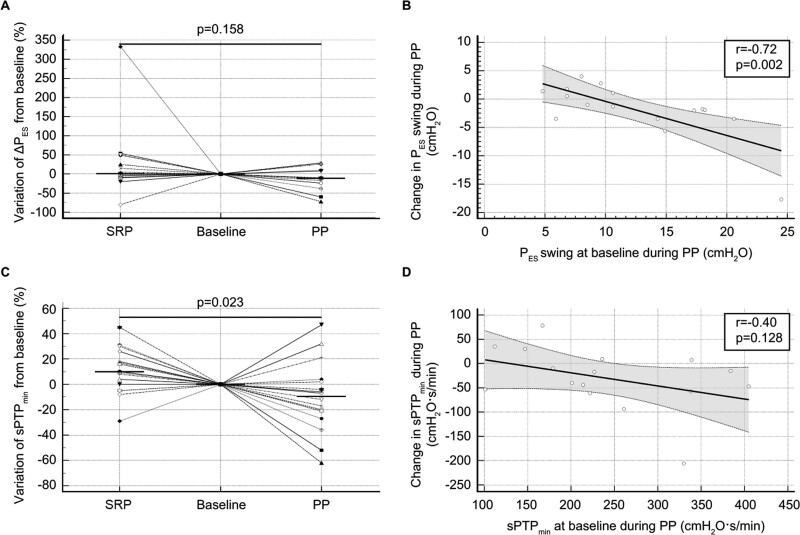
Measurements and main results: Arterial blood gases, end-tidal CO2. and esophageal pressure were recorded prior to and at the end of each period. Inspiratory muscle effort was assessed by measuring the esophageal pressure swing (∆PES) and the simplified esophageal pressure-time product (sPTPES). The other endpoints included physiologic dead space to tidal volume ratio (VD/VT) and the transpulmonary pressure swing. The APP increased the Pao2/Fio2 from 84 Torr (61-137 Torr) to 208 Torr (114-226 Torr) (p = 0.0007) and decreased both the VD/VT and the respiratory rate from 0.54 (0.47-0.57) to 0.49 (0.45-0.53) (p = 0.012) and from 26 breaths/min (21-30 breaths/min) to 21 breaths/min (19-22 breaths/min), respectively (p = 0.002). These variables remained unchanged during the SRP. The ∆PES and sPTPES per breath were unaffected by the position. However, the APP reduced the sPTPES per minute from 225 cm H2O.s.m-1 (176-332 cm H2O.s.m-1) to 174 cm H2O.s.m-1 (161-254 cm H2O.s.m-1) (p = 0.049).

Conclusions: In spontaneously breathing patients with COVID-19-associated AHRF supported by high-flow nasal oxygen, the APP improves oxygenation and reduces the physiologic dead space, respiratory rate, and work of breathing per minute.

Keywords: COVID-19; prone position; respiratory distress syndrome; respiratory insufficiency; work of breathing.


Conflict of interest statement

The authors have disclosed that they do not have any potential conflicts of interest.

Figures

Figure 1.
Figure 1.
Effects of the semirecumbent position (SRP) and prone position (PP) on the Pao2/Fio2 ratio. A, Dot plots and lines of Pao2/Fio2 at baseline and the end (120 min) of each period during the SRP and PP. The horizontal line indicates the median value. B, Dot plots and lines of the relative variation in Pao2/Fio2 during the SRP and PP, which was computed as 100 × (end value–baseline value)/baseline value. The baseline of each period was normalized to the reference level (zero). The horizontal line indicates the median value. C, Dot plots of the absolute variation in Pao2/Fio2 during the PP in the responders and nonresponders, which was computed as the end value–baseline value. The horizontal lines indicate the median values and the 25–75th percentiles. Among the six nonresponders, three had a ∆Pao2/Fio2 greater than 20 mm Hg.
Figure 2.
Figure 2.
Effects of the semirecumbent position (SRP) and prone position (PP) on the physiologic dead space to tidal volume ratio (VD/VT). A, Dot plots and lines of VD/VT at baseline and the end (120 min) of each period during the SRP and PP. The horizontal line indicates the median value. B, Dot plots and lines of the relative variation in VD/VT during the SRP and PP, which was computed as 100 × (end value–baseline value)/baseline value. The baseline of each period was normalized to the reference level (zero). The horizontal line indicates the median value. C, Scatter plot and regression analysis of the relative variation in VD/VT and the relative variation in Pao2/Fio2. The dashed lines indicate the 95% CI of the regression line.
Figure 3.
Figure 3.
Effects of the semirecumbent position (SRP) and prone position (PP) on the respiratory rate (RR). A, Dot plots and lines of the RR at the baseline and the end (120 min) of each period during the SRP and PP. The horizontal line indicates the median value. B, Dot plots and lines of the relative variation in the RR during the SRP and PP, which was computed as 100 × (end value–baseline value)/baseline value. The baseline of each period was normalized to the reference level (zero). The horizontal line indicates the median value. C, Scatter plot and regression analysis of the relative variation in the RR and the relative variation in Pao2/Fio2. The dashed lines indicate the 95% CI of the regression line.
Figure 4.
Figure 4.
Effects of the semirecumbent position (SRP) and prone position (PP) on inspiratory muscle effort. A, Dot plots and lines of the relative variation in the esophageal pressure swing (∆PES) during SRP and PP, which was computed as 100 × (end value–baseline value)/baseline value. The baseline of each period was normalized to the reference level (zero). The horizontal line indicates the median value. B, Scatter plot and regression analysis of the baseline ∆PES and the relative variation in ∆PES during the PP. The dashed lines indicate the 95% CI of the regression line. C, Dot plots and lines of the relative variation in the simplified esophageal pressure–time product per minute (sPTPmin) during the SRP and PP, which was computed as 100 × (end value–baseline value)/baseline value. The baseline of each period was normalized to the reference level (zero). The horizontal line indicates the median value. D, Scatter plot and regression analysis of the baseline sPTPmin and the relative variation in sPTPmin during the PP. The dashed lines indicate the 95% CI of the regression line.

References

    1. COVID-ICU Group on behalf of the REVA Network and the COVID-ICU Investigators: Clinical characteristics and day-90 outcomes of 4244 critically ill adults with COVID-19: A prospective cohort study. Intensive Care Med 2021; 47:60–73 - PMC - PubMed
    1. Tobin MJ, Laghi F, Jubran A: Why COVID-19 silent hypoxemia is baffling to physicians. Am J Respir Crit Care Med 2020; 202:356–360 - PMC - PubMed
    1. Alhazzani W, Møller MH, Arabi YM, et al. : Surviving sepsis campaign: Guidelines on the management of critically ill adults with coronavirus disease 2019 (COVID-19). Intensive Care Med 2020; 46:854–887 - PMC - PubMed
    1. Ospina-Tascón GA, Calderón-Tapia LE, García AF, et al. ; HiFLo-Covid Investigators: Effect of high-flow oxygen therapy vs conventional oxygen therapy on invasive mechanical ventilation and clinical recovery in patients with severe COVID-19: A randomized clinical trial. JAMA 2021; 326:2161–2171 - PMC - PubMed
    1. Nasa P, Azoulay E, Khanna AK, et al. : Expert consensus statements for the management of COVID-19-related acute respiratory failure using a Delphi method. Crit Care 2021; 25:106. - PMC - PubMed