. 2022 Dec 9:9:1048932.
doi: 10.3389/fmolb.2022.1048932. eCollection 2022.

Microfluidic liquid sheets as large-area targets for high repetition XFELs

Affiliations

Microfluidic liquid sheets as large-area targets for high repetition XFELs

David J Hoffman et al. Front Mol Biosci. .

Abstract

The high intensity of X-ray free electron lasers (XFELs) can damage solution-phase samples on every scale, ranging from the molecular or electronic structure of a sample to the macroscopic structure of a liquid microjet. By using a large surface area liquid sheet microjet as a sample target instead of a standard cylindrical microjet, the incident X-ray spot size can be increased such that the incident intensity falls below the damage threshold. This capability is becoming particularly important for high repetition rate XFELs, where destroying a target with each pulse would require prohibitively large volumes of sample. We present here a study of microfluidic liquid sheet dimensions as a function of liquid flow rate. Sheet lengths, widths and thickness gradients are shown for three styles of nozzles fabricated from isotropically etched glass. In-vacuum operation and sample recirculation using these nozzles is demonstrated. The effects of intense XFEL pulses on the structure of a liquid sheet are also briefly examined.

Keywords: devices; instruments; liquid microjets; microfluidics; samples; spectroscopy; structural biology; x-ray.


Conflict of interest statement

The converging type nozzle described in this work has been licensed to Micronit Ltd. for which Stanford, SLAC, and DD may receive a portion of royalty payments related to product sales. The remaining authors declare that the research was conducted in the absence of any commercial or financial relationships that could be construed as a potential conflict of interest.

Figures

FIGURE 1
FIGURE 1
(A) Schematic illustration of a liquid sheet produced by a microfluidic nozzle and its principal dimensions. The liquid flow (Q) is from left to right. Momentum transfer at (or near) the nozzle exit creates a collision point which produces a flat liquid sheet perpendicular to the nozzle channels and bounded by cylindrical liquid rims. Surface tension brings the outer rims back together to a node, where a second, smaller sheet is produced orthogonal to the first. Subsequent sheets are smaller and orthogonal to the preceding sheet. (B) The three types of channel geometries examined in this work and their principal dimensions. (C) The nozzle exits for the three types of channel geometries.
FIGURE 2
FIGURE 2
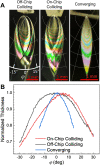
(A) Example white light thin film interference patterns for the three nozzle types examined in this work. Each colored fringe corresponds to a particular liquid sheet thickness, which then corresponds to a contour of equal thickness in the sheet. As the liquid in the sheet flows radially outward from the collision point, the sheet becomes flatter with distance from the nozzle. (B) Normalized sheet thickness profiles as a function of angle φ. The non-normalized sheet thickness varies with the radial distance from the collision point per Eq. 1. The on-chip colliding nozzle produced the flattest sheet, while the converging nozzle produced the sheets with the greatest thickness variation.
FIGURE 3
FIGURE 3
(A) Example sheet thicknesses along the centerline (φ = 0°) for the three nozzle types as a function of flow rate (Q = 3.0, 3.3, and 3.6 ml/min as dotted, dashed, and solid lines, respectively). The converging nozzle thickness profiles (blue curves) were essentially flow rate independent, while the colliding nozzle sheets became thicker with increasing flow rate (red and black curves). Green dashed curve shows the thickness profile for the thinnest sheet examined in this work (Q = 2.2 ml/min). (B) The sheet thickness scaling, hr, along the centerline as a function of flow rate. The two colliding nozzles exhibited almost the same linear rate of change in the thickness scaling with respect to flow rate, while the converging nozzle showed minimal changes.
FIGURE 4
FIGURE 4
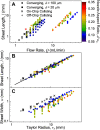
(A) Sheet lengths, l, as a function of flow rate, Q. (B) Sheet lengths as a function of the Taylor radius, r T (Eq. 5), which is proportional to Q 2 and the hydrodynamic Weber number. All of the studied sheets had lengths l ≈ 0.4 r T (black line). (C) Sheet widths as a function of the Taylor radius. All of the sheet widths were proportional to the Taylor radius, but the colliding sheets were broader than the converging sheets. The width of the converging sheets decreased with increasing nozzle aspect ratio, d/w 0.
FIGURE 5
FIGURE 5
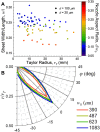
(A) Sheet width/length ratio (w/l) of the converging nozzle sheets as a function of Taylor radius, r T . The converging sheets with the largest aspect ratio (d/w 0, most square nozzle exit) produced the narrowest sheets, but the width/length ratio did not strongly depend on flow rate. (B) Sheet profiles for several converging nozzle sheets (d = 100 μm) scaled to their Taylor radii. These scaled profiles were found to be virtually flow rate independent. The gradual narrowing of the sheet profile with increasing aspect ratio (decreasing w 0) is apparent.
FIGURE 6
FIGURE 6
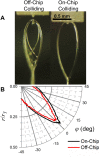
(A) Liquid sheets produced by an on- and off-chip colliding nozzle with the same channel radii (R = 20 μm) and the same flow rate (Q = 2 ml/min). The off-chip colliding sheet is somewhat smaller and has less stable cylindrical rims. (B) Sheet profiles scaled to the Taylor radii for the on- and off-chip colliding nozzles. The off-chip profile is smaller but otherwise similar to the off-chip profile.
FIGURE 7
FIGURE 7
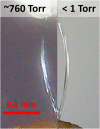
A converging nozzle (d = 20 μm, w 0 = 100 μm) running in atmosphere (left) and in vacuum (right) at a flow rate of Q = 2 ml/min. The sheet has the same profile in both cases.
FIGURE 8
FIGURE 8
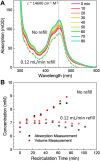
(A) UV-Vis absorption spectra of the test Rubipy solution during in-vacuum sample recirculation tests. Over time, the concentration of the Rubipy solution was seen to increase due to evaporative losses in vacuum (solid curves). When the sample reservoir was refilled at a 0.12 ml/min flow rate, the sample solution concentration stabilized (dotted curves, vertically offset for clarity). (B) Recirculated Rubipy sample concentration over time with and without refilling the reservoir for evaporative losses (filled and open symbols, respectively). The black points are the concentration as determined from the UV-Vis absorption spectra, while the red points were extrapolated from the reservoir volume assuming only water was lost during the recirculation process.
FIGURE 9
FIGURE 9
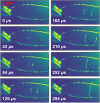
Single shot pictures of damage to a liquid sheet at a given delay following an intense XFEL pulse at LCLS. The sheet was produced by a converging nozzle with d = 20 μm and w 0 = 578 μm. The resulting sample explosion causes a bubble that expands and flows downstream following the X-ray pulse.

References

    1. Alonso-Mori R., Sokaras D., Cammarata M., Ding Y., Feng Y., Fritz D., et al. (2020). Femtosecond electronic structure response to high intensity XFEL pulses probed by iron X-ray emission spectroscopy. Sci. Rep. 10, 16837–7. 10.1038/s41598-020-74003-1 - DOI - PMC - PubMed
    1. Antonyuk S. V., Hough M. A. (2011). Monitoring and validating active site redox states in protein crystals. Biochim. Biophys. Acta 1814, 778–784. 10.1016/j.bbapap.2010.12.017 - DOI - PubMed
    1. Ascone I., Meyer-Klaucke W., Murphy L. (2003). Experimental aspects of biological X-ray absorption spectroscopy. J. Synchrotron Radiat. 10, 16–22. 10.1107/s0909049502022598 - DOI - PubMed
    1. Beitlich T., Kühnel K., Schulze-Briese C., Shoeman R. L., Schlichting I. (2007). Cryoradiolytic reduction of crystalline heme proteins: Analysis by UV-Vis spectroscopy and X-ray crystallography. J. Synchrotron Radiat. 14, 11–23. 10.1107/S0909049506049806 - DOI - PubMed
    1. Bush J. W. M., Hasha A. E. (2004). On the collision of laminar jets: Fluid chains and fishbones. J. Fluid Mech. 511, 285–310. 10.1017/s002211200400967x - DOI

LinkOut - more resources