. 2022 Dec 2:13:1029177.
doi: 10.3389/fendo.2022.1029177. eCollection 2022.

Tenuous transcriptional threshold of human sex determination. II. SRY exploits water-mediated clamp at the edge of ambiguity

Affiliations

Tenuous transcriptional threshold of human sex determination. II. SRY exploits water-mediated clamp at the edge of ambiguity

Joseph D Racca et al. Front Endocrinol (Lausanne). .

Abstract

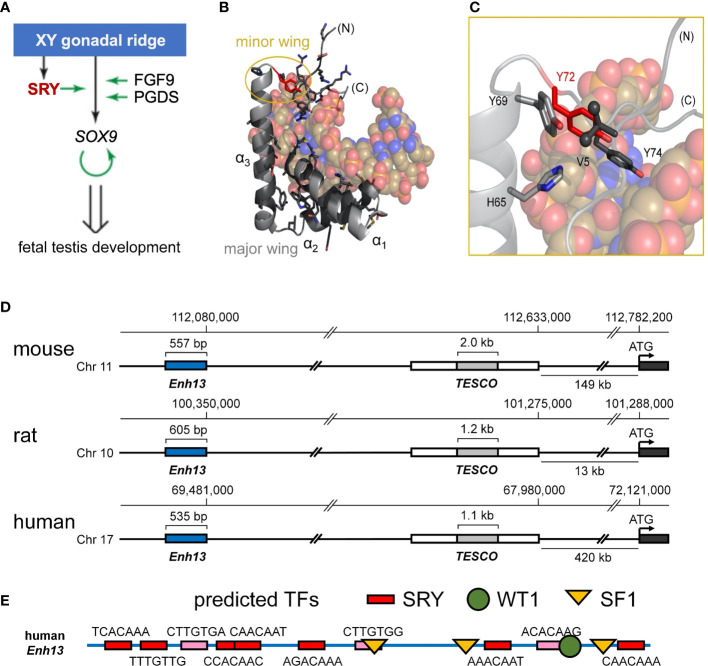
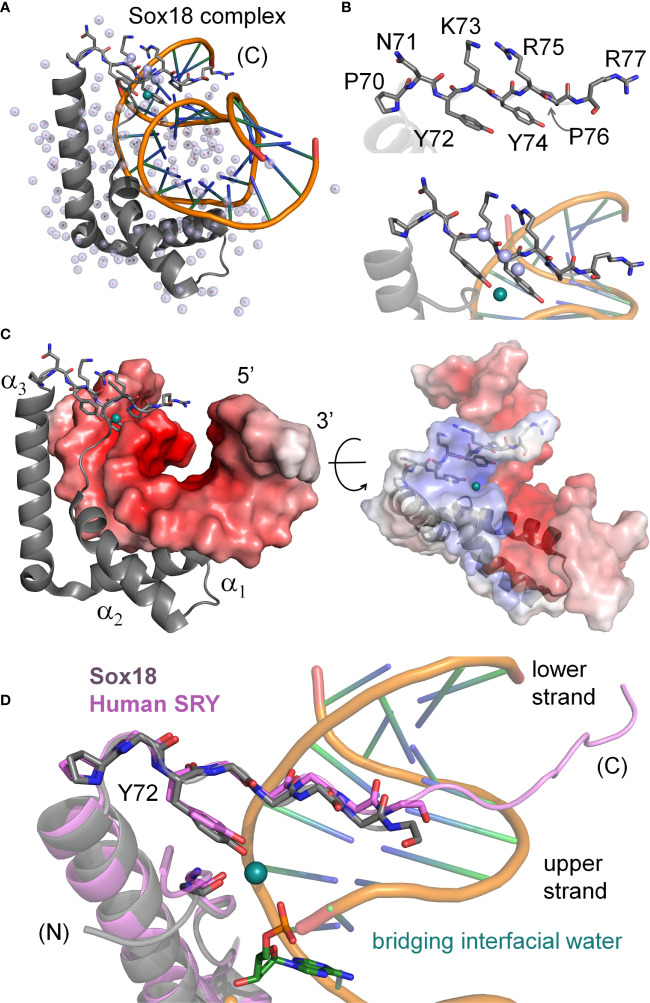
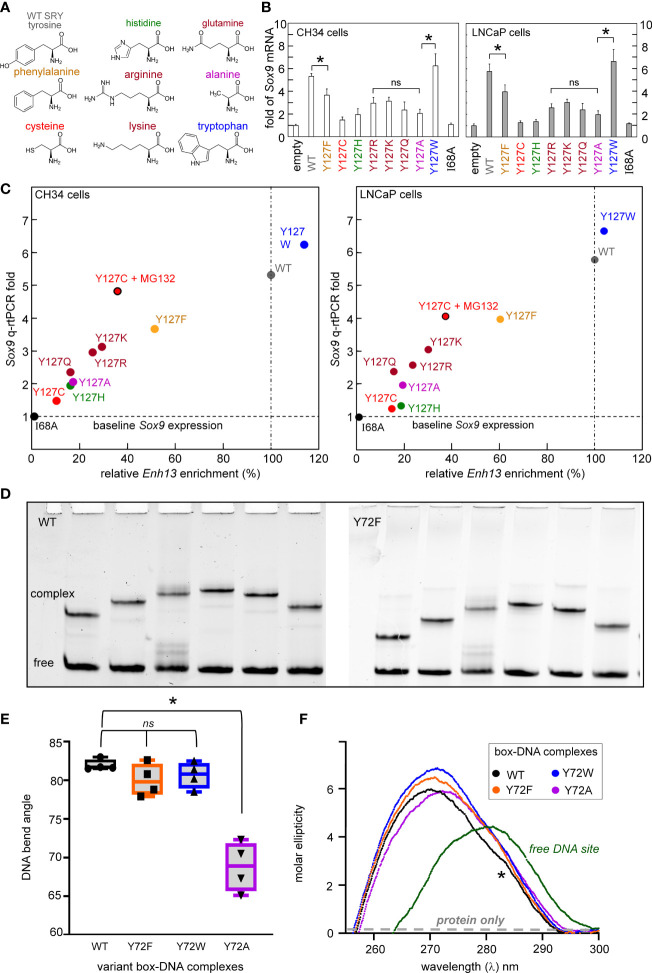
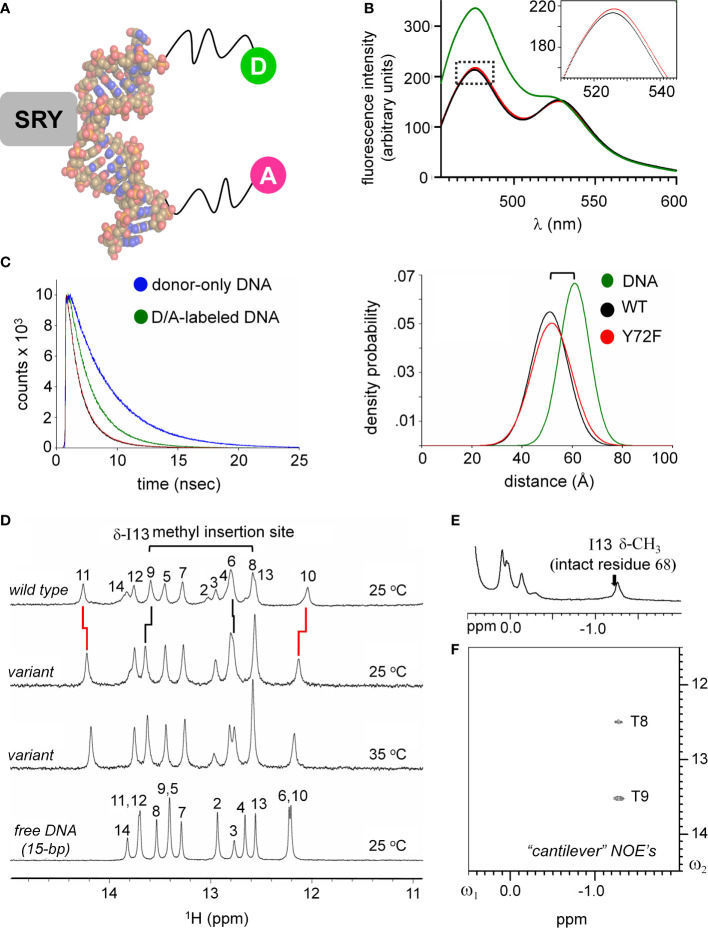
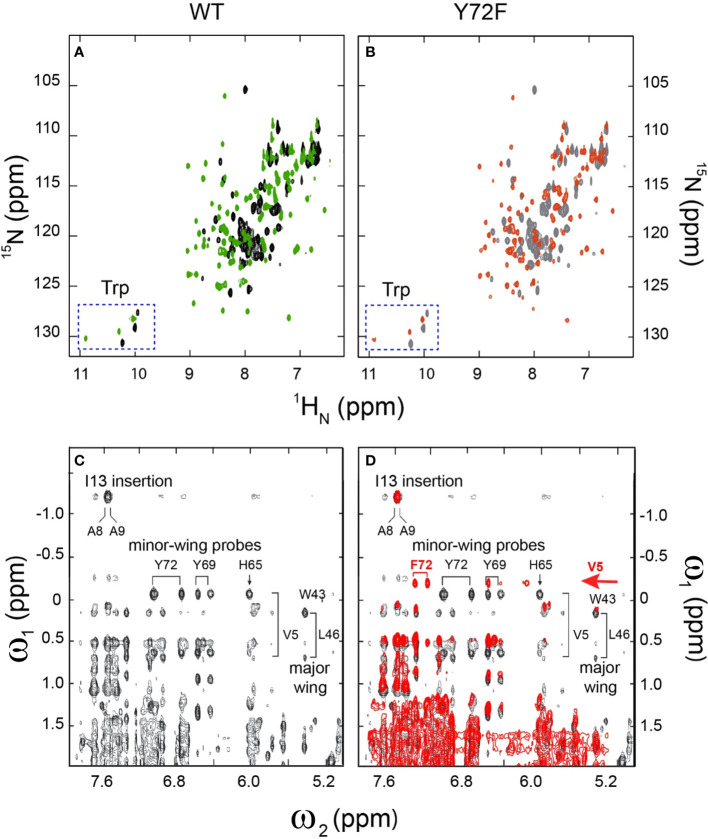
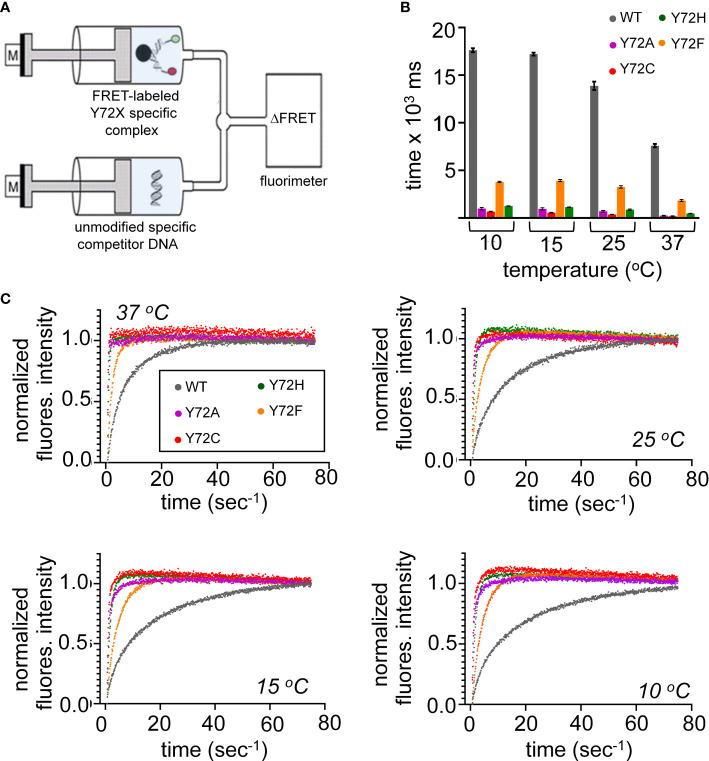
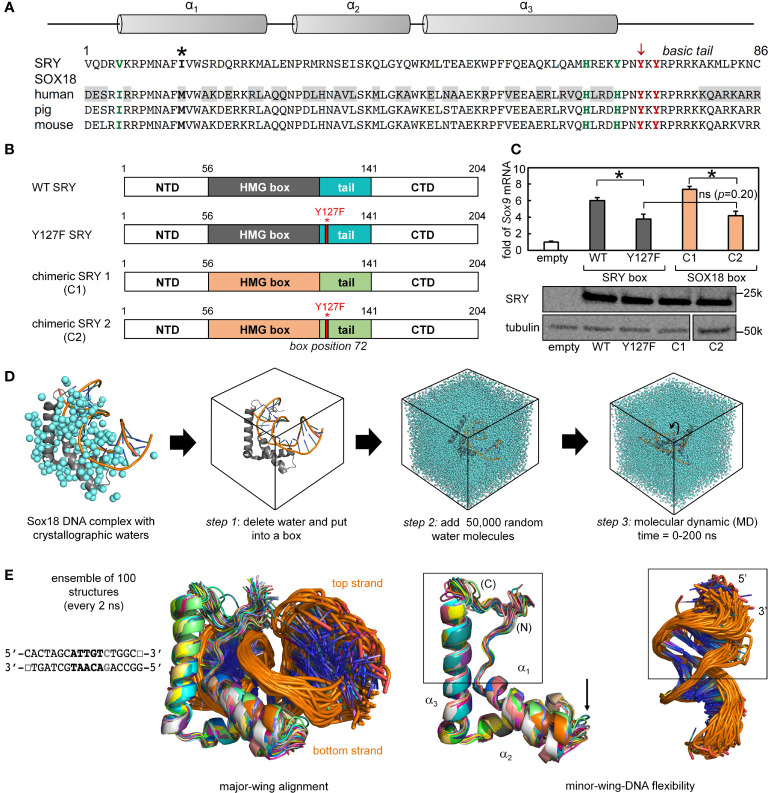
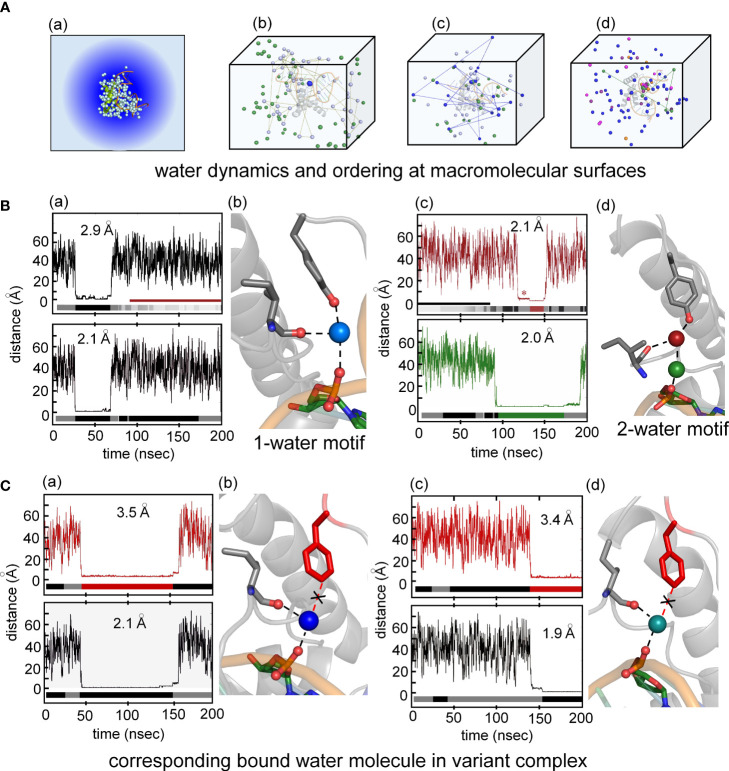
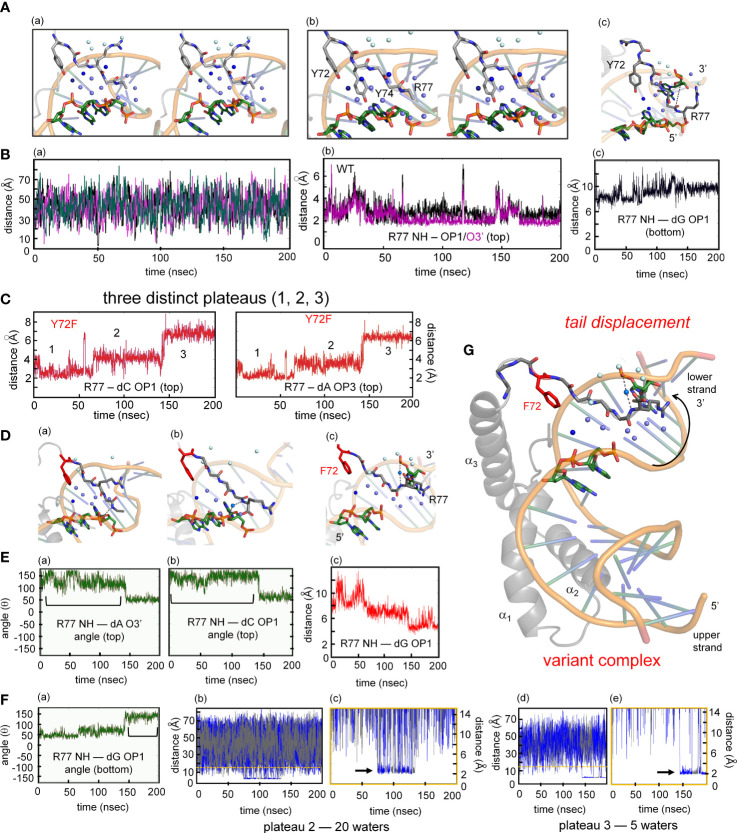
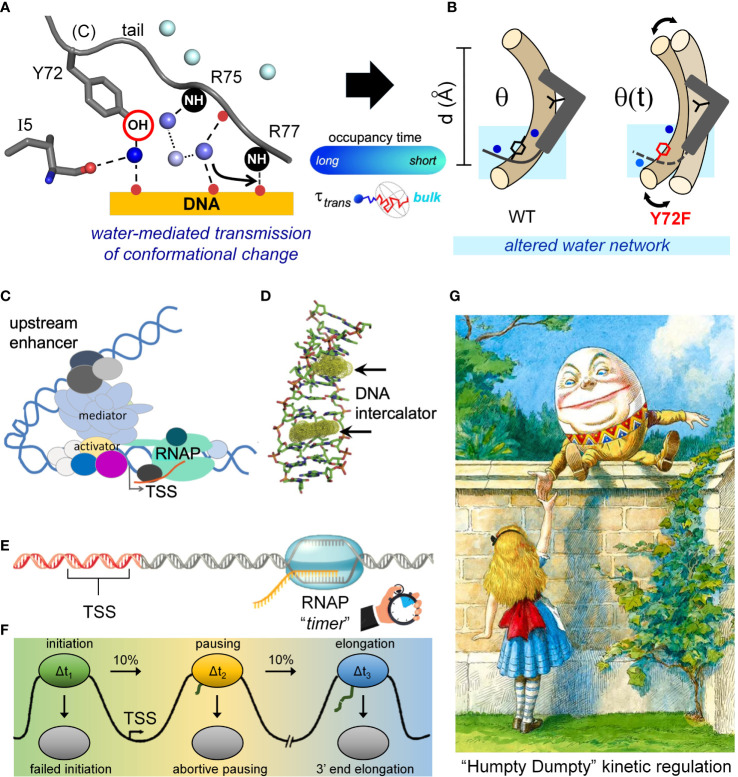
Y-encoded transcription factor SRY initiates male differentiation in therian mammals. This factor contains a high-mobility-group (HMG) box, which mediates sequence-specific DNA binding with sharp DNA bending. A companion article in this issue described sex-reversal mutations at box position 72 (residue 127 in human SRY), invariant as Tyr among mammalian orthologs. Although not contacting DNA, the aromatic ring seals the domain's minor wing at a solvent-exposed junction with a basic tail. A seeming paradox was posed by the native-like biochemical properties of inherited Swyer variant Y72F: its near-native gene-regulatory activity is consistent with the father's male development, but at odds with the daughter's XY female somatic phenotype. Surprisingly, aromatic rings (Y72, F72 or W72) confer higher transcriptional activity than do basic or polar side chains generally observed at solvated DNA interfaces (Arg, Lys, His or Gln). Whereas biophysical studies (time-resolved fluorescence resonance energy transfer and heteronuclear NMR spectroscopy) uncovered only subtle perturbations, dissociation of the Y72F complex was markedly accelerated relative to wild-type. Studies of protein-DNA solvation by molecular-dynamics (MD) simulations of an homologous high-resolution crystal structure (SOX18) suggest that Y72 para-OH anchors a network of water molecules at the tail-DNA interface, perturbed in the variant in association with nonlocal conformational fluctuations. Loss of the Y72 anchor among SRY variants presumably "unclamps" its basic tail, leading to (a) rapid DNA dissociation despite native affinity and (b) attenuated transcriptional activity at the edge of sexual ambiguity. Conservation of Y72 suggests that this water-mediated clamp operates generally among SRY and metazoan SOX domains.

Keywords: DNA dynamics; DNA intercalation; indirect readout; nucleic-acid recognition; protein hydration.


Conflict of interest statement

The authors declare that the research was conducted in the absence of any commercial or financial relationships that could be construed as a potential conflict of interest.

Figures

Figure 1
Figure 1
Biological function of Sry and structure of the HMG box. (A) Scheme of the initiation of male-sex differentiation in therian mammals. SRY (red) plays a key role in this process by activating expression of SOX9, which then autoactivates itself, leading to stage-specific expression of FGF9 and PGDS as indicated by green arrows. (B) Ribbon representation of the HMG box of the human SRY HMG box-DNA complex (PDB coordinates 1J46), HMG domain in light gray ribbon and DNA shown as atomic spheres with carbon (C) tan, nitrogen (N) blue, oxygen (O) red, and phosphorus (P) orange). Residues for which clinically relevant variants have been identified are shown in black stick models (Y72 in red). The major wing is formed by the confluence of the three helices in the L-shaped domain (3). The minor wing is formed upon DNA binding (gold circle). (C) Expanded view of the minor wing and the DNA-dependent hydrophobic mini-core (4). Residues of the hydrophobic mini-core are shown as stick models (methyl groups of the N-terminal Val 5 are shown as spheres); Y72F is shown in red. (D) Chromosomal locations of S9 upstream enhancer elements for rat, human, and mouse chromosomes. TESCO [testis enhancer sequence core (5)] is in gray, further upstream is Enhancer 13 (Enh13 (6),) region in blue. (E) Identification of consensus transcription factor binding elements within the 535 bp of the human Enh13 region. Binding site elements were identified using PROMO (7, 8).
Figure 2
Figure 2
Water-mediated bridge in Sox18 crystal structure. (A) The high-resolution structure of SOX18 (gray) bound to DNA (orange spline, blue sticks) is shown as a ribbon rendering with water molecules as light blue spheres (PDB coordinates 4Y60). Residues of the C-terminal tail [(C)] are shown as a stick model. In teal is a bridging water molecule that is hydrogen-bonded to the protein and the DNA in the crystal structure; other waters are shown as pale blue spheres. (B) Top, expanded view of the C-terminal tail residues, labeled with consensus HMG numbering scheme. Bottom, view of the Tyr72 and associated teal water at the complex interface. Other waters in pale blue spheres hydrogen bond to the polypeptide main chain NH (amide) and C=O (carbonyl) positions. (C) Sox18-DNA complex with helices of the HMG domain labeled and the DNA represented in an electrostatic potential surface map. C-terminal tail residues are shown as sticks and bridging water in teal at the protein-DNA interface. Right, rotation of the complex by ~45° and both protein and DNA shown as semi-transparent electrostatic potential surfaces. HMG ribbon is shown with tail residues as sticks. The bridging water occupancy is at the interface of the protein-DNA complex in the crystal structure. (D) Alignment of the C-terminal region Sox18 and human SRY HMG box. The Sox18 domain is in gray and the human HMG domain in light purple as indicated. Consensus positions Pro70 and Tyr72 side chains are shown as sticks as well as the polypeptide chain of the tail. The water-bridge interactions include the para-hydroxyl of Tyr72, and oxygen atoms of the DNA phosphate backbone and a carbonyl position of residue 5 in the N-terminal β-strand.
Figure 3
Figure 3
Survey of mutations at box position 72 of human SRY. (A) Structures of substituted amino acids. (B) Gene-regulatory activities activities of SRY variants tested in rodent pre-Sertoli XY cell line CH34 (left (75);) and human neoplastic XY cell line LNCaP (right (81, 82)): fold-change in Sox9/SOX9 gene expression provides functional readouts. Statistical analyses: “ns” indicates no significant difference, asterisks indicate pairwise p values< 0.05. (C) Relationship between relative SRY enrichment on a testis-specific enhancer element (Enh13) and activation of Sox9/SOX9 in CH34 (right) and LNCaP (right) cells. (D) Representative PGE studies of WT and Y72F SRY domain-DNA complexes. Each lane contains the protein-DNA complex and free DNA. Differences in mobility reflect placement of the 5’-ATTGTT-3’ target site within the 150-bp DNA fragment: respective distances in top DNA strand from its 5’-end to the bolded “TT” step are (a) 120 bp, (b) 95 bp, (c) 79 bp, (d) 51 bp, (e) 47 bp and (f) 27 bp. (E) Box-dot plot showing inferred DNA bend angles. Results of four technical replicates are shown in each case (for individual analyses of flexure-dependent electrophoretic mobilities, see Supplement Figure S6 ). In each case the solid horizontal line represents the mean bend angle, whereas the standard deviation is shown above and below the boxes. (F) Near-UV CD spectra of WT and variant domain-DNA complexes at DNA-sensitive wavelengths 250-320 nm. Spectra of complexes are shown in black (WT), orange (Y72F), blue (Y72W), and purple (Y72A) as indicated in inset; the spectrum of the free DNA is shown in green. WT complex exhibited a slight shoulder in the spectra (asterisk) not observed in variant domains. Contribution of the free protein within this range is minimal (schematic gray dashed line indicates “protein only”; data not shown). Protein-bound spectra each exhibit A-like features in accordance with widening of the DNA minor groove and overall DNA under-winding (see Supplemental Figure S6 ).
Figure 4
Figure 4
FRET and NMR studies of human SRY HMG-DNA complex. (A) Sphere representation of an SRY-directed (gray box) bent DNA structure (25). The FRET fluorophore set used in these experiments are labeled as: donor; light green sphere “D” and acceptor; magenta sphere “A” each are attached to one 5’-end of the complementary DNA strands with a hexynyl-linker (61). (B) Steady state FRET spectra of the double-labeled DNA (green), WT complex (black) and the Y72F variant domain (red). Dotted box region is expanded in inset and highlights a subtle difference in the peak maxima of the donor fluorophore for the variant complex. (C) Fluorescence decay of the donor bound to the 5’-end of the DNA using an excitation of 490 nm and detected at an emission wavelength of 520 nm. Donor-only trace in blue and the donor/acceptor-double labeled DNA (D/A-DNA) is in green. Fluorescence decay for the WT (black) and Y72F (red) mutant are similar. (Right) Skewed Gaussian models of end-to-end distance distributions comparing free DNA and the two complexes. Binding of the HMG box reduces the end-to-end distribution (black and red). The slight increased width of the mutant complex (red) reflects, primarily, long-range conformational fluctuations. (D) 1H NMR protein-DNA interactions, assignments are as indicated (numbering scheme; top); spectra of free DNA (bottom), native SRY-DNA complex (top) at 25 °C and variant-DNA complex at 25 and 35 °C (middle). Vertical segments between variant wild-type indicate small differences in chemical shifts. The resonances of base pairs 2 and 14 are broadened due to fraying. Horizontal bracket at top site of side-chain insertion between bp 8 and 9 by “cantilever” residue Ile13. (E) Two-dimensional 1H NMR NOEs diagnostic of SRY-DNA intercalation. 1H NMR (E) and NOESY spectra (F) of variant protein-DNA complex showing corresponding intermolecular NOEs involving I13-DNA. The mixing time was in each case 150 ms. Spectra were obtained at protein-DNA stoichiometries 1:1, 25 °C in 10 mM potassium phosphate (pH 7.4) and 50 mM KCl in 90% H2O and 10% D2O.
Figure 5
Figure 5
2D 1H-15N NMR HSQC footprints of free and protein–DNA complexes. (A) 2D HSQC spectral overlay of free WT (black), bound WT (green). (B) 2D HSQC spectral overlay of free Y72F(gray), bound Y72F(red). Both WT and Y72F undergo significant conformational change after binding. (C) NMR features of the DNA-stabilized minor wing, complexation shifts, and NOE contacts reflect the packing of the 1-methyl group of Val-5 within the aromatic rings of His-65, Tyr-69, and Tyr-72. (D) 2D NOESY spectral overlay of bound WT (black), bound Y72F(red). Y72F clearly shows the differences compare to WT. The new peak F72 appears in Y72F spectra and is marked in red. All spectra were acquired at 25°C.
Figure 6
Figure 6
Kinetic measurements of WT and variant HMG domains. (A) Schematic of the stopped flow FRET design. One syringe contains the labeled-DNA in complex with WT SRY HMG box or variant, a second syringe contains 20-fold excess of unmodified DNA. Rapid injection of each syringe into a cell allows for kinetic measurements. (B) Lifetimes of the bent-DNA-protein complexes. Lifetimes are derived from 1/koff (see Supplemental Table S1 ) ca from measurement at 10, 15, 25, 37 °C (x-axis). (C) Representative traces are shown for stopped flow FRET of WT and the variant domains collected at four temperatures indicated in each plot. Values in Supplemental Table S1 .
Figure 7
Figure 7
Mutation in position 72 affects the gene regulation function in SOX HMG box. (A) Schematic showing the three α-helix motifs in the HMG box domain (upper). Asterisk in sequence alignment indicates the “cantilever” intercalative residue. Bold residues in green and red highlight the important residues in forming the minor wing mini core in the associated sequences of human SRY and SOX18. Tyrosine in position 72 is indicated with an arrow (consensus HMG box number). Gray boxed residues in human SOX18 sequences indicate the residues with significant property changes compared to human SRY. (B) Schematic shows the engineered chimeric SRY design. Chimeric SRY 1 (C1) contains the HMG box of human SOX18 and the chimeric SRY 2 (C2) has a Tyr → Phe mutation in box position 72 (position indicated by red bar and full-length numbering 127) as the related clinical mutation in human SRY. (C) An SRY chimera (C1 and C2), which is expressed at a similar level to the wild-type protein as assessed by Western blot, activates the SOX9 gene in CH34 cell line. A p<0.05 (Wilcox test) indicates statistical significance for activation (*); (ns) indicates differences between the histogram of Y127F SRY and the chimeric SRY C2 (the p=0.20) that are not significant. (D) Workflow of molecular dynamic simulation (MD) calculations. Left, Sox18-DNA crystal structure (protein in gray and DNA backbone in orange) with associated crystallographic water are in cyan. Arrows indicate steps in MD calculations, simulations were run for a total of 200 ns. (E) Representative ensemble of aligned WT structures (50 in total) over the time course of the MD for SRY bound to the DNA sequence shown. Middle and rightmost panels show isolated protein and DNA ensembles, respectively. Boxed middle panel highlights fluctuations of the minor wing complementary to a region of fluctuations in DNA (boxed in right). Arrow indicates fluctuations of loop 1 in the HMG domain.
Figure 8
Figure 8
Water-mediated hydrogen at the protein-DNA interface near position 72. (A) (a) Crystal structure of the Sox18-DNA complex with associated waters (pale cyan spheres) represented in a water box with spheres of hydration. (b) the positions occupied by three water molecules during MD simulation of 200 ns for Sox18-WT to illustrate motion of bulk water (green and pale cyan). Motion of one of the bulk waters (pale cyan) traced with connecting broken lines. The bridging water between hydroxyl group of Tyr72 and phosphate of DNA tracked in blue color during single water-mediated hydrogen bond between Ile5-Tyr72-DNA. (c) Transition of one water to two water-mediated hydrogen bond involving the backbone carbonyl of Ile5-Tyr72-DNA for Sox18-DNA complex. The bridging single water (blue) in exchange with bulk water (indicated by the connected lines of its trajectory after leaving its bridging position). Over the course of time, another water (green) is accommodated between the interface of Ile5-Tyr72-DNA. (d) Two water-mediated hydrogen bonds, involving water at Ile5-Tyr72 and DNA-water (green). The protein associated waters at the interface during this phase exchange (represented by two different waters entering and leaving the site, magenta and orange). (B) (a) Course of a water during the single water-mediated hydrogen bond for Sox18-DNA held by the hydroxyl of TyrY72, the lower plateau is the residency time for this water. Distances shown are for the water hydrogen atom to the acceptor oxygen atom. Water “barcode” showed as alternating colored (black and gray) represent different water molecules that occupy this site at the interface. “Barcode” highlights the single water-mediated hydrogen bond and two water-mediated hydrogen bond phase depicted by the maroon bar. Bottom panel represent trajectory of the same water (top panel) from the DNA where the bridging interaction at the interface. A similar “barcode” for water molecules at the DNA site are shown below the trace. (b) Structural representation of a single water-mediated hydrogen bond at interface of Ile5-Tyr72-DNA of Sox18-DNA complex. The protein and DNA oxygen atoms that form the bridging hydrogen bonds are shows as spheres. The average distance between the water hydrogen atom and respective oxygen atom in each plot is shown for the plateau highlighted. (c) Two water-mediated hydrogen bond at the interface of Ile5-Tyr72-DNA for Sox18-DNA. The Tyr and Ile associated water is in maroon and the DNA water in green. The trajectories of these waters are shown in the plots along with the corresponding “water barcodes.” The asterisk highlights distances close to the para-hydroxyl but not yet hydrogen bonded. (C) (a) Trajectory plots of a water for the Y72F variant Sox18 complex. The plateau indicates a “long-lived” water close to the para-carbon (Cζ) of the Phe side chain. The “barcode” below the plot indicates water molecules that are found at this site relative to the Phe side chain for the duration of the simulation. The average distance of the para-carbon to the water for the plateau is listed. (b) Plot of the same water molecule as in (a) with respect to the DNA. The average distance of this water to the oxygen atom to its DNA hydrogen binding partner is listed. (b) Structural model of Y72F variant Sox18 complex. The Phe side chain is in red, the Ile side chain and the DNA base that are able to form hydrogen bonds to the water are shown as sticks. (c and d) Plots and models similar to (a and b), highlighting that a single-water motif for the variant simulation is observed through the entire 200 ns.
Figure 9
Figure 9
MD simulations of protein-DNA interfaces. (A) (a) Stereoview of the water network of WT SOX18-DNA complex during single water-mediated hydrogen-bond motif with the longest occupancy time in dark blue. The Tyr72-DNA bridging water is in dark blue, other interfacial waters in light blue and the bulk water in pale cyan. (b) Stereoview of the tail highlighting the Y72 and the side chain of Y74. The tyrosine at position forms a hydrogen bond with the nucleobase. (c) Structural view of the two water-mediated hydrogen-bond motif and associated interfacial waters at the end of the molecular dynamic simulation. The broken line represents the distance between Arg77 amide to an oxygen atom of a cytosine phosphate on the lower strand (chain C C7 in Sox18 box-DNA crystal structure). (B) (a) The course of five water molecule close to Arg77 amide at different time points during the MD simulation. Each of the water molecules show Brownian motion with very short occupancy times. (b) Trajectory of the WT Arg77 amide to oxygen atoms on a cytosine phosphate represented in purple and black. (c) Trajectory of WT Sox18 Arg77 amide to guanosine (chain B G14) of DNA. (C) Course of Arg77 amide and OP1 and O3’ with stepwise three distinct distance profile. (D) (a-c) Representative structural views of the variant-DNA complex from each of the distinct three distance phase of Arg77 amide and DNA. Long-lived water is observed (dark blue) and associate interfacial waters are in depicted in light blue and bulk water in pale cyan in step 1 (a), step 2 (b) and step 3 (c). The broken line represents a direct hydrogen bond between the amide of Arg77 and an oxygen of the DNA backbone. In panel (b) a water mediates the interaction between the amide of R77 and C7 (chain C), in (c) the water-mediated hydrogen bond between the amide of R77 has switched to G14 (Chain B). Panels a-c is representation of the diffusion process of bulk water at the interface in variant. (E) (a-b) Hydrogen-bond angle between Arg77 amide-O3’(a) and OP1(b) over the course of MD simulation for variant complex. Bracketed regions represent appropriate angles for hydrogen bond formation. (c) Trajectory of the amide of Arg77 to OP1 of a bottom strand guanosine indicating the shift of the tail from the top strand towards the bottom strand. (F) (a) Angle profile for amide Arg77 and OP1 of the guanosine with bracket indicates an appropriate angle for hydrogen bond. (b-e) Trajectories of the different water molecules that mediate hydrogen bond between amide of Arg77 to the DNA at plateau 2 (b) and plateau 3 (d) with expansion of respective plateau 2 (c) and 3 (e). Black arrow in each expanded panel highlights bridging water between R77 and the DNA, alternating blue and gray colors represent a different water that participates in bridging interaction. (G) Structure of the variant Sox18-DNA complex at the end of the MD time scale. The extended water network is shown with the same blue hue scheme. Positioning of the tail, especially the tail residue R77 has switched to the opposite strand (lower) indicated by a curved arrow. The water-mediated hydrogen bonding of R77 to the upper strand is shown as dashed lines.
Figure 10
Figure 10
”Humpty Dumpty” kinetic model of transcriptional regulation. (A) Schematic diagram of the Tyr72-DNA-water associated network at the interface of the tail of the HMG domain and the DNA. The long-lived bridging water is in dark blue, waters with shorter residency lifetimes are in increasing blue hues and bulk water in pale cyan. Color scale is described by gradient blue bar representing “occupancy time.” The hydroxyl (-OH) is highlighted, oxygen atoms of the DNA and Ile5 that participate in hydrogen bonds are shown as spheres. Peptide amide groups of Arg75 (R75) and Arg77 (R77) are shown as black “NH” spheres and oxygens of the carbonyl and phosphate backbone shown as red circles. Dashed bonds indicate longer occupancy of interaction compared to dotted lines. Arrow indicates site of broken direct protein-DNA interaction in the variant domain by intervening water. Conformational changes in the water network when comparing the WT and variant domains affect dynamic fluctuations of the bent DNA-protein complex (indicated by black large arrow). (B) Altered water network in the variant domain leads to partial tail displacement and increased dynamic fluctuations. Static and dynamic models of the protein-DNA complexes. Human HMG domain is represented by gray “L”-shape with intercalative Ile residue side chain indicated. C-terminal tails are shown as solid (WT) and dashed (variant) lines. The bridging waters associated at position 72-DNA interface in each complex are shown in dark blue. Intervening water in the variant complex during partial tail displacement is shown in light blue. (C) Model of enhanceosome formation including bending of the DNA by protein mediators. DNA bending by architectural transcription factors upstream of the transcriptional start site (TSS) may facilitate interactions with activator factors which in-turn may recruit and/or stabilize transcriptional machinery for transcription of target genes. (D) DNA bending can be achieved by total or partial intercalation of amino side chains between strands of DNA. Depicted are the intercalation sites on the DNA for TATA-box binding protein (TBP), which intercalates a pair of symmetrical Phe side chains (sites are indicated by outlined dots) during DNA bending (123). (E, F) Model of RNA polymerase pausing and kinetic regulation of transcription. Proposed are three states of paused RNAP in the metazoan gene regulation. In each phase the estimated amount (10%) of all RNAP-DNA complexes that move into the next phase is shown. Within each stage the duration of the RNAP pausing was estimated and represent Δt1-3 of each phase (124). (G) Classic tale of Humpty Dumpty, which represents a model in which the formation of a multi-protein transcriptional-related complex and its various paused states in transcriptional initiation regulates gene transcription. As is the case for the variant human SRY, we propose that the variant HMG domain is unable to create kinetically stable enhanceosome complexes to same extent as WT. The inability to form kinetically stable enhanceosome complexes akin to Humpty Dumpty’s inability to be “put back together” after having fallen from the wall [image from (125)].

Similar articles

Cited by

References

    1. Sinclair AH, Berta P, Palmer MS, Hawkins JR, Griffiths BL, Smith MJ, et al. . A gene from the human sex-determining region encodes a protein with homology to a conserved DNA-binding motif. Nature (1990) 346:240–4. doi: 10.1038/346240a0 - DOI - PubMed
    1. Gubbay J, Collignon J, Koopman P, Capel B, Economou A, Münsterberg A, et al. . A gene mapping to the sex-determining region of the mouse y chromosome is a member of a novel family of embryonically expressed genes. Nature (1990) 346(6281):245–50. doi: 10.1038/346245a0 - DOI - PubMed
    1. Murphy EC, Zhurkin VB, Louis JM, Cornilescu G, Clore GM. Structural basis for sry-dependent 46-X,Y sex reversal: Modulation of DNA bending by a naturally occuring point mutation. J Mol Biol (2001) 312(3):481–99. doi: 10.1006/jmbi.2001.4977 - DOI - PubMed
    1. Weiss MA. Floppy sox: Mutual induced fit in hmg (High-mobility group) box-DNA recognition. Mol Endocrinol (2001) 15:353–62. doi: 10.1210/mend.15.3.0617 - DOI - PubMed
    1. Sekido R, Lovell-Badge R. Sex determination involves synergistic action of sry and Sf1 on a specific Sox9 enhancer. Nature (2008) 453:930–4. doi: 10.1038/nature06944 - DOI - PubMed

Publication types

Supplementary concepts