

Risk prediction model establishment with tri-phasic CT image features for differential diagnosis of adrenal pheochromocytomas and lipid-poor adenomas: Grouping method
- PMID: 36568104
- PMCID: PMC9772429
- DOI: 10.3389/fendo.2022.925577
Risk prediction model establishment with tri-phasic CT image features for differential diagnosis of adrenal pheochromocytomas and lipid-poor adenomas: Grouping method
Abstract
Objectives: The purpose of this study was to establish a risk prediction model for differential diagnosis of pheochromocytomas (PCCs) from lipid-poor adenomas (LPAs) using a grouping method based on tri-phasic CT image features.
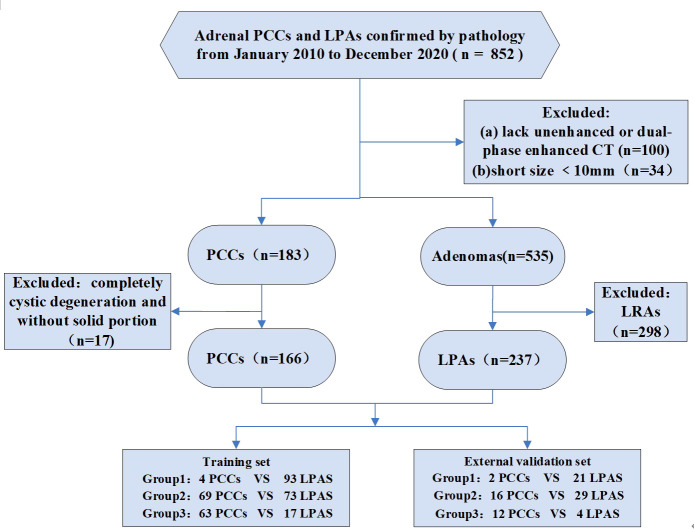
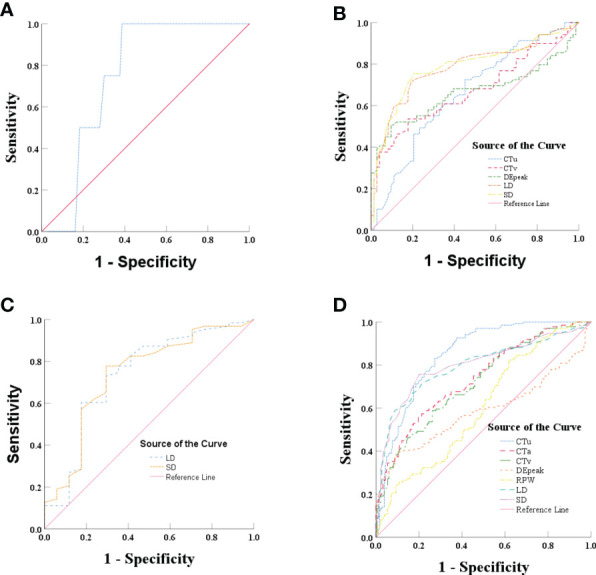
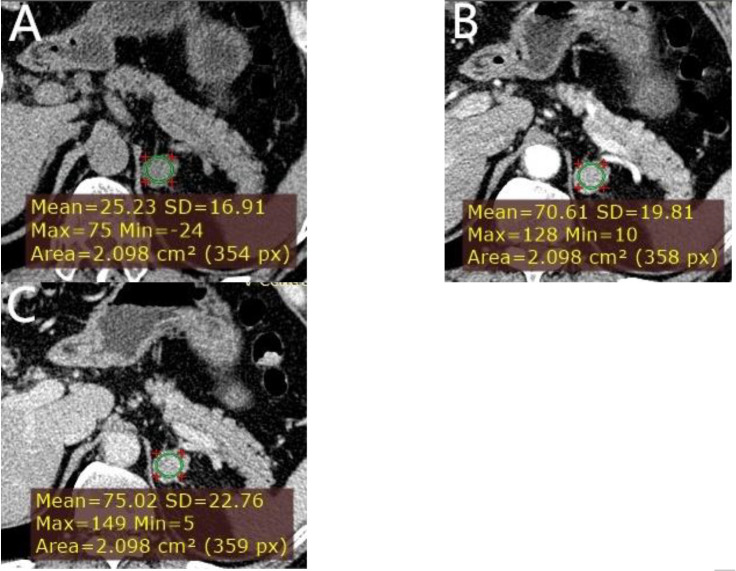
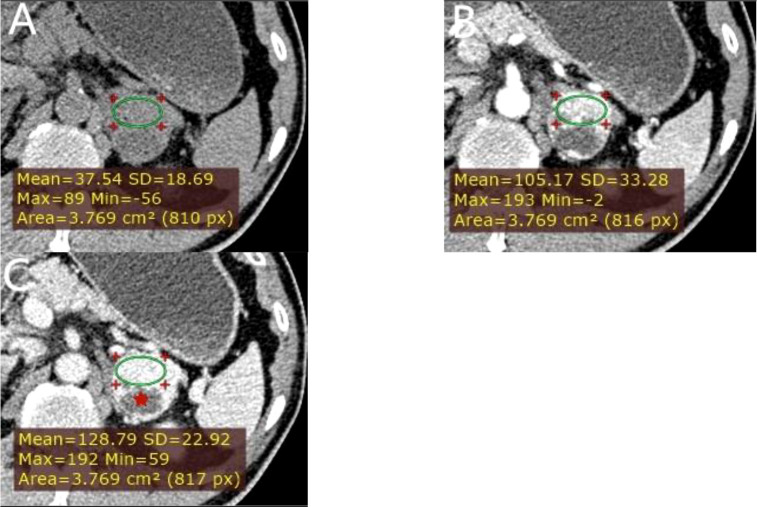
Methods: In this retrospective study, we enrolled patients that were assigned to a training set (136 PCCs and 183 LPAs) from two medical centers, along with an external independent validation set (30 PCCs and 54 LPAs) from another center. According to the attenuation values in unenhanced CT (CTu), the lesions were divided into three groups: group 1, 10 HU < CTu ≤ 25 HU; group 2, 25 HU < CTu ≤ 40 HU; and group 3, CTu > 40 HU. Quantitative and qualitative CT imaging features were calculated and evaluated. Univariate, ROC, and binary logistic regression analyses were applied to compare these features.
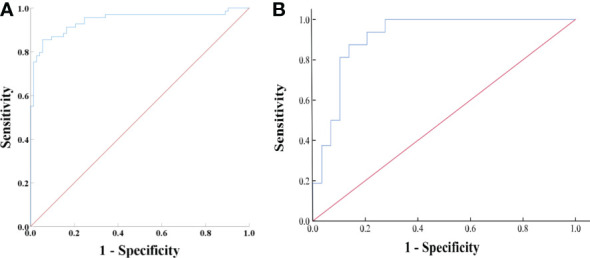
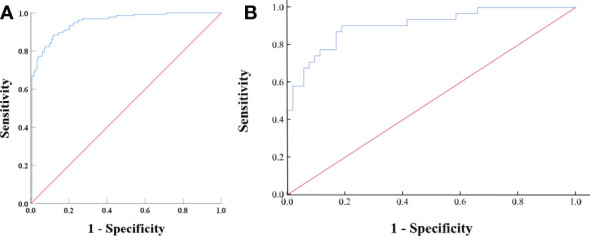
Results: Cystic degeneration, CTu, and the peak value of enhancement in the arterial and venous phase (DEpeak) were independent risk factors for differential diagnosis of adrenal PCCs from LPAs. In all subjects (groups 1, 2, and 3), the model formula for the differentiation of PCCs was as follows: Y = -7.709 + 3.617*(cystic degeneration) + 0.175*(CTu ≥ 35.55 HU) + 0.068*(DEpeak ≥ 51.35 HU). ROC curves were drawn with an AUC of 0.95 (95% CI: 0.927-0.973) in the training set and 0.91 (95% CI: 0.860-0.929) in the external validation set.
Conclusion: A reliable and practical prediction model for differential diagnosis of adrenal PCCs and LPAs was established using a grouping method.
Keywords: adenomas; adrenal; computed tomography; pheochromocytomas; risk prediction model.
Copyright © 2022 Niu, Wang, Yang, He, Wang, Xie, Shao and Zhu.
Conflict of interest statement
The authors declare that the research was conducted in the absence of any commercial or financial relationships that could be construed as a potential conflict of interest.
Figures
Similar articles
-
Differentiation of lipid-poor adenoma from pheochromocytoma on biphasic contrast-enhanced CT.Abdom Radiol (NY). 2021 Sep;46(9):4353-4361. doi: 10.1007/s00261-021-03121-9. Epub 2021 May 25. Abdom Radiol (NY). 2021. PMID: 34036424
-
Whole-lesion CT histogram analysis as an advanced technique in the portal venous phase: differentiating lipid poor adrenal adenomas from pheochromocytomas.Abdom Radiol (NY). 2025 Mar;50(3):1219-1227. doi: 10.1007/s00261-024-04575-3. Epub 2024 Sep 21. Abdom Radiol (NY). 2025. PMID: 39305291
-
MDCT of adrenal masses: Can dual-phase enhancement patterns be used to differentiate adenoma and pheochromocytoma?AJR Am J Roentgenol. 2013 Oct;201(4):834-9. doi: 10.2214/AJR.12.9753. AJR Am J Roentgenol. 2013. PMID: 24059372
-
Diagnostic Accuracy of Computed Tomography to Exclude Pheochromocytoma: A Systematic Review, Meta-analysis, and Cost Analysis.Mayo Clin Proc. 2019 Oct;94(10):2040-2052. doi: 10.1016/j.mayocp.2019.03.030. Epub 2019 Sep 9. Mayo Clin Proc. 2019. PMID: 31515105
-
[Differential diagnosis of space-occupying adrenal masses].Rofo. 1999 Oct;171(4):269-78. doi: 10.1055/s-1999-252. Rofo. 1999. PMID: 10598161 Review. German.
Cited by
-
An Integrated CT and MRI Imaging Model to Differentiate between Adrenal Adenomas and Pheochromocytomas.Cancers (Basel). 2023 Jul 23;15(14):3736. doi: 10.3390/cancers15143736. Cancers (Basel). 2023. PMID: 37509397 Free PMC article.
-
Combined nomogram for differentiating adrenal pheochromocytoma from large-diameter lipid-poor adenoma using multiphase CT radiomics and clinico-radiological features.BMC Med Imaging. 2025 Aug 4;25(1):313. doi: 10.1186/s12880-025-01835-6. BMC Med Imaging. 2025. PMID: 40760028 Free PMC article.
References
-
- Fassnacht M, Arlt W, Bancos I, Dralle H, Newell-Price J, Sahdev A, et al. . Management of adrenal incidentalomas: European society of endocrinology clinical practice guideline in collaboration with the European network for the study of adrenal tumors. Eur J Endocrinol (2016) 175:G1–G34. doi: 10.1530/EJE-16-0467 - DOI - PubMed
-
- Sawka AM, Prebtani AP, Thabane L, Gafni A, Levine M, Young WF, Jr. A systematic review of the literature examining the diagnostic efficacy of measurement of fractionated plasma free metanephrines in the biochemical diagnosis of pheochromocytoma. BMC Endocr Disord (2004) 4:2. doi: 10.1186/1472-6823-4-2 - DOI - PMC - PubMed
Publication types
MeSH terms
Substances
LinkOut - more resources
Full Text Sources
Medical