. 2022 Dec 7:12:990398.
doi: 10.3389/fonc.2022.990398. eCollection 2022.

Breast tumor IGF1R regulates cell adhesion and metastasis: alignment of mouse single cell and human breast cancer transcriptomics

Affiliations

Breast tumor IGF1R regulates cell adhesion and metastasis: alignment of mouse single cell and human breast cancer transcriptomics

Alison E Obr et al. Front Oncol. .

Abstract

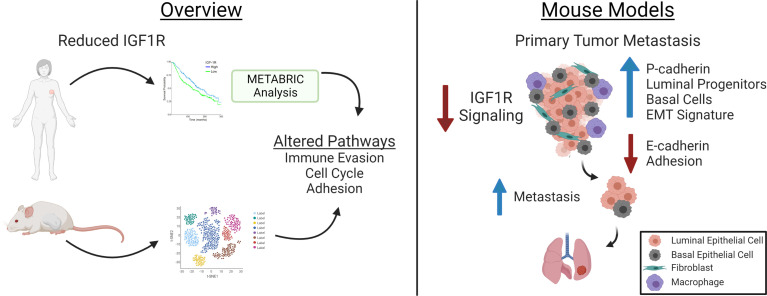
Introduction: The acquisition of a metastatic phenotype is the critical event that determines patient survival from breast cancer. Several receptor tyrosine kinases have functions both in promoting and inhibiting metastasis in breast tumors. Although the insulin-like growth factor 1 receptor (IGF1R) has been considered a target for inhibition in breast cancer, low levels of IGF1R expression are associated with worse overall patient survival.

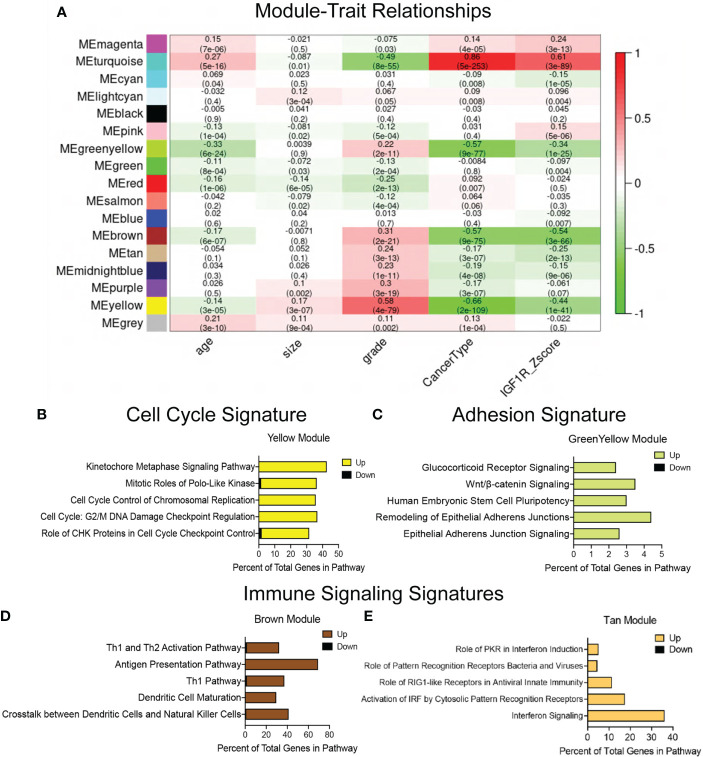
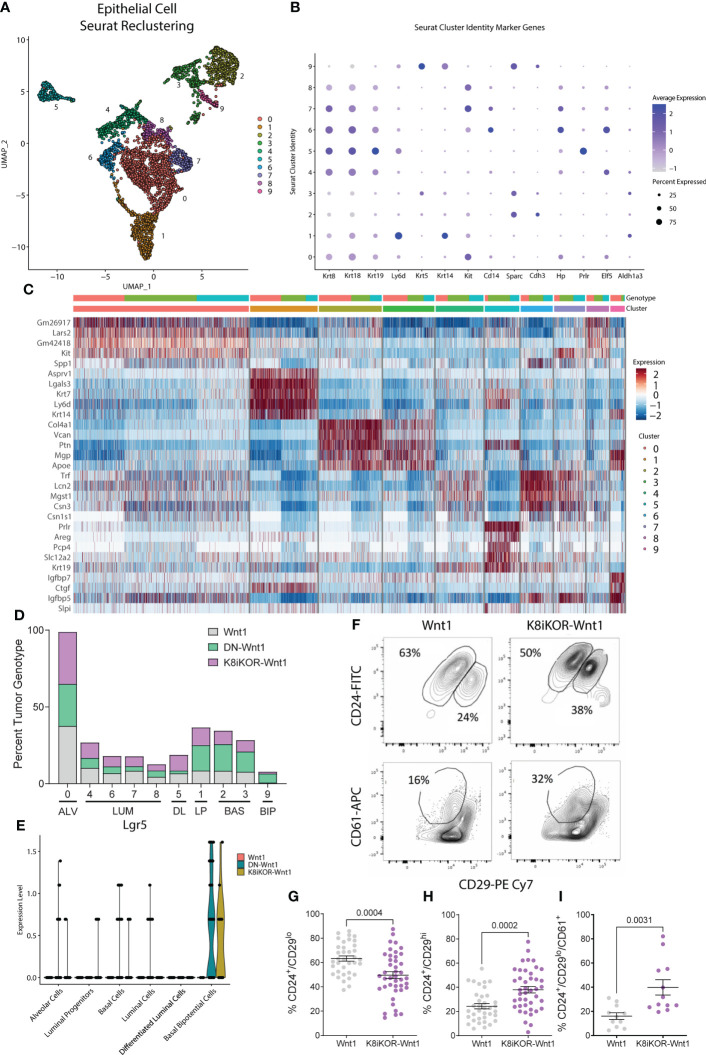
Methods: To determine how reduced IGF1R impacts tumor phenotype in human breast cancers, we used weighted gene co-expression network analysis (WGCNA) of Molecular Taxonomy of Breast Cancer International Consortium (METABRIC) patient data to identify gene modules associated with low IGF1R expression. We then compared these modules to single cell gene expression analyses and phenotypes of mouse mammary tumors with reduced IGF1R signaling or expression in a tumor model of triple negative breast cancer.

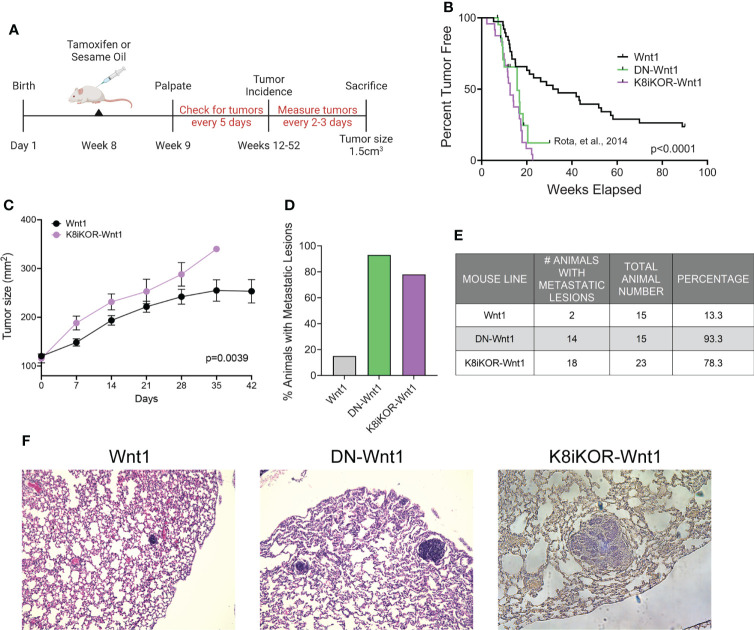
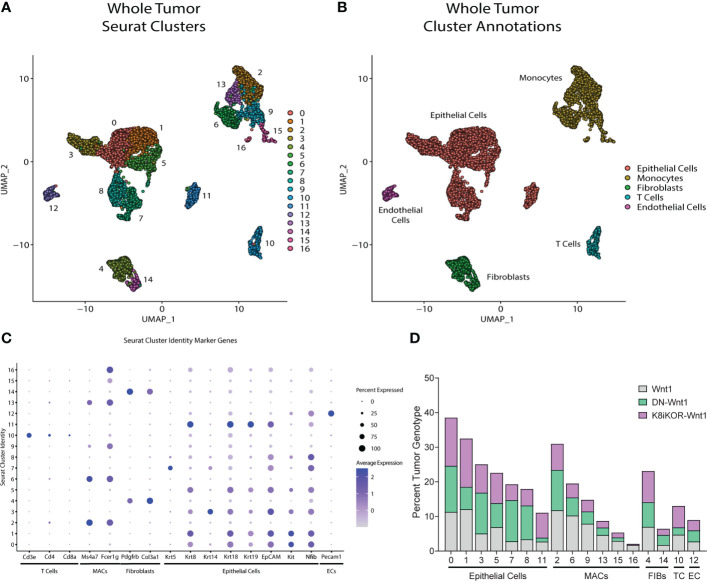
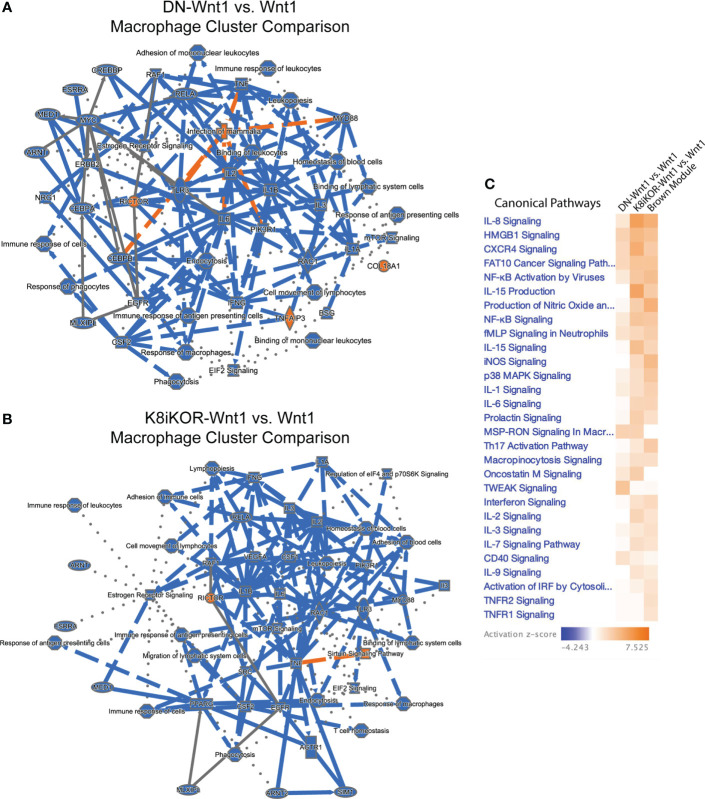
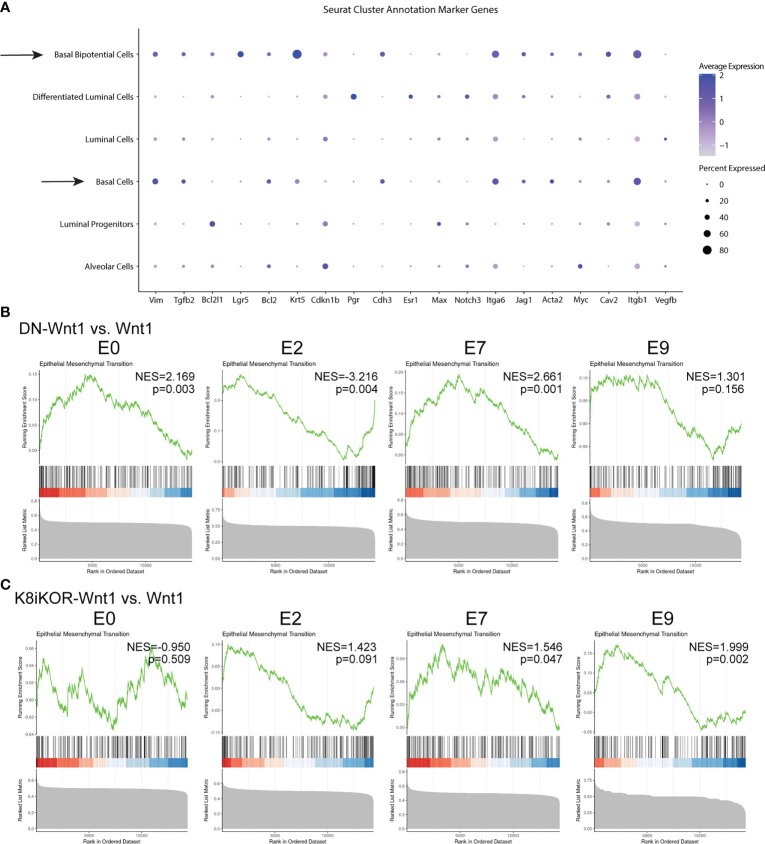
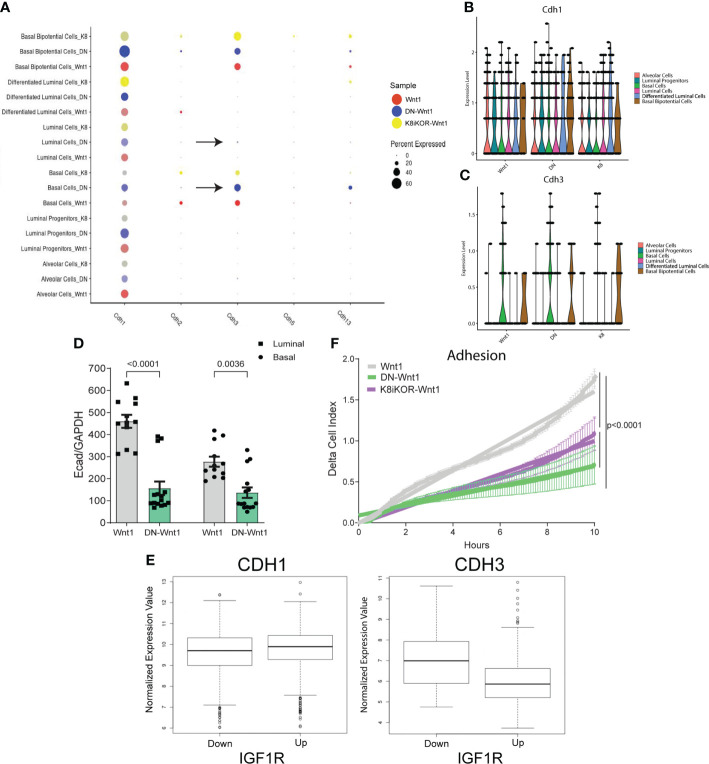
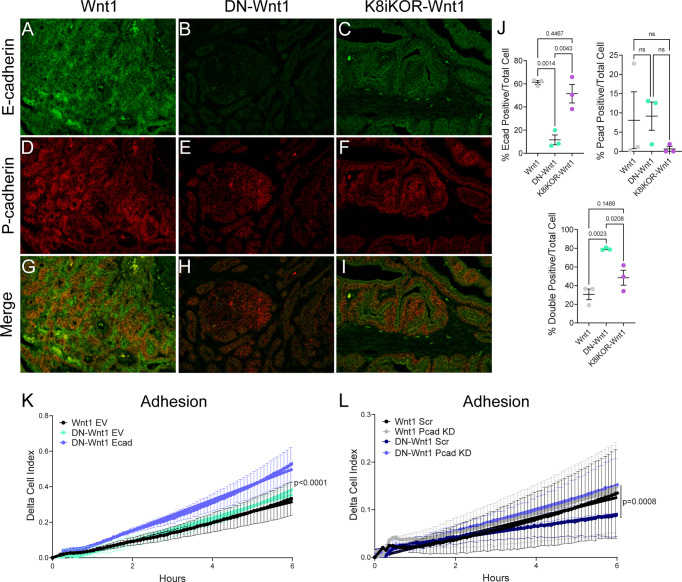
Results: WGCNA from METABRIC data revealed gene modules specific to cell cycle, adhesion, and immune cell signaling that were inversely correlated with IGF1R expression in human breast cancers. Integration of human patient data with single cell sequencing data from mouse tumors revealed similar pathways necessary for promoting metastasis in basal-like mammary tumors with reduced signaling or expression of IGF1R. Functional analyses revealed the basis for the enhanced metastatic phenotype including alterations in E- and P-cadherins.

Discussion: Human breast and mouse mammary tumors with reduced IGF1R are associated with upregulation of several pathways necessary for promoting metastasis supporting the conclusion that IGF1R normally helps maintain a metastasis suppressive tumor microenvironment. We further found that reduced IGF1R signaling in tumor epithelial cells dysregulates cadherin expression resulting in reduced cell adhesion.

Keywords: adhesion; breast cancer; cadherin; insulin-like growth factor receptor; metastasis.


Conflict of interest statement

The authors declare that the research was conducted in the absence of any commercial or financial relationships that could be construed as a potential conflict of interest.

Figures

Figure 1
Figure 1
Defining gene signatures associated with IGF1R expression and tumor phenotype in human breast cancers. (A) Table of refined integrated WGCNA (IGF1R-GS2) showing module and clinical trait association. Each row corresponds to a module eigengene (ME), each column to a clinical measurement. Each cell contains the corresponding correlation and p-value (in parentheses). The table is color-coded by correlation according to the color legend. Green < 0 for negative correlation; Red > 0, for positive correlation. (B–E) Top 5 pathways identified by ingenuity pathway analysis (IPA) revealing key signatures in 4 modules inversely correlated with IGF1R expression. (yellow module=cell cycle signature, greenyellow module=adhesion signature, brown and tan modules=immune signaling signatures).
Figure 2
Figure 2
Luminal loss of IGF1R decreases tumor latency and increases metastasis. (A) Schematic for luminal lineage Igf1r knockout. (B) Latency curve for tumor development in Wnt1, DN-Wnt1, and K8iKOR-Wnt1 animals. For K8iKOR-Wnt1 animals, tumor latency is weeks post tamoxifen injection. Statistic: Mann-Whitney test (C) Growth curve after tumors arise until time of euthanization. Statistic: Non-linear regression best fit for line slopes. (D, E) Graph of the percentage of animals (D) and table of number of animals (E) with metastatic lesions after establishment of a primary tumor. Table Statistic: Chi-square test; p = 0.0251 for Wnt1 vs. DN-Wnt1 and K8iKOR-Wnt1. For Wnt1 controls, vehicle and tamoxifen injected animals were combined as the phenotypes were equivalent. (F) Micrograph images showing examples of metastases in H&E stained lung sections from Wnt1, DN-Wnt1 and K8iKOR-Wnt1 mice with primary tumors.
Figure 3
Figure 3
Identifying mammary tumor heterogeneity by single cell RNA-sequencing. (A) Uniform Manifold Approximation and Projection (UMAP) plot of cells from Wnt1, DN-Wnt1, and K8iKOR-Wnt1 tumors resulting in 17 individual clusters. (B) UMAP plot with identification of cluster cell types defined by known markers. (C) Dot plot of cell markers. (D) Percent tumor genotype graph for each cluster. Clusters are ordered by identified tumor cells. MAC and T-cell populations were generally decreased in DN-Wnt1 and K8iKOR-Wnt1 tumors. (MACs = monocytes/macrophages, TC = T cells, FIBs = fibroblasts, EPI = epithelial cells, EC = endothelial cells).
Figure 4
Figure 4
 (A, B) Macrophage and immune signaling pathways are altered with reduced IGF1R. IPA graphical summary of top pathway alterations in DN-Wnt1 (A) or K8iKOR-Wnt1 (B) compared to Wnt1 tumors from Cluster 2 (MACs). Blue=downregulated; orange=upregulated. (C) IPA canonical pathways heat map of DN-Wnt1 and K8iKOR-Wnt1 compared to Wnt1 tumors and the METABRIC brown (immune signaling signature) module.
Figure 5
Figure 5
Epithelial cell populations are altered with reduced IGF1R. (A) UMAP plot of re-clustering of epithelial cells from Wnt1, DN-Wnt1, and K8iKOR-Wnt1 tumors resulting in 13 clusters. (B) Dot plot of epithelial cell markers. (C) Heat map of top epithelial cell type markers. Top legend: top row=tumor identity: red=Wnt1, green=DN-Wnt1, blue=K8iKOR-Wnt1; Bottom row=epithelial cell cluster. (D) Percent tumor genotype graph for each cell cluster labelled with each cell type defined by markers. (ALV=alveolar cell, LUM=luminal cell, DL=differentiated luminal cell, LP=luminal progenitor, BAS=basal cell, BIP=basal bipotential progenitor). (E) Violin plot for Lgr5 in each annotated cluster and tumor type. (F) Representative contour plots of flow cytometry of the CD24+/CD29lo (luminal) and CD24+/CD29hi (basal) cell populations and CD24+/CD29lo/CD61- (luminal progenitor) cell population in Wnt1 and K8iKOR-Wnt1 tumors. G-I. Quantification of luminal (G), basal (H), and luminal progenitor (I) populations in Wnt1 and K8iKOR-Wnt1 tumors. Each dot represents an individual tumor. Statistic: Unpaired Student’s t-test.
Figure 6
Figure 6
A metastatic and EMT phenotype is enhanced in tumors with reduced IGF1R. (A) Dot plot from all tumors of alignment with metastatic signature. Arrows depict clusters with high expression of markers indicating metastatic cell type. (B, C) GSEA plots for epithelial mesenchymal transition (EMT) hallmark signature in DN-Wnt1 vs. Wnt1 (B) and K8iKOR-Wnt1 vs. Wnt1 (C) for luminal clusters E0 and E7, basal cluster E2, and bipotential basal cluster E9. NES = normalized enrichment score. P values for each comparison are shown on each plot. Nominal p-value was calculated using 1000 permutations, with FDR correction.
Figure 7
Figure 7
Reduced IGF1R function decreases tumor cell adhesion. (A) Dot plot of various cadherins expressed in epithelial tumor cell clusters. Arrows depict clusters with an increase in P-cadherin in the DN-Wnt1 tumors. (B, C) E-cadherin (B) and P-cadherin (C) expression in annotated epithelial cell types identified with single-cell sequencing in Wnt1, DN-Wnt1, or K8iKOR-Wnt1 primary tumors. (D) RT-PCR for E-cadherin from Wnt1 or DN-Wnt1 sorted luminal and basal epithelial tumor cells. Statistic: Non-parametric Mann-Whitney U test. (E) METABRIC data analysis for E-cadherin or P-cadherin in patient tumors with low IGF1R (IGF1R z-score < -1) or high IGF1R (IGF1R z-score > 1) (p < 2.0x10⁻¹⁶) Statistic: Student’s t-test. (F) Measurement of adhesion from Wnt1 (grey), DN-Wnt1 (green), or K8iKOR-Wnt1 (purple) by delta cell index over time for 6 hours using the real-time xCELLigence assay. n=3; Statistic: Non-linear regression least squares regression for slope best fit p<0.0001 for Wnt1 control compared to DN-Wnt1 or K8iKOR-Wnt1.
Figure 8
Figure 8
Altered cadherin expression in tumors with reduced IGF1R. (A–I) Representative images of E-cadherin (green) or P-cadherin (red) immunostaining in Wnt1 (A, D, G), DN-Wnt1 (B, E, H), and K8iKOR-Wnt1 (C, F, I) primary tumors. (J) E-cadherin, P-cadherin, and double positive cell count graphs of primary tumors. Statistic: One-Way ANOVA with Tukey’s Multiple Comparison post-hoc test. K. Adhesion (delta cell index) over time in Wnt1 or DN-Wnt1 primary tumors with empty vector (EV) or E-cadherin overexpression (Ecad). n = 3; Statistic: Non-linear regression. (L) Adhesion (delta cell index) over time in Wnt1 or DN-Wnt1 with P-cadherin knockdown (Pcad KD). n = 3; Statistic: Non-linear regression.
Figure 9
Figure 9
Model for how Reduced IGF1R in Human Breast Tumors (left) and in Mouse Basal-Like Mammary Tumors results in Enhanced Metastasis. The overview panel (left) summarizes human breast cancer data showing inverse correlation between IGF1R expression and patient survival and lymph node positivity [see (9, 17)] and from METABRIC data analyses in the current manuscript showing low tumor IGF1R expression is correlated with gene expression indicating increased tumor cell invasion properties and cell cycle and decreased cell adhesion. Similar pathways were identified from scRNA-Seq of the tumors in the mouse models with reduced IGF1R signaling or expression. Analyses of the mouse models (right) revealed decreased IGF1R signaling in primary tumor epithelium resulted in increased lung metastases and alterations associated with metastasis including increased P-cadherin in E-cadherin-positive cells, increased EMT signatures in luminal and basal cell populations and in decreased E-cadherin and cell adhesion. Created with BioRender.com.

References

    1. Chaffer CL, Weinberg RA. A perspective on cancer cell metastasis. Science (2011) 331(6024):1559–64. doi: 10.1126/science.1203543 - DOI - PubMed
    1. Wang L, Zhang S, Wang X. The metabolic mechanisms of breast cancer metastasis. Front Oncol (2020) 10:602416. doi: 10.3389/fonc.2020.602416 - DOI - PMC - PubMed
    1. Lero MW, Shaw LM. Diversity of insulin and IGF signaling in breast cancer: Implications for therapy. Mol Cell Endocrinol (2021) 527:111213. doi: 10.1016/j.mce.2021.111213 - DOI - PMC - PubMed
    1. Ali R, Wendt MK. The paradoxical functions of EGFR during breast cancer progression. Signal Transduct Target Ther (2017) 2 :16042. doi: 10.1038/sigtrans.2016.42 - DOI - PMC - PubMed
    1. Carvalho I, Milanezi F, Martins A, Reis RM, Schmitt F. Overexpression of platelet-derived growth factor receptor alpha in breast cancer is associated with tumour progression. Breast Cancer Res (2005) 7(5):R788–95. doi: 10.1186/bcr1304 - DOI - PMC - PubMed