. 2022 Dec 7:12:1043675.
doi: 10.3389/fonc.2022.1043675. eCollection 2022.

A differential process mining analysis of COVID-19 management for cancer patients

Affiliations

A differential process mining analysis of COVID-19 management for cancer patients

Michel A Cuendet et al. Front Oncol. .

Erratum in

Abstract

During the acute phase of the COVID-19 pandemic, hospitals faced a challenge to manage patients, especially those with other comorbidities and medical needs, such as cancer patients. Here, we use Process Mining to analyze real-world therapeutic pathways in a cohort of 1182 cancer patients of the Lausanne University Hospital following COVID-19 infection. The algorithm builds trees representing sequences of coarse-grained events such as Home, Hospitalization, Intensive Care and Death. The same trees can also show probability of death or time-to-event statistics in each node. We introduce a new tool, called Differential Process Mining, which enables comparison of two patient strata in each node of the tree, in terms of hits and death rate, together with a statistical significance test. We thus compare management of COVID-19 patients with an active cancer in the first vs. second COVID-19 waves to quantify hospital adaptation to the pandemic. We also compare patients having undergone systemic therapy within 1 year to the rest of the cohort to understand the impact of an active cancer and/or its treatment on COVID-19 outcome. This study demonstrates the value of Process Mining to analyze complex event-based real-world data and generate hypotheses on hospital resource management or on clinical patient care.

Keywords: COVID-19; clinical pathways; oncology; process analysis; process mining.


Conflict of interest statement

The authors declare that the research was conducted in the absence of any commercial or financial relationships that could be construed as a potential conflict of interest.

Figures

Figure 1
Figure 1
The computational pipeline exploited for the analysis: (i) Preprocessing: data quality is assessed, data with excessive detail are grouped, missing data are removed or imputed and data are shaped in form of an Event Log, the usual input format for Process Mining analysis; (ii) Descriptive Statistics: several indicators are computed on the cohort at hand to suggest some possible hypotheses; (iii) Statistical Inference: statistical significance tests, future event risk predictions, and rationalization of results by domain experts. Here, other hypotheses can be added and the analysis can be enriched, looping back to one of the previous steps.
Figure 2
Figure 2
Node contents for a ΔPM analysis of a stratified dataset. An example is shown on the left and the corresponding definitions on the right. The initial dataset is split in two strata with cardinalities N 1 and N 2 . Each node shows the number of hits from both strata, noted n 1 , n 2 , plus the ratio of hits, n 1/n 2 , and the relative change of this ratio compared to the ratio of initial cardinalities, N 1/N 2 . At the bottom, a Fisher’s exact test measures if there is a significant difference between the hit ratio and the original cardinality ratio.
Figure 3
Figure 3
(A) Occurrence of COVID-19 cases among CHUV oncological patients, compared to occurrences in the Vaud region re-weighted according to age group. (B) Age distribution in oncological COVID-19 patients at CHUV, compared to the general population in the Vaud region. (C) Cancer type in COVID-19 patients at CHUV.
Figure 4
Figure 4
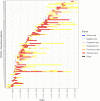
Timeline of patient journeys for active patients of the second wave going through ICU. Each line represents a patient with a coded ID number.
Figure 5
Figure 5
Workflow describing the evolution of COVID-19 patients with a cancer treated at CHUV after the initial COVID-19 Test. In each node, the number in parentheses shows the absolute count of patients passing through the node. On each edge, the upper percentage shows the the proportion of patients following that edge relative to the total number of patients exiting the node above (not the number of patients entering that node). The lower percentage shows the proportion of patients following that edge relative to the total number of patients in the root node.
Figure 6
Figure 6
(A) represents the left branch of the tree of Figure 5 and shows how the nodes can display information about the probability to die of the patients passing there. (B) is built on the same piece of graph and each node contains the time, in days, spent to reach it from the root node. The triplet of numbers represent the minimum, the median and the maximum number of days needed to reach that node.
Figure 7
Figure 7
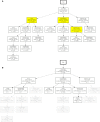
(A) differences of hits between the two waves. The percentage value can be interpreted as a higher ratio of wave 1 vs wave 2 relative to the initial ratio at the root of the tree. (B) the differences in terms of probability to die between waves. NA, not available.
Figure 8
Figure 8
Time evolution of patient number percentages with respect to the total number of patients. (A) the solid lines represent the patients in the first wave, and the dotted line the evolution of the patient in the second wave. (B) the solid lines show the evolution of patients without recent oncological treatment vs treatment-active patients.
Figure 9
Figure 9
Both (A, B) refer to the comparison of the treatment-active patients to the other oncopatients; (A) show the differences in terms of hits (B) the different probability to die. NA, not available.

References

    1. Drew DA, Nguyen LH, Ma W, Lo CH, Joshi AD, Sikavi D, et al. . Abstract s09-01: Cancer and race: Two important risk factors for covid-19 incidence as captured by the covid symptom study real-time epidemiology tool. Clin Cancer Res (2020) 26:S09–01–S09–01. doi: 10.1158/1557-3265.COVID-19-S09-01 - DOI
    1. Lee LY, Cazier JB, Angelis V, Arnold R, Bisht V, Campton NA, et al. . COVID-19 mortality in patients with cancer on chemotherapy or other anticancer treatments: a prospective cohort study. Lancet (2020) 395:1919–26. doi: 10.1016/S0140-6736(20)31173-9 - DOI - PMC - PubMed
    1. Kuderer NM, Choueiri TK, Shah DP, Shyr Y, Rubinstein SM, Rivera DR, et al. . Clinical impact of COVID-19 on patients with cancer (CCC19): A cohort study. Lancet (2020) 395:1907–18. doi: 10.1016/S0140-6736(20)31187-9 - DOI - PMC - PubMed
    1. Liang W, Guan W, Chen R, Wang W, Li J, Xu K, et al. . Cancer patients in SARS-CoV-2 infection: a nationwide analysis in China. Lancet Oncol (2020) 21:335–7. doi: 10.1016/S1470-2045(20)30096-6 - DOI - PMC - PubMed
    1. Dai M, Liu D, Liu M, Zhou F, Li G, Chen Z, et al. . Patients with cancer appear more vulnerable to SARS-CoV-2: A multicenter study during the COVID-19 outbreak. Cancer Discovery (2020) 10:783–91. doi: 10.1158/2159-8290.CD-20-0422 - DOI - PMC - PubMed

LinkOut - more resources